
Summary
How to stay in the market and navigate the rocky terrain ahead, without risking hard won gains.
A hedging program to get you out of trouble at the right time and step back in when skies are clear.
Even a modest ability to time the market can produce enormous dividends over the long haul.
Investors can benefit by using quantitative market timing techniques to strategically adjust their market exposure.
Market timing can be a useful tool to avoid major corrections, increasing investment returns, while reducing volatility and drawdowns.
The Role of Market Timing
Investors have enjoyed record returns since the market lows in March 2009, but sentiment is growing that we may be in the final stages of this extended bull run. The road ahead could be considerably rockier. How do you stay the course, without risking all those hard won gains?
The smart move might be to take some money off the table at this point. But there could be adverse tax effects from cashing out and, besides, you can’t afford to sit on the sidelines and miss another 3,000 points on the Dow. Hedging tools like index options, or inverse volatility plays such as the VelocityShares Daily Inverse VIX Short-Term ETN (NASDAQ:XIV), are too expensive. What you need is a hedging program that will get you out of trouble at the right time – and step back in when the skies are clear. We’re talking about a concept known as market timing.
Market timing is the ability to switch between risky investments such as stocks and less-risky investments like bonds by anticipating the overall trend in the market. It’s extremely difficult to do. But as Nobel prize-winning economist Robert C. Merton pointed out in the 1980s, even a modest ability to time the market can produce enormous dividends over the long haul. This is where quantitative techniques can help – regardless of the nature of your underlying investment strategy.
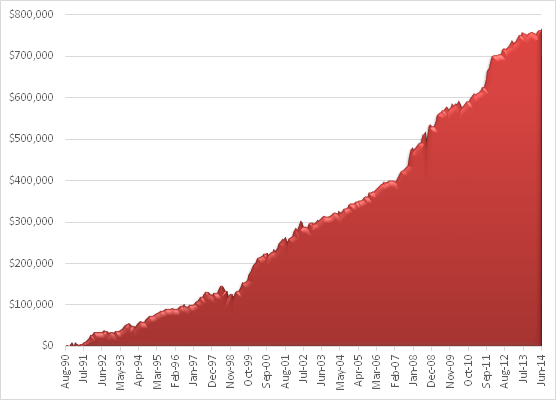
Let’s assume that your investment portfolio is correlated with a broad US equity index – we’ll use the SPDR S&P 500 Trust ETF (NYSEARCA:SPY) as a proxy, for illustrative purposes. While the market has more than doubled over the last 15 years, this represents a modest average annual return of only 7.21%, accompanied by high levels of volatility of 20.48% annually, not to mention sizeable drawdowns in 2000 and 2008/09.
Fig. 1 SPY – Value of $1,000 Jan 1999 – Jul 2014

Source: Yahoo! Finance, 2014
The aim of market timing is to smooth out the returns by hedging, and preferably avoiding altogether, periods of market turmoil. In other words, the aim is to achieve the same, or better, rates of return, with lower volatility and drawdown.
Market Timing with the VIX Index
The mechanism we are going to use for timing our investment is the CBOE VIX index, a measure of anticipated market volatility in the S&P 500 index. It is well known that the VIX and S&P 500 indices are negatively correlated – when one rises, the other tends to fall. By acting ahead of rising levels of the VIX index, we might avoid difficult market conditions when market volatility is high and returns are likely to be low. Our aim would be to reduce market exposure during such periods and increase exposure when the VIX is in decline.

Forecasting the VIX index is a complex topic in its own right. The approach I am going to take here is simpler: instead of developing a forecasting model, I am going to use an algorithm to “trade” the VIX index. When the trading model “buys” the VIX index, we will assume it is anticipating increased market volatility and lighten our exposure accordingly. When the model “sells” the VIX, we will increase market exposure.
Don’t be misled by the apparent simplicity of this approach: a trading algorithm is often much more complex in its structure than even a very sophisticated forecasting model. For example, it can incorporate many different kinds of non-linear behavior and dynamically adjust its investment horizon. The results from such a trading algorithm, produced by our quantitative modeling system, are set out in the figure below.
Fig. 2a -VIX Trading Algorithm – Equity Curve
Source: TradeStation Technologies Inc.
Fig. 2b -VIX Trading Algorithm – Performance Analysis
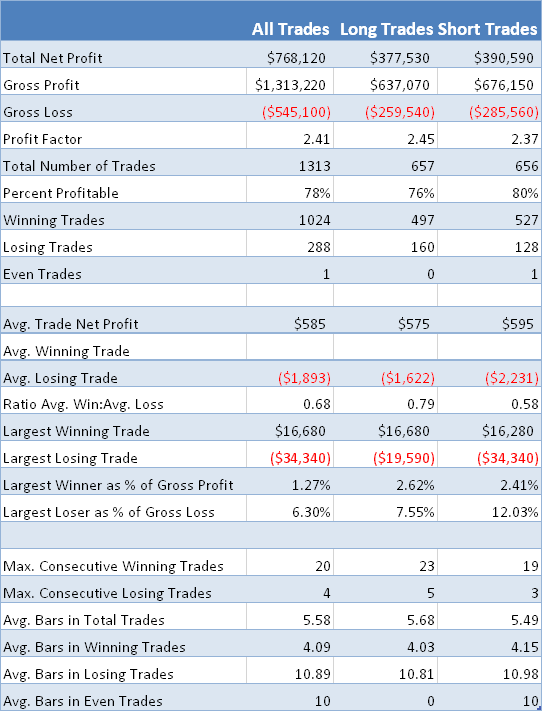
Source: TradeStation Technologies Inc.
Not only is the strategy very profitable, it has several desirable features, including a high percentage of winning trades. If this were an actual trading system, we might want to trade it in production. But, of course, it is only a theoretical model – the VIX index itself is not tradable – and, besides, the intention here is not to trade the algorithm, but to use it for market timing purposes.
Our approach is straightforward: when the algorithm generates a “buy” signal in the VIX, we will reduce our exposure to the market. When the system initiates a “sell”, we will increase our market exposure. Trades generated by the VIX algorithm are held for around five days on average, so we can anticipate rebalancing our portfolio approximately weekly. In what follows, we will assume that we adjust our position by trading the SPY ETF at the closing price the day following a signal from the VIX model. We will apply trading commissions of $1c per share and a further $1c per share in slippage.
Hedging Strategies
Let’s begin our evaluation by looking at the outcome if we adjust the SPY holding in our market portfolio by 20% whenever the VIX model generates a signal. When the model buys the VIX, we will reduce our original SPY holding by 20%, and when it sells the VIX, we will increase our SPY holding by 20%, using the original holding in the long only portfolio as a baseline. We refer to this in the chart below as the MT 20% hedge portfolio.
Fig. 3 Value of $1000 – Long only vs MT 20% hedge portfolio
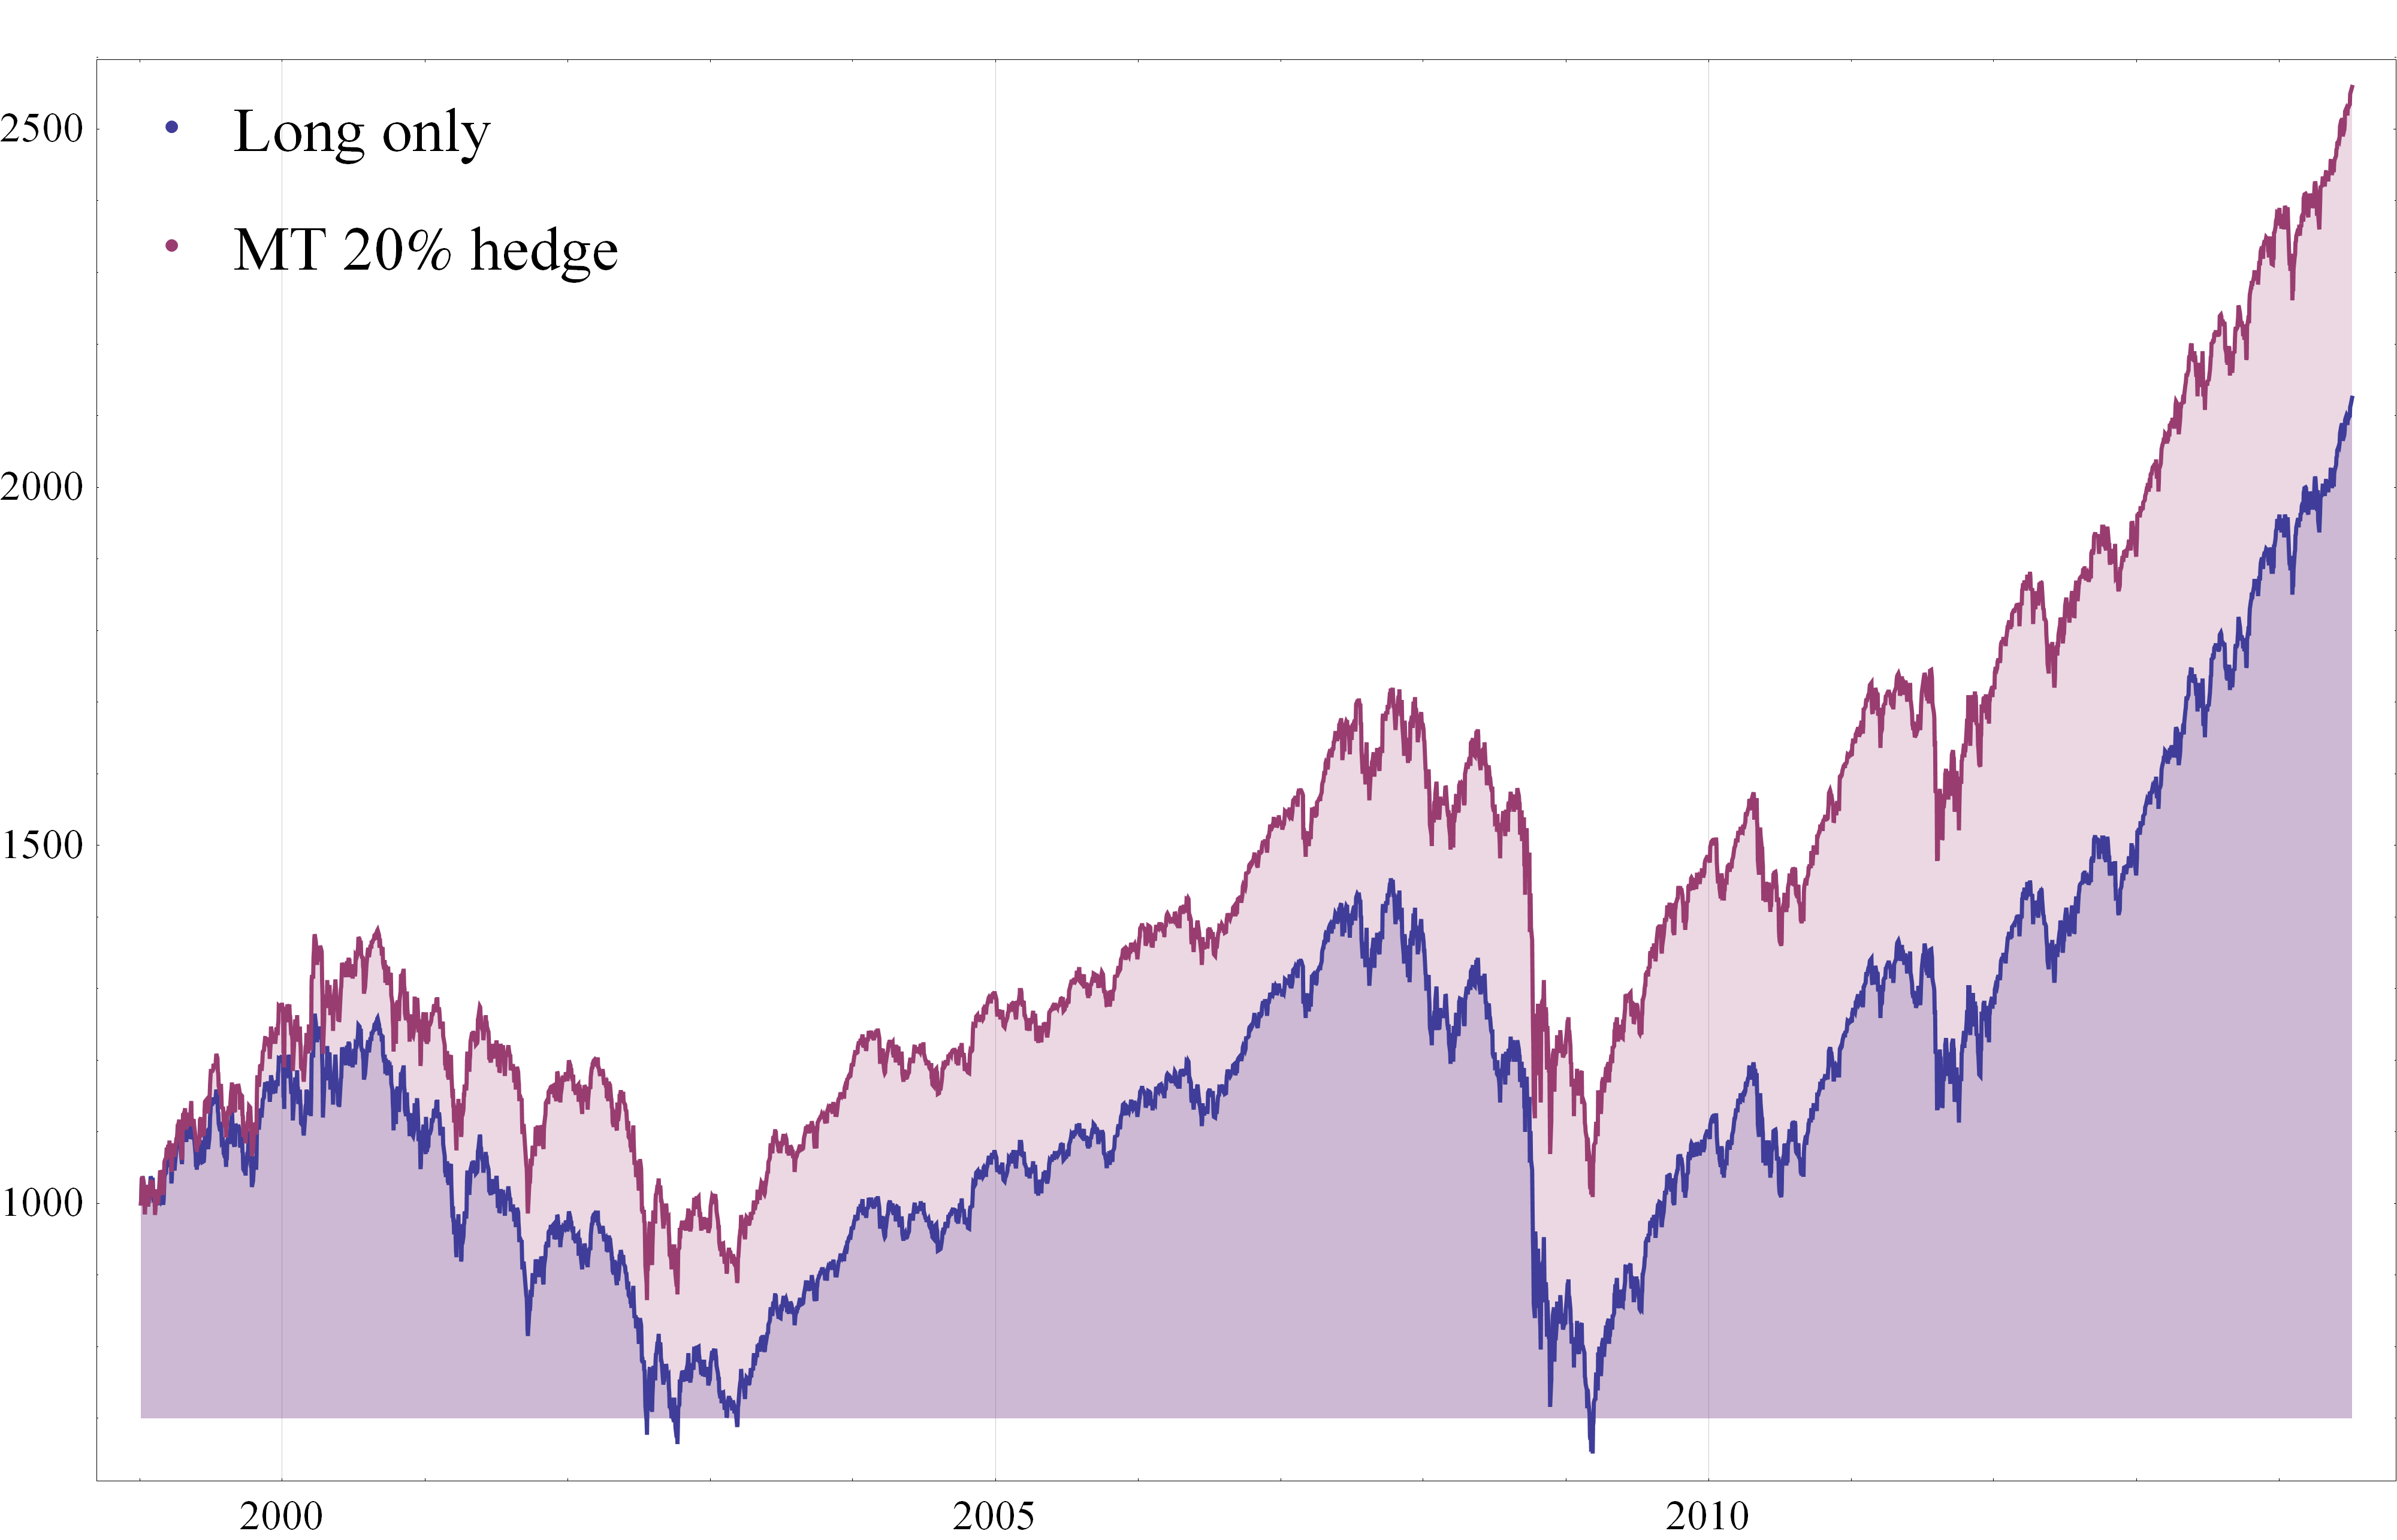
Source: Yahoo! Finance, 2014
The hedge portfolio dominates the long only portfolio over the entire period from 1999, producing a total net return of 156% compared to 112% for the SPY ETF. Not only is the rate of return higher, at 10.00% vs. 7.21% annually, volatility in investment returns is also significantly reduced (17.15% vs 20.48%). Although it, too, suffers substantial drawdowns in 2000 and 2008/09, the effects on the hedge portfolio are less severe. It appears that our market timing approach adds value.
The selection of 20% as a hedge ratio is somewhat arbitrary – an argument can be made for smaller, or larger, hedge adjustments. Let’s consider a different scenario, one in which we exit our long-only position entirely, whenever the VIX algorithm issues a buy order. We will re-buy our entire original SPY holding whenever the model issues a sell order in the VIX. We refer to this strategy variant as the MT cash out portfolio. Let’s look at how the results compare.
Fig. 4 Value of $1,000 – Long only vs MT cash out portfolio
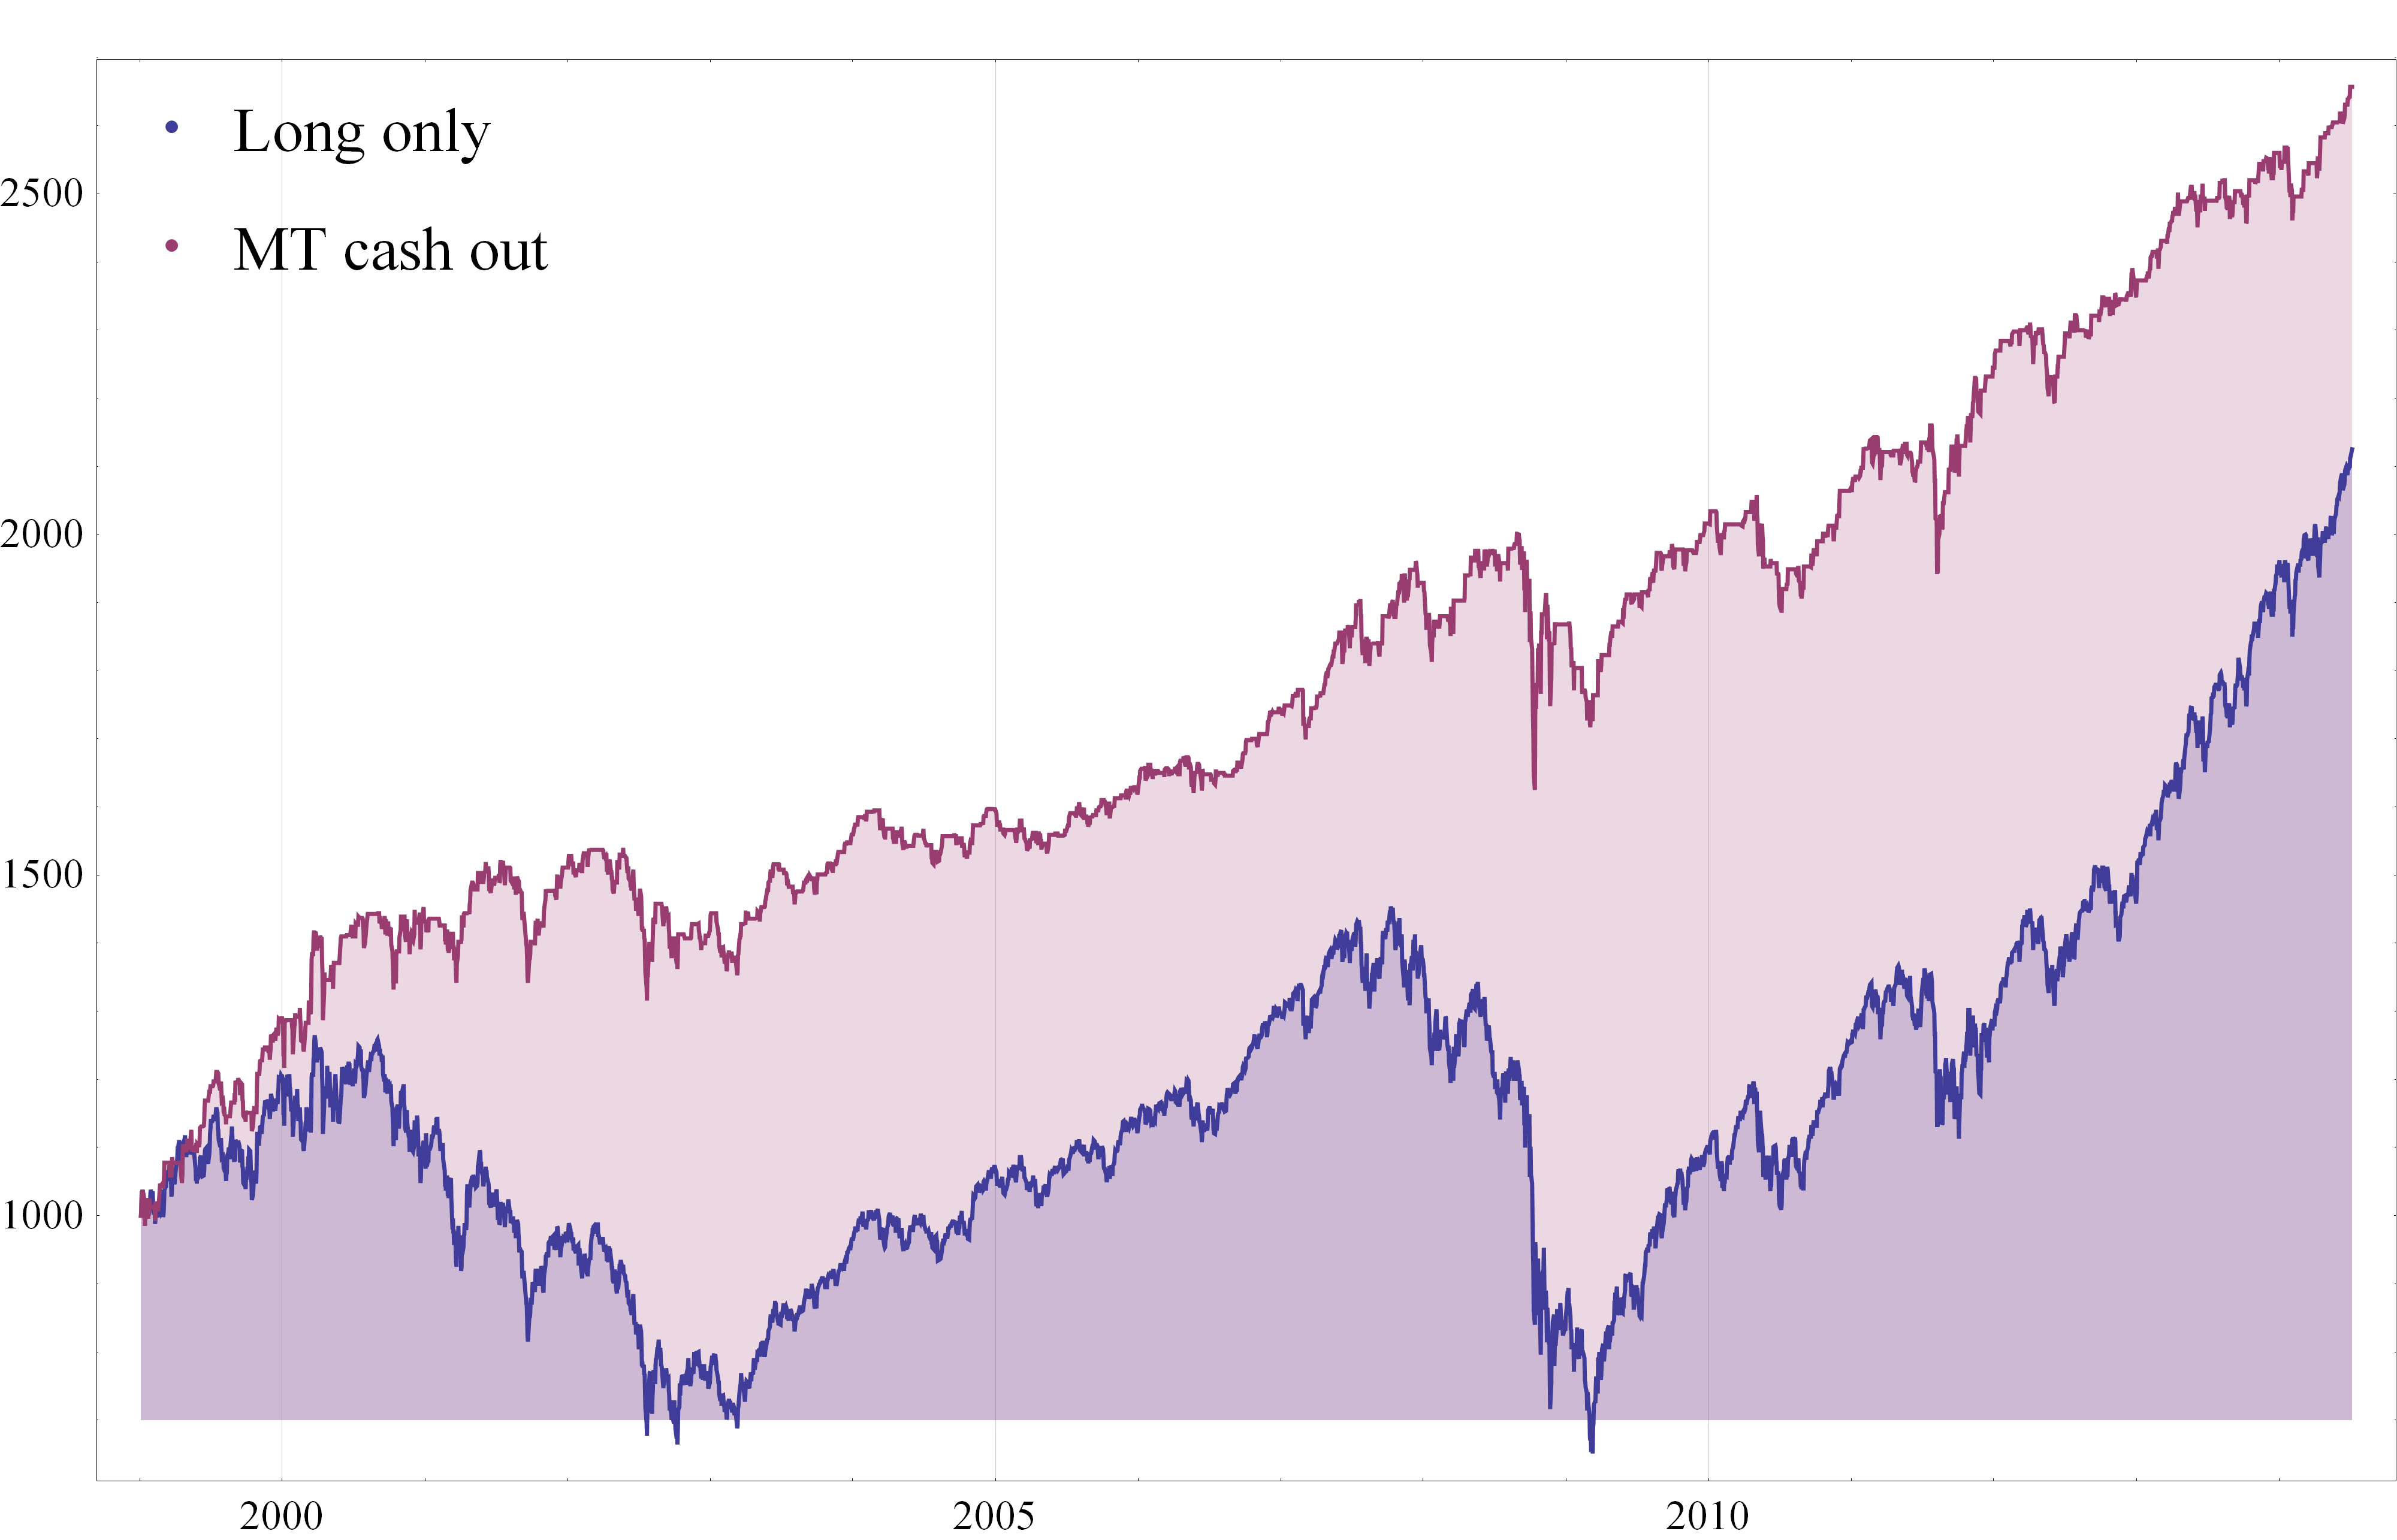
Source: Yahoo! Finance, 2014
The MT cash out portfolio appears to do everything we hoped for, avoiding the downturn of 2000 almost entirely and the worst of the market turmoil in 2008/09. Total net return over the period rises to 165%, with higher average annual returns of 10.62%. Annual volatility of 9.95% is less than half that of the long only portfolio.
Finally, let’s consider a more extreme approach, which I have termed the “MT aggressive portfolio”. Here, whenever the VIX model issues a buy order we sell our entire SPY holding, as with the MT cash out strategy. Now, however, whenever the model issues a sell order on the VIX, we invest heavily in the market, buying double our original holding in SPY (i.e. we are using standard, reg-T leverage of 2:1, available to most investors). In fact, our average holding over the period turns out to be slightly lower than for the original long only portfolio because we are 100% in cash for slightly more than half the time. But the outcome represents a substantial improvement.
Fig. 5 Value of $1,000 – Long only vs. MT aggressive portfolio
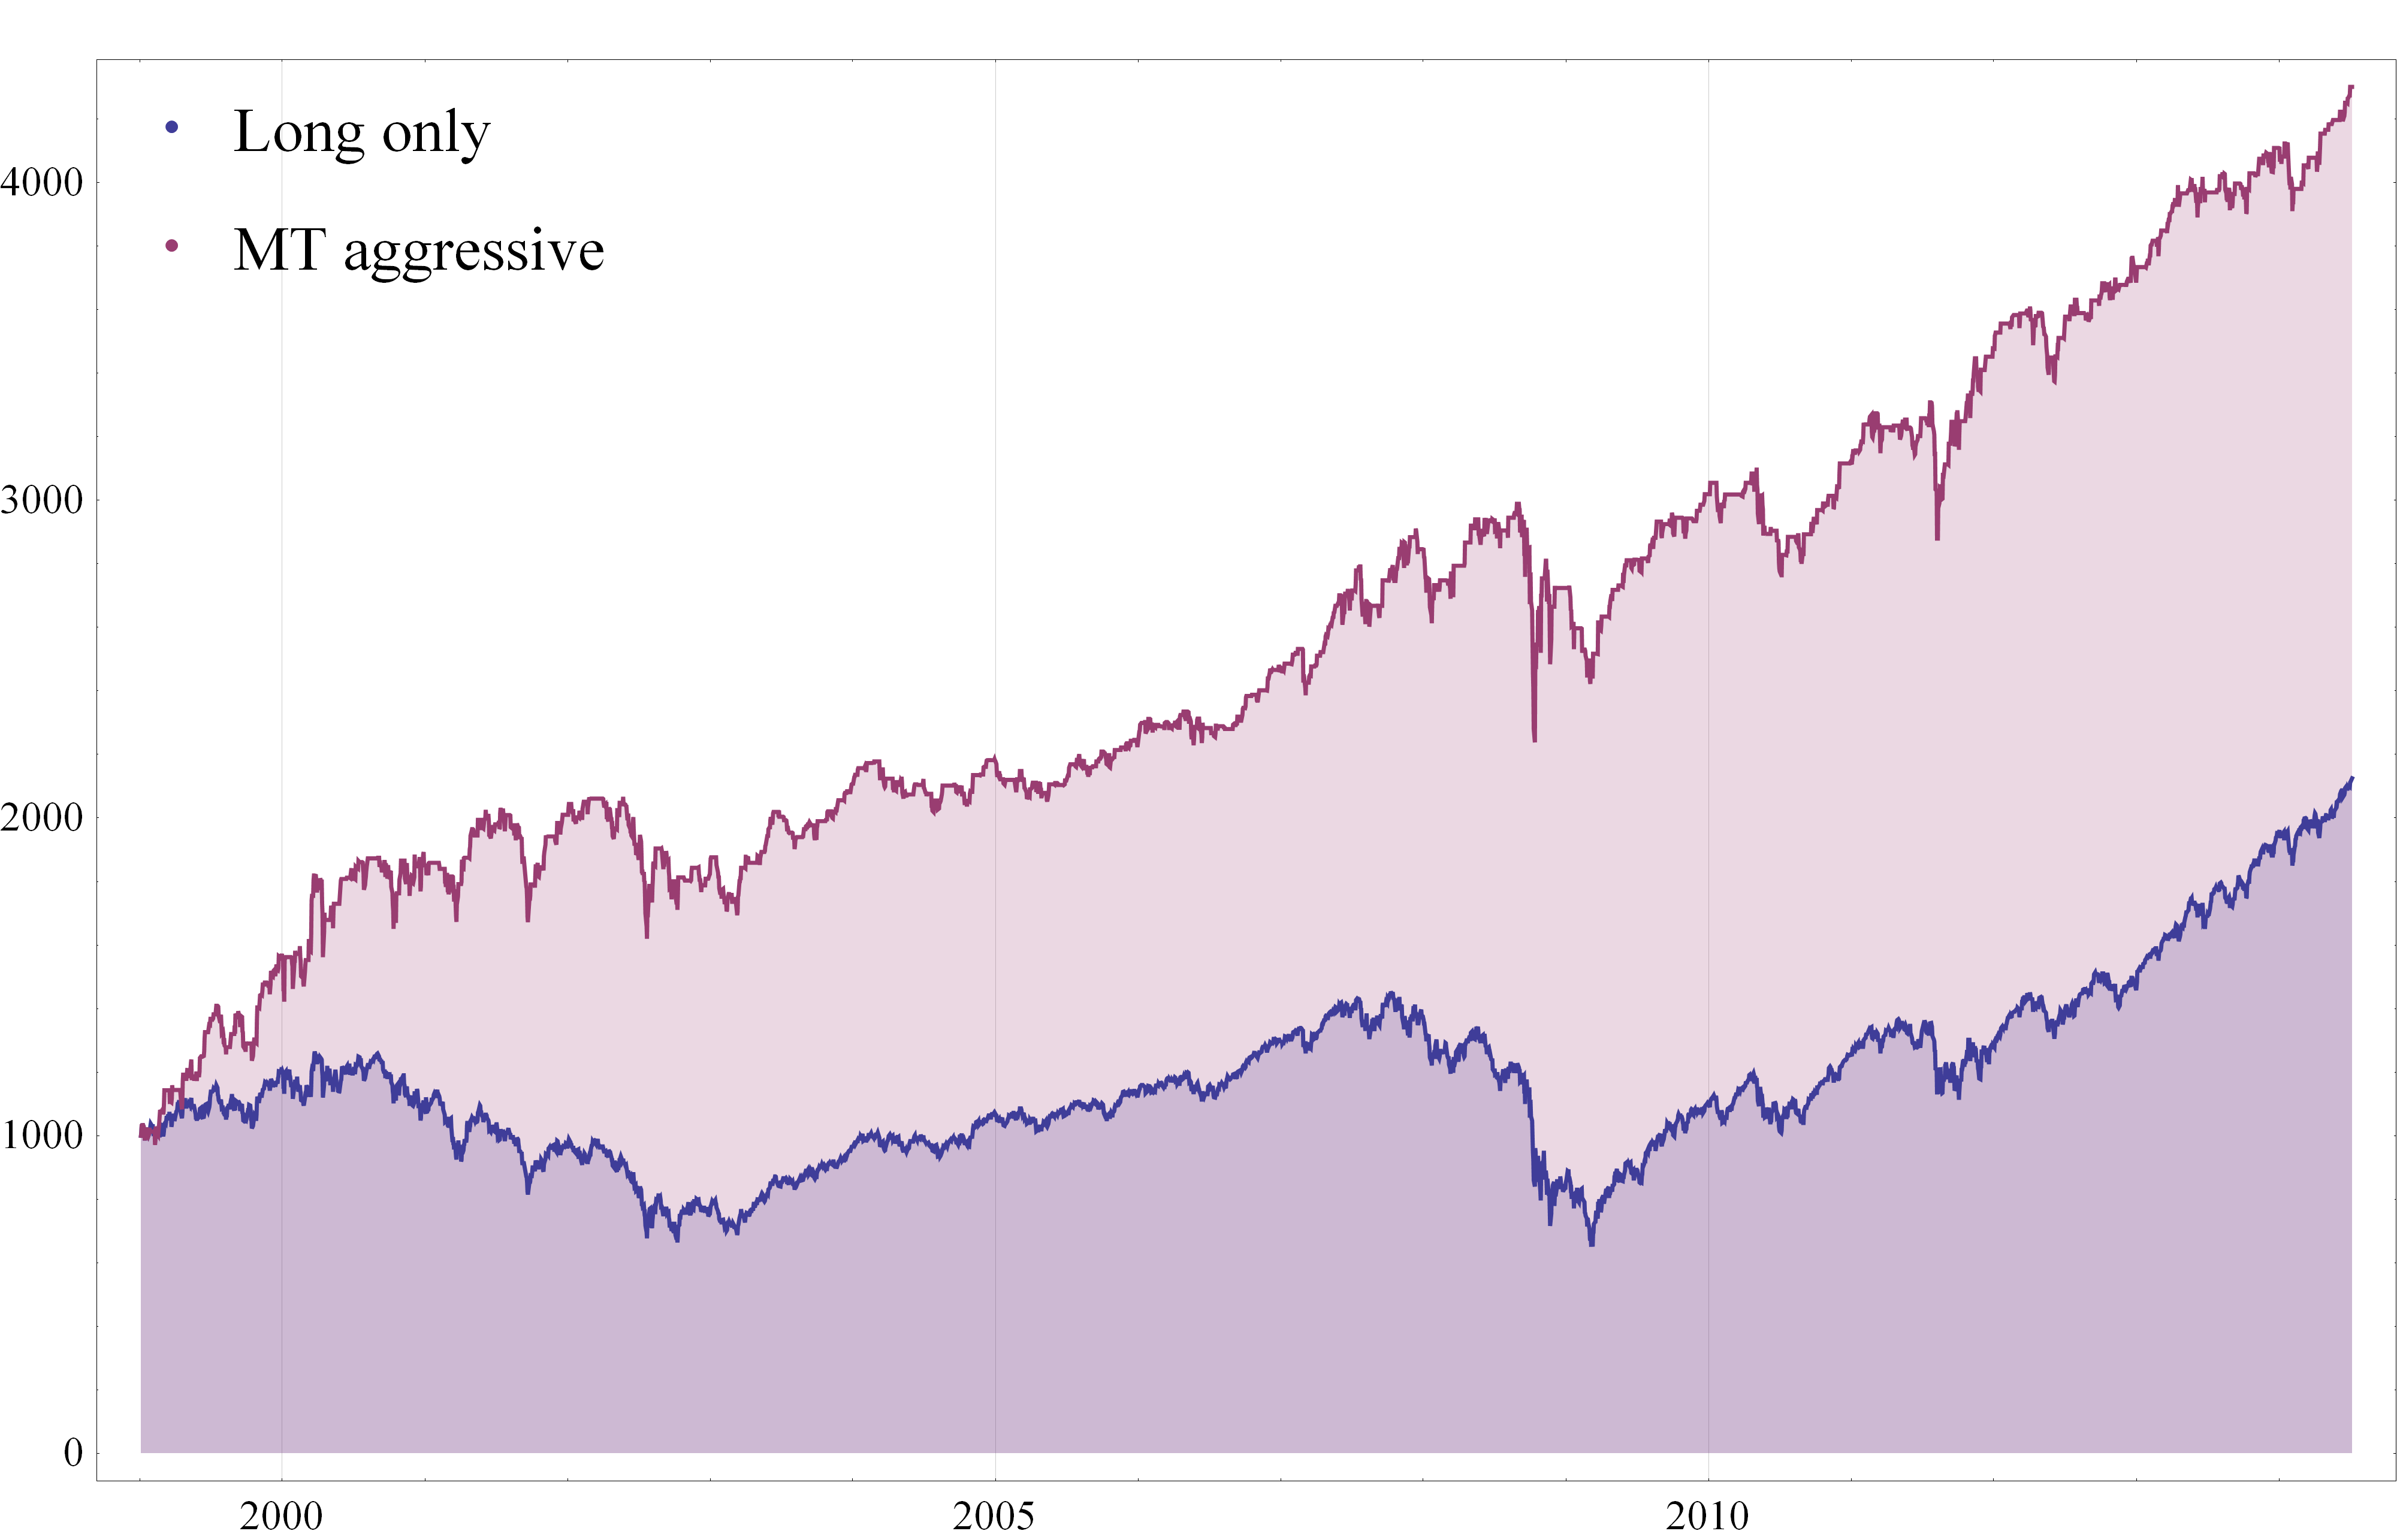
Source: Yahoo! Finance, 2014
Total net returns for the MT aggressive portfolio at 330% are about three times that of the original long only portfolio. Annual volatility at 14.90% is greater than for the MT cash out portfolio due to the use of leverage. But this is still significantly lower than the 20.48% annual volatility of the long only portfolio, while the annual rate of return of 21.16% is the highest of the group, by far. And here, too, the hedge strategy succeeds in protecting our investment portfolio from the worst of the effects of downturns in 2000 and 2008.
Conclusion
Whatever the basis for their underlying investment strategy, investors can benefit by using quantitative market timing techniques to strategically adjust their market exposure. Market timing can be a useful tool to avoid major downturns, increasing investment returns while reducing volatility. This could be especially relevant in the weeks and months ahead, as we may be facing a period of greater uncertainty and, potentially at least, the risk of a significant market correction.
Disclosure: The author has no positions in any stocks mentioned, and no plans to initiate any positions within the next 72 hours. The author wrote this article themselves, and it expresses their own opinions. The author is not receiving compensation for it (other than from Seeking Alpha). The author has no business relationship with any company whose stock is mentioned in this article.