Daytrading Index Futures Arbitrage

Trading with Indices

I have always been an advocate of incorporating index data into one’s trading strategies.  Since they are not tradable, the “market” in index products if often highly inefficient and displays easily identifiable patterns that can be exploited by a trader, or a trading system.  In fact, it is almost trivially easy to design “profitable” index trading systems and I gave a couple of examples in the post below, including a system producing stellar results in the S&P 500 Index.


http://jonathankinlay.com/2016/05/trading-with-indices/

Of course such systems are not directly useful.  But traders often use signals from such a system as a filter for an actual trading system.  So, for example, one might look for a correlated signal in the S&P 500 index as a means of filtering trades in the E-Mini futures market or theSPDR S&P 500 ETF (SPY).

Multi-Strategy Trading Systems

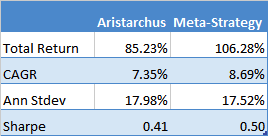
This is often as far as traders will take the idea, since it quickly gets a lot more complicated and challenging to build signals generated from an index series into the logic of a strategy designed for related, tradable market. And for that reason, there is a great deal of unexplored potential in using index data in this way.  So, for instance, in the post below I discuss a swing trading system in the S&P500 E-mini futures (ticker: ES) that comprises several sub-systems build on prime-valued time intervals.  This has the benefit of minimizing the overlap between signals from multiple sub-systems, thereby increasing temporal diversification.

http://jonathankinlay.com/2018/07/trading-prime-market-cycles/

A critical point about this system is that each of sub-systems trades the futures market based on data from both the E-mini contract and the S&P 500 cash index.  A signal is generated when the system finds particular types of discrepancy between the cash index and corresponding futures, in a quasi risk-arbitrage.

SSALGOTRADING AD

Arbing the NASDAQ 100 Index Futures

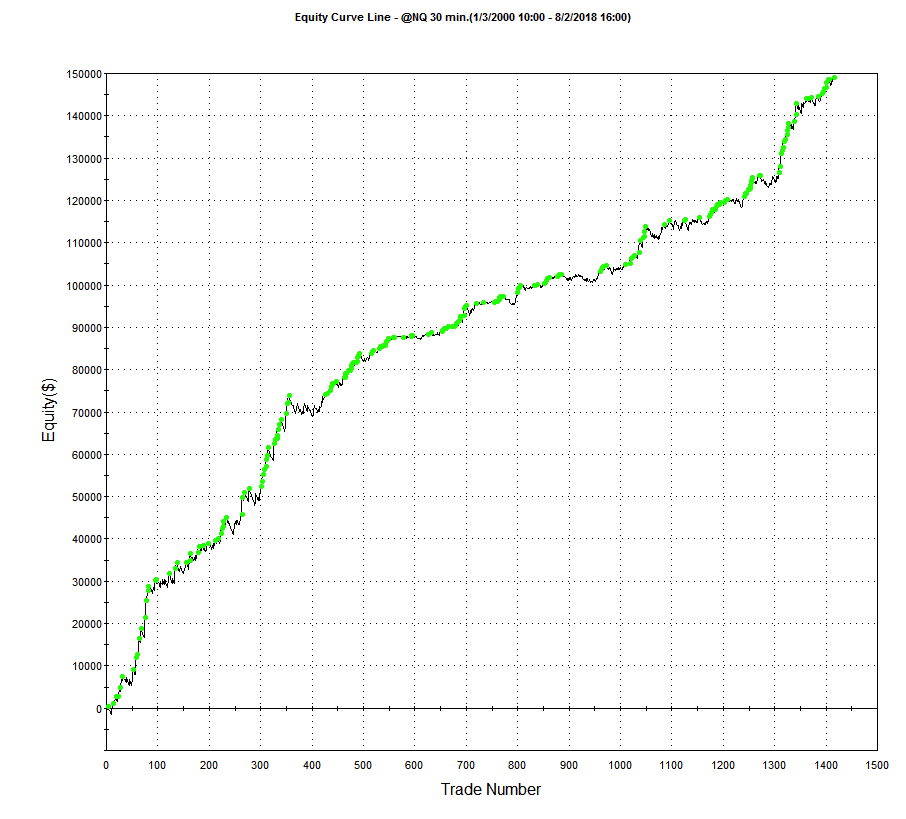
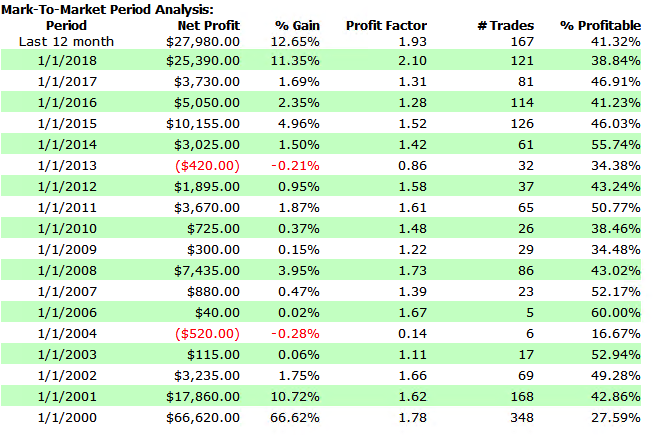
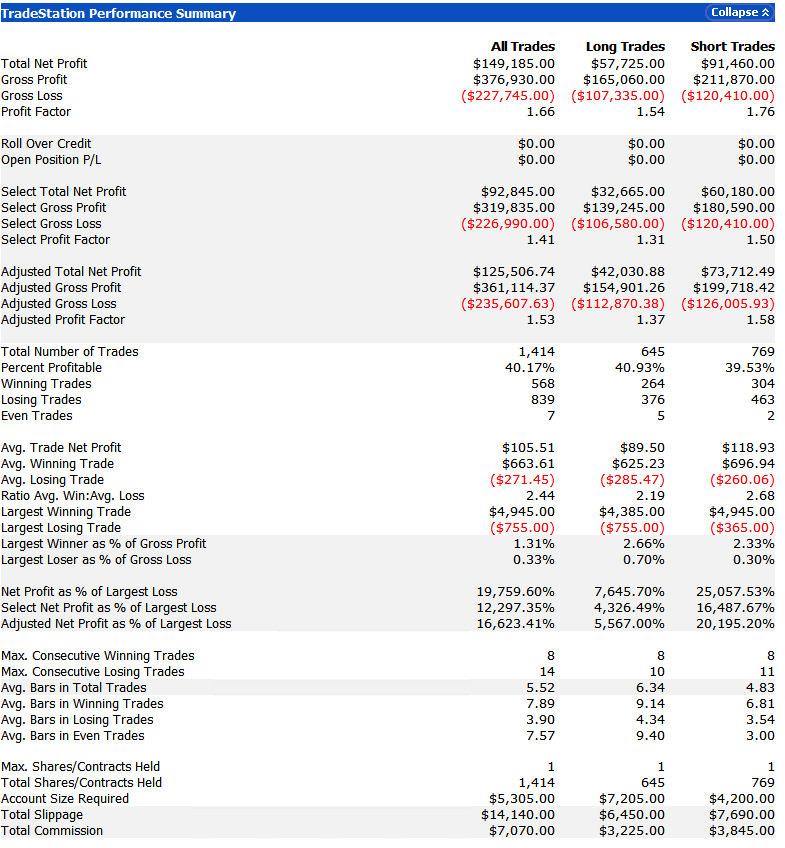
Developing trading systems for the S&P500 E-mini futures market is not that hard.  A much tougher challenge, at least in my experience, is presented by the E-mini NASDAQ-100 futures (ticker: NQ).  This is partly to do with the much smaller tick size and different market microstructure of the NASDAQ futures market. Additionally, the upward drift in equity related products typically favors strategies that are long-only.  Where a system trades both long and short sides of the market, the performance on the latter is usually much inferior.  This can mean that the strategy performs poorly in bear markets such as 2008/09 and, for the tech sector especially, the crash of 2000/2001.  Our goal was to develop a daytrading system that might trade 1-2 times a week, and which would perform as well or better on short trades as on the long side.  This is where NASDAQ 100 index data proved to be especially helpful.  We found that discrepancies between the cash index and futures market gave particularly powerful signals when markets seemed likely to decline.  Using this we were able to create a system that performed exceptionally well during the most challenging market conditions. It is notable that, in the performance results below (for a single futures contract, net of commissions and slippage), short trades contributed the greater proportion of total profits, with a higher overall profit factor and average trade size.

EC

Annual PL

PL

Conclusion: Using Index Data, Or Other Correlated Signals, Often Improves Performance

It is well worthwhile investigating how non-tradable index data can be used in a trading strategy, either as a qualifying signal or, more directly, within the logic of the algorithm itself.  The greater challenge of building such systems means that there are opportunities to be found, even in well-mined areas like index futures markets.  A parallel idea that likewise offers plentiful opportunity is in designing systems that make use of data on multiple time frames, and in correlated markets, for instance in the energy sector.Here one can identify situations in which, under certain conditions, one market has a tendency to lead another, a phenomenon referred to as Granger Causality.


Outperforming Winton Capital

Winton Capital Management is a renowned quant fund and one of the world’s largest, most successful CTAs. The firm’s flagship investment strategy, the Winton Diversified Program, follows a systematic investment process that is based on statistical research to invest globally long and short, using leverage, in a diversified range of liquid instruments, including exchange traded futures, forwards, currency forwards traded over the counter, equity securities and derivatives linked to such securities.

The performance of the program over the last 19 years has been impressive, especially considering its size, which now tops around $13Bn in assets.

Winton1 Winton2

Source: CTA Performance

A Meta-Strategy to Beat Winton Capital

With that background, the idea of improving the exceptional results achieved by David Harding and his army of quants seems rather far fetched, but I will take a shot.  In what follows, I am assuming that we are permitted to invest and redeem an investment in the program at no additional cost, other than the stipulated fees.  This is, of course, something of a stretch, but we will make that assumption based on the further stipulation that we will make no more than two such trades per year.

SSALGOTRADING AD

The procedure we will follow has been described in various earlier posts – in particular see this post, in which I discuss the process of developing a Meta-Strategy:  Improving A Hedge Fund Investment – Cantab Capital’s Quantitative Aristarchus Fund

Using the performance data of the WDP from 1997-2012, we develop a meta-strategy that seeks to time an investment in the program, taking profits after reaching a specified profit target, which is based on the TrueRange, or after holding for a maximum of 8 months.  The key part of the strategy code is as follows:

If MarketPosition = 1 then begin
TargPrL = EntryPrice + TargFr * TrueRange;
Sell(“ExTarg-L”) next bar at TargPrL limit;

If Time >= TimeEx or BarsSinceEntry >= NBarEx1 or (BarsSinceEntry >= NBarEx3 and C > EntryPrice)
or (BarsSinceEntry >= NBarEx2 and C < EntryPrice) then
Sell(“ExMark-L”) next bar at market;
end;

It appears that by timing an investment in the program we can improve the CAGR by around 0.86% per year, and with annual volatility that is lower by around 4.4% annually.  As a consequence, the Sharpe ratio of the meta-strategy is considerably higher:  1.14 vs 0.78 for the WDP.

Winton3

Winton4

Like most trend-following CTA strategies, Winton’s WDP has positive skewness, an attractive feature that means that the strategy has a preponderance of returns in the positive right tail of the distribution.  Also in common with most CTA strategies, on the other hand, the WDP suffers from periodic large drawdowns, in this case amounting to -25.73%.

The meta-strategy improves on the baseline profile of the WDP, increasing the positive skew, while substantially reducing downside risk, leading to a much lower maximum drawdown of -16.94%.

Conclusion

Despite its stellar reputation in the CTA world, investors could theoretically improve on the performance of Winton Capital’s flagship program by using a simple meta-strategy that times entry to and exit from the program using simple technical indicators.  The meta-strategy produces higher returns, lower volatility and with higher positive skewness and lower downside risk.

Improving A Hedge Fund Investment – Cantab Capital’s Quantitative Aristarchus Fund

cantab

In this post I am going to take a look at what an investor can do to improve a hedge fund investment through the use of dynamic capital allocation. For the purposes of illustration I am going to use Cantab Capital’s Aristarchus program – a quantitative fund which has grown to over $3.5Bn in assets under management since its opening with $30M in 2007 by co-founders Dr. Ewan Kirk and Erich Schlaikjer.

I chose this product because, firstly, it is one of the most successful quantitative funds in existence and, secondly, because as a CTA its performance record is publicly available.

Cantab’s Aristarchus Fund

Cantab’s stated investment philosophy is that algorithmic trading can help to overcome cognitive biases inherent in human-based trading decisions, by exploiting persistent statistical relationships between markets. Taking a multi-asset, multi-model approach, the majority of Cantab’s traded instruments are liquid futures and forwards, across currencies, fixed income, equity indices and commodities.

Let’s take a look at how that has worked out in practice:

Fig 1 Fig 2

Whatever the fund’s attractions may be, we can at least agree that alpha is not amongst them.  A Sharpe ratio of < 0.5 (I calculate to be nearer 0.41) is hardly in Renaissance territory, so one imagines that the chief benefit of the product must lie in its liquidity and low market correlation.  Uncorrelated it may be, but an investor in the fund must have extremely deep pockets – and a very strong stomach – to handle the 34% drawdown that the fund suffered in 2013.

Improving the Aristarchus Fund Performance

If we make the assumption that an investment in this product is warranted in the first place, what can be done to improve its performance characteristics?  We’ll look at that question from two different perspectives – the investor’s and the manager’s.

Firstly, from the investor’s perspective, there are relatively few options available to enhance the fund’s contribution, other than through diversification.  One other possibility available to the investor, however, is to develop a program for dynamic capital allocation.  This requires the manager to be open to allowing significant changes in the amount of capital to be allocated from month to month, or quarter to quarter, but in a liquid product like Aristarchus some measure of flexibility ought to be feasible.

SSALGOTRADING AD

An analysis of the fund’s performance indicates the presence of a strong dependency in the returns process.  This is not at all unusual.  Often investment strategies have a tendency to mean-revert: a negative dependency in which periods of poor performance tend to be followed by positive performance, and vice versa.  CTA strategies such as Aristarchus tend to be trend-following, and this can induce positive dependency in the strategy returns process, in which positive months tend to follow earlier positive months, while losing months tend to be followed by further losses.  This is the pattern we find here.

Consequently, rather than maintaining a constant capital allocation, an investor would do better to allocate capital dynamically, increasing the amount of capital after a positive period, while decreasing the allocation after a period of losses.  Let’s consider a variation of this allocation plan, in which the amount of allocated capital is increased by 70% when the last monthly equity value exceeds the quarterly moving average, while the allocation is reduced to zero when the last month’s equity falls below the average.  A dynamic capital allocation plan as simple as this appears to produce a significant improvement in the overall performance of the investment:

Fig 4

The slight increase in annual volatility in the returns produced by the dynamic capital allocation model is more than offset by the 412bp improvement in the CAGR. Consequently, the Sharpe Ratio improves from o.41 to 0.60.

Nor is this by any means the entire story: the dynamic model produces lower average drawdowns (7.93% vs. 8.52%) and, more importantly, reduces the maximum drawdown over the life of the fund from a painful 34.87% to more palatable 23.92%.

The much-improved risk profile of the dynamic allocation scheme is reflected in the Return/Drawdown Ratio, which rises from 2.44 to 6.52.

Note, too, that the average level of capital allocated in the dynamic scheme is very slightly less than the original static allocation.  In other words, the dynamic allocation technique results in a more efficient use of capital, while at the same time producing a higher rate of risk-adjusted return and enhancing the overall risk characteristics of the strategy.

Improving Fund Performance Using a Meta-Strategy

So much for the investor.  What could the manager to do improve the strategy performance?  Of course, there is nothing in principle to prevent the manager from also adopting a dynamic approach to capital allocation, although his investment mandate may require him to be fully invested at all times.

Assuming for the moment that this approach is not available to the manager, he can instead look into the possibilities for developing a meta-strategy.    As I explained in my earlier post on the topic:

A meta-strategy is a trading system that trades trading systems.  The idea is to develop a strategy that will make sensible decisions about when to trade a specific system, in a way that yields superior performance compared to simply following the underlying trading system.

It turns out to be quite straightforward to develop such a meta-strategy, using a combination of stop-loss limits and profit targets to decide when to turn the strategy on or off.  In so doing, the manager is able to avoid some periods of negative performance, producing a significant uplift in the overall risk-adjusted return:

Fig 5

Conclusion

Meta-strategies and dynamic capital allocation schemes can enable the investor and the investment manager to improve the performance characteristics of their investment and investment strategy, by increasing returns, reducing volatility and the propensity of the strategy to produce substantial drawdowns.

We have demonstrated how these approaches can be applied successfully to Cantab’s Aristarchus quantitative fund, producing substantial gains in risk adjusted performance and reductions in the average and maximum drawdowns produced over the life of the fund.