The Misunderstood Art of Market Timing:

How to Beat Buy-and-Hold with Less Risk

Market timing has a very bad press and for good reason: the inherent randomness of markets makes reliable forecasting virtually impossible.  So why even bother to write about it?  The answer is, because market timing has been mischaracterized and misunderstood.  It isn’t about forecasting.  If fact, with notable exceptions, most of trading isn’t about forecasting.  It’s about conditional expectations.

Conditional expectations refer to the expected value of a random variable (such as future stock returns) given certain known information or conditions.

In the context of trading and market timing, it means that rather than attempting to forecast absolute price levels, we base our expectations for future returns on current observable market conditions.

For example, let’s say historical data shows that when the market has declined a certain percentage from its recent highs (condition), forward returns over the next several days tend to be positive on average (expectation). A trading strategy could use this information to buy the dip when that condition is met, not because it is predicting that the market will rally, but because history suggests a favorable risk/reward ratio for that trade under those specific circumstances.

The key insight is that by focusing on conditional expectations, we don’t need to make absolute predictions about where the market is heading. We simply assess whether the present conditions have historically been associated with positive expected returns, and use that probabilistic edge to inform our trading decisions.

This is a more nuanced and realistic approach than binary forecasting, as it acknowledges the inherent uncertainty of markets while still allowing us to make intelligent, data-driven decisions. By aligning our trades with conditional expectations, we can put the odds in our favor without needing a crystal ball.

So, when a market timing algorithm suggests buying the market, it isn’t making a forecast about what the market is going to do next.  Rather, what it is saying is, if the market behaves like this then, on past experience, the following trade is likely to be profitable.  That is a very different thing from forecasting the market.

A good example of a simple market-timing algorithm is “buying the dips”.  It’s so simple that you don’t need a computer algorithm to do it.  But a computer algorithm helps by determining what comprises a dip and the level at which profits should be taken.

One of my favorites market timing strategies is the following algorithm, which I originally developed to trade the SPY ETF.  The equity curve from inception of the ETF in 1993 looks like this:

The algorithm combines a few simple technical indicators to determine what constitutes a dip and the level at which profits should be taken.  The entry and exit orders are also very straightforward, buying and selling at the market open, which can be achieved by participating in the opening auction.  This is very convenient:  a signal is generated after the close on day 1 and is then executed as a MOA (market opening auction) order in the opening auction on day 2.  The opening auction is by no means the most liquid period of the trading session, but in an ETF like SPY the volumes are such that the market impact is likely to be negligible for the great majority of investors.  This is not something you would attempt to do in an illiquid small-cap stock, however, where entries and exits are more reliably handled using a VWAP algorithm; but for any liquid ETF or large-cap stock the opening auction will typically be fine.

Another aspect that gives me confidence in the algorithm is that it generalizes well to other assets and even other markets.  Here, for example, is the equity curve for the exact same algorithm implemented in the XLG ETF in the period from 2010:

And here is the equity curve for the same strategy (with the same parameters) in AAPL, over the same period:

Remarkably, the strategy also works in E-mini futures too, which is highly unusual:  typically the market dynamics of the futures market are so different from the spot market that strategies don’t transfer well.  But in this case, it simply works:

The reason the strategy is effective is due to the upward drift in equities and related derivatives.  If you tried to apply a similar strategy to energy or currency markets, it would fail. The strategy’s “secret sauce” is the combination of indicators it uses to determine the short-term low in the ETF that constitutes a good buying opportunity, and then figure out the right level at which to sell.

Does the algorithm always work?  If by that you mean “is every trade profitable?” the answer is no.  Around 61% of trades are profitable, so there are many instances where trades are closed at a loss.  But the net impact of using the market-timing algorithm is very positive, when compared to the buy-and-hold benchmark, as we shall see shortly. 

Because the underlying thesis is so simple (i.e. equity markets have positive drift), we can say something about the long-term prospects for the strategy.  Equity markets haven’t changed their fundamental tendency to appreciate over the 31-year period from inception of the SPY ETF in 1993, which is why the strategy has performed well throughout that time.  Could one envisage market conditions in which the strategy will perform poorly?  Yes – any prolonged period of flat to downward trending prices in equities will result in poor performance.  But we haven’t seen those conditions since the early 1970’s and, arguably, they are unlikely to return, since the fundamental change brought about by abandonment of the gold standard in 1973. 

The abandonment of the gold standard and the subsequent shift to fiat currencies has given central banks, particularly the U.S. Federal Reserve, unprecedented power to expand the money supply and support asset prices during times of crisis. This ‘Fed Put’ has been a major factor underpinning the multi-decade bull market in stocks.

In addition, the increasing dominance of the U.S. as the world’s primary economic and military superpower since the end of the Cold War has made U.S. financial assets a uniquely attractive destination for global capital, creating sustained demand for U.S. equities.

Technological innovation, particularly with respect to the internet and advances in computing, has also unleashed a wave of productivity and wealth creation that has disproportionately benefited the corporate sector and equity holders. This trend shows no signs of abating and may even be accelerating with the advent of artificial intelligence.

While risks certainly remain and occasional cyclical bear markets are inevitable, the combination of accommodative monetary policy, the U.S.’s global hegemony, and technological progress create a powerful set of economic forces that are likely to continue propelling equity prices higher over the long-term, albeit with significant volatility along the way.Strategy Performance in Bear Markets

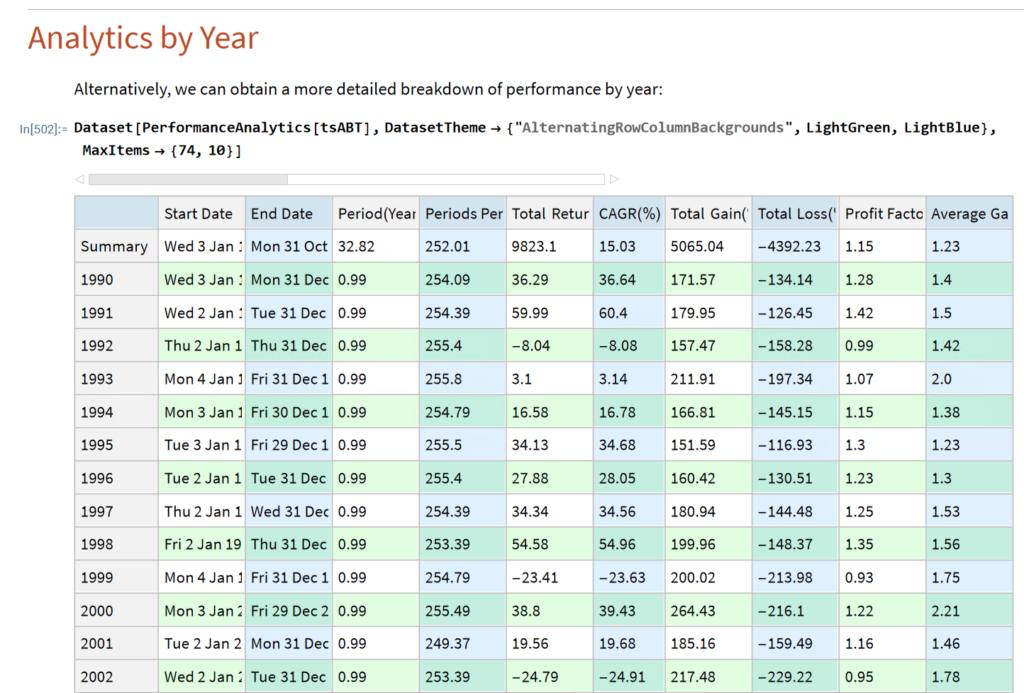
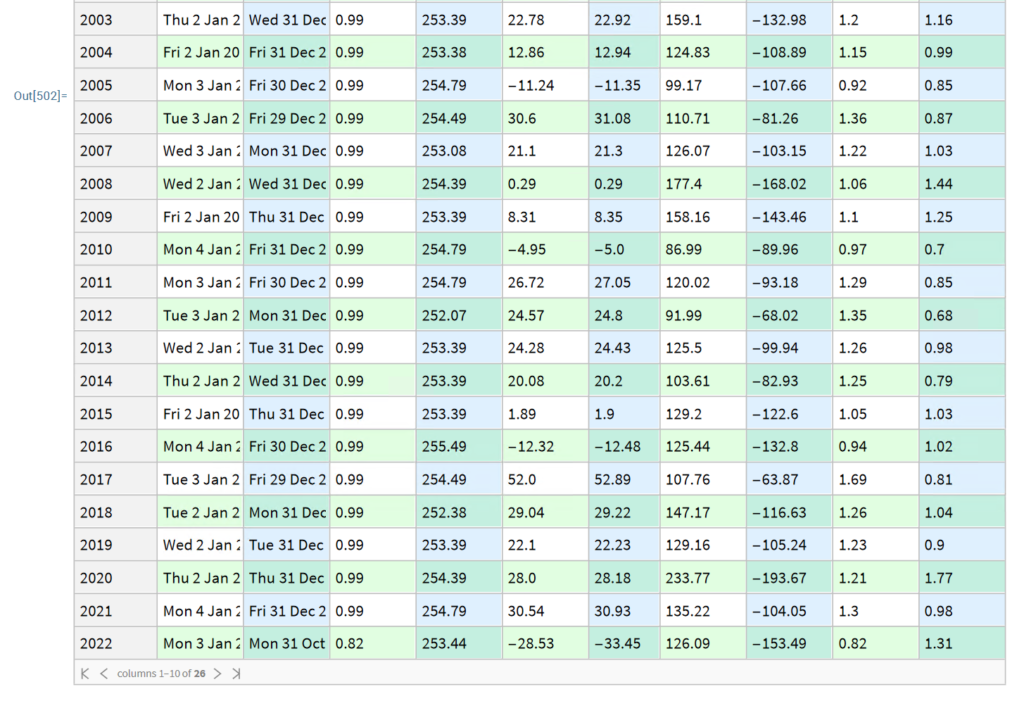
Note that the conditions I am referring to are something unlike anything we have seen in the last 50 years, not just a (serious) market pullback.  If we look at the returns in the period from 2000-2002, for example, we see that the strategy held up very well, out-performing the benchmark by 54% over the three-year period of the market crash.  Likewise, in 2008 credit crisis, the strategy was able to eke out a small gain, beating the benchmark by over 38%.  In fact, the strategy is positive in all but one of the 31 years from inception.

Let’s take a look at the compound returns from the strategy vs. the buy-and-hold benchmark:

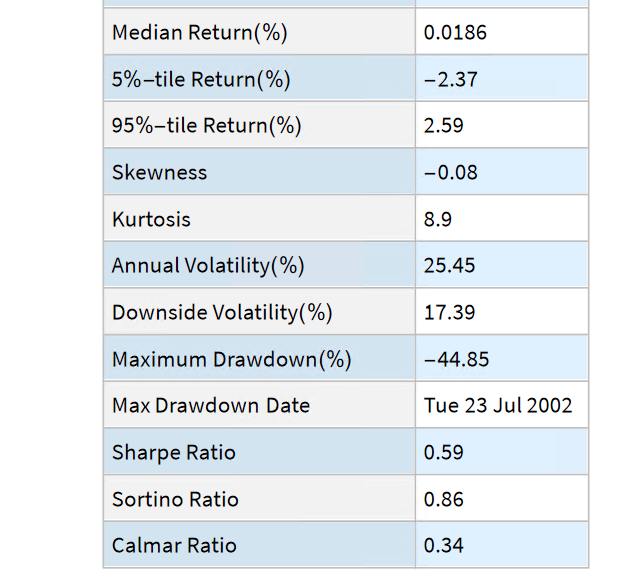
At first sight, it appears that the benchmark significantly out-performs the strategy, albeit suffering from much larger drawdowns.  But that doesn’t give an accurate picture of relative performance.  To see why, let’s look at the overall performance characteristics:

Now we see that, while the strategy CAGR is 3.50% below the buy-and-hold return, its annual volatility is less than half that of the benchmark, giving the strategy a superior Sharpe Ratio. 

To make a valid comparison between the strategy and its benchmark we therefore need to equalize the annual volatility of both, and we can achieve this by leveraging the strategy by a factor of approximately 2.32.  When we do that, we obtain the following results:

Now that the strategy and benchmark volatilities have been approximately equalized through leverage, we see that the strategy substantially outperforms buy-and-hold by around 355 basis points per year and with far smaller drawdowns.

In general, we see that the strategy outperformed the benchmark in fewer than 50% of annual periods since 1993. However, the size of the outperformance in years when it beat the benchmark was frequently very substantial:

Market timing can work.  To understand why, we need to stop thinking in terms of forecasting and think instead about conditional returns.  When we do that, we arrive at the insight that market timing works because it relies on the positive drift in equity markets, which has been one of the central features of that market over the last 50 years and is likely to remain so in the foreseeable future. We have confidence in that prediction, because we understand the economic factors that have continued to drive the upward drift in equities over the last half-century.

After that, it is simply a question of the mechanics – how to time the entries and exits.  This article describes just one approach amongst a great number of possibilities.

One of the many benefits of market timing is that it has a tendency to side-step the worst market conditions and can produce positive returns even in the most hostile environments: periods such as 2000-2002 and 2008, for example, as we have seen.

Finally, don’t forget that, as we are sitting out of the market approximately 40% of the time our overall risk is much lower – less than half that of the benchmark.  So, we can afford to leverage our positions without taking on more overall risk than when we buy and hold.  This clearly demonstrates the ability of the strategy to produce higher rates of risk-adjusted return.

A Two-Factor Model for Capturing Momentum and Mean Reversion in Stock Returns


Financial modeling has long sought to develop frameworks that accurately capture the complex dynamics of asset prices. Traditional models often focus on either momentum or mean reversion effects, struggling to incorporate both simultaneously. In this blog post, we introduce a two-factor model that aims to address this issue by integrating both momentum and mean reversion effects within the stochastic processes governing stock prices.

The development of the two-factor model is motivated by the empirical observation that financial markets exhibit periods of persistent trends (momentum) and reversion to historical means or intrinsic values (mean reversion). Capturing both effects within a single framework has been a challenge in financial econometrics. The proposed model seeks to tackle this challenge by incorporating momentum and mean reversion effects within a unified framework.

The two-factor model consists of two main components: a drift factor and a mean-reverting factor. The drift factor, denoted as d μ(t), represents the long-term trend or momentum of a stock’s price. It incorporates a constant drift parameter θ, reflecting the underlying direction driven by broader market forces or fundamental changes. The mean-reverting factor, denoted as d θt, captures the short-term deviations from the drift. It is characterized by a mean-reversion speed κ, which determines the rate at which prices revert to their long-term equilibrium following temporary fluctuations. These factors are influenced by their respective volatilities (σμ, σθ) and driven by correlated Wiener processes, allowing the model to reflect the interaction between momentum and mean reversion observed in markets

To demonstrate the model’s application, the research applies the two-factor framework to daily returns data of Coca-Cola (KO) and PepsiCo (PEP) over a twenty-year period. This empirical analysis explores the model’s potential for informing pairs trading strategies. The parameter estimation process employs a maximum likelihood estimation (MLE) technique, adapted to handle the specifics of fitting a two-factor model to real-world data. This approach aims to ensure accuracy and adaptability, enabling the model to capture the evolving dynamics of the market.

The introduction of the two-factor model contributes to the field of quantitative finance by providing a framework that incorporates both momentum and mean reversion effects. This approach can lead to a more comprehensive understanding of asset price dynamics, potentially benefiting risk management, asset allocation, and the development of trading strategies. The model’s insights may be particularly relevant for pairs trading, where identifying relative mispricings between related assets is important.

The two-factor model presented in this blog post offers a new approach to financial modeling by integrating momentum and mean reversion effects. The model’s empirical application to Coca-Cola and PepsiCo demonstrates its potential for informing trading strategies. As quantitative finance continues to evolve, the two-factor model may prove to be a useful tool for researchers, practitioners, and investors seeking to understand the dynamics of financial markets.

Two-Factor-Model-of-Stock-Returns-ver_1_1

Seasonality in Equity Returns

To amplify Valérie Noël‘s post a little, we can use the Equities Entity Store (https://lnkd.in/epg-5wwM) to extract returns for the S&P500 index for (almost) the last century and compute the average return by month, as follows.

July is shown to be (by far) the most positive month for the index, with an average return of +1.67%, in stark contrast to the month of Sept. in which the index has experienced an average negative return of -1.15%.

Continuing the analysis a little further, we can again use the the Equities Entity Store (https://lnkd.in/epg-5wwM) to extract estimated average volatility for the S&P500 by calendar month since 1927:

As you can see, July is not only the month with highest average monthly return, but also has amongst the lowest levels of volatility, on average.

Consequently, risk-adjusted average rates of return in July far exceed other months of the year.

Conclusion: bears certainly have a case that the market is over-stretched here, but I would urge caution: hold off until end Q3 before shorting this market in significant size.

For those market analysts who prefer a little more analytical meat, we can compare the median returns for the #S&P500 Index for the months of July and September using the nonparametric MannWhitney test.

This indicates that there is only a 0.13% probability that the series of returns for the two months are generated from distributions with the same median.

Conclusion: Index performance in July really is much better than in September.

For more analysis along these lines, see my recent book, Equity Analytics:

Why Technical Analysis Doesn’t Work

Single Stock Analytics

Generally speaking, one of the major attractions of working in the equities space is that the large number of available securities opens up a much wider range of opportunities for the quantitative researcher than for, say, futures markets.  The focus in equities tends to be on portfolio strategies since the scope of the universe permits an unparalleled degree of diversification.  Single stock strategies forego such benefit, but they are of interest to the analyst and investor nonetheless: “stock picking” is almost a national pastime, at least for US investors.

Rather than seeking to mitigate stock specific risk through diversification,  the stock picker is actively seeking to identify  risk opportunities that are unique  to a specific stock, and he hopes will yield abnormal returns.  These can arise for any number of reasons – mergers and acquisitions, new product development, change in index membership, to name just a few.  The hope is that such opportunities may be uncovered by one of several possible means:

  • Identification of latent, intrinsic value in neglected stocks that has been overlooked by other analysts
  • The use of alternative types of data that permits new insight in the potential of a specific stock or group of stocks
  • A novel method of analysis that reveals hitherto hidden potential in a particular stock or group of stocks

One can think of examples of each of these possibilities, but at the same time it has to be admitted that the challenge is very considerable.  Firstly, your discovery or methodology would have to be one that has eluded some of the brightest minds in the investment industry.  That has happened in the past and will no doubt occur again in future;  but the analyst has to have a fairly high regard for his own intellect – or good fortune – to believe that the golden apple will fall into his lap, rather than another’s. Secondly there is the question of the efficient market hypothesis.  These days it is fashionable to pour scorn  on the EMH, with examples of well-known anomalies often used to justify the opprobrium. But the EMH doesn’t say that markets are 100% efficient, 100% of the time.  It says that markets are efficient, on average.  This  means that there will be times or circumstances in which the market will be efficient and other times and circumstances when it will be relatively inefficient – but you won’t be able to discern which condition the market is in currently.  Finally, even if one is successful in identifying such an opportunity, the benefit has to be realizable and economically significant.  I can think of several examples of equity strategies that appear to offer the potential to generate  alpha, but which turn out to be either unrealizable or economically insignificant after applying transaction costs.

All this is to say that stock picking is one of the most difficult challenges the analyst can undertake.  It is also one of the most interesting challenges – and best paid occupations – on Wall Street.  So it is unsurprising that for analysts it remains the focus of their research and ambition.  In this chapter we will look at some of the ways in which the Equities Entity Store can be used for such purposes and some of the more interesting analytical methods.

Why Technical Analysis Doesn’t Work

Technical Analysis is a very popular approach to analysing stocks.  Unfortunately, it is also largely useless, at least if the intention is to uncover potential sources of alpha.  The reason is not hard to understand: it relies on applying  analytical methods that have been known for decades to widely available public information (price data).  There  isn’t any source of competitive advantage that might reliably produce abnormal returns.  Even the possibility  of uncovering a gem amongst the stocks overlooked by other analysts appears increasingly remote these days, as the advent of computerized trading systems has facilitated the application of standard technical analysis tools on an industrial scale.  You don’t even need to understand how the indicators work – much less how to program them – in order to apply them to tens of thousands of stocks.  

And yet Technical Analysis remains very popular.  Why so?  The answer, I believe, is because it’s easy to do and can often look very pretty.  I will go further and admit that some of the indicators that analysts have devised are extraordinarily creative.  But they just don’t work.  In fact, I can’t think of another field of human industry that engages so many inventive minds in such a fruitless endeavor.  

All this has been clear for some time and yet every year legions of newly minted analysts fling themselves into the task of learning how to apply Technical Analysis to everything from cattle futures to cryptocurrencies.  Realistically, the chances of my making any kind of impression on this torrent of pointless hyperactivity are close to zero, but I will give it a go.

A Demonstration

Let’ s begin by picking a stock at random, one I haven’ t look at previously :

waterUtilities=Select[allListedStocks,#["Sector Information"]["GICS Industry"]== "Water Utilities"&]

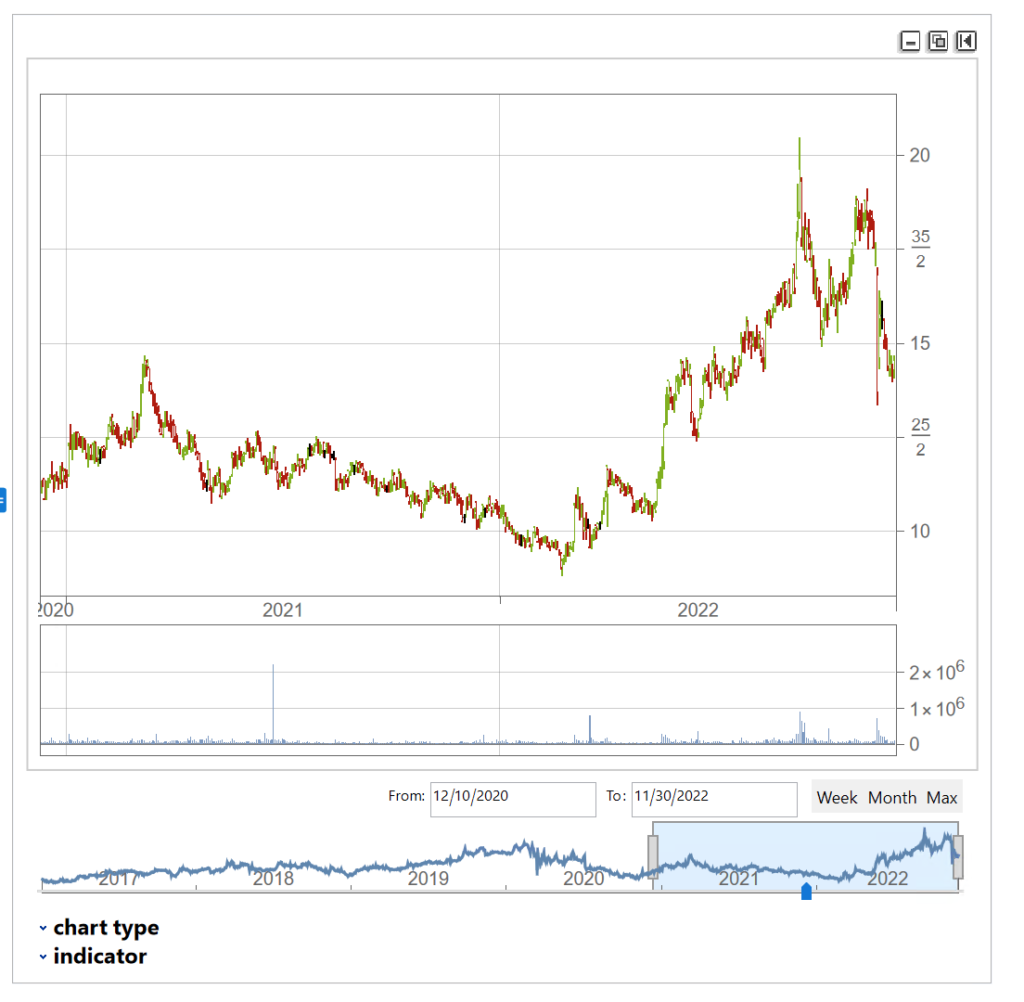
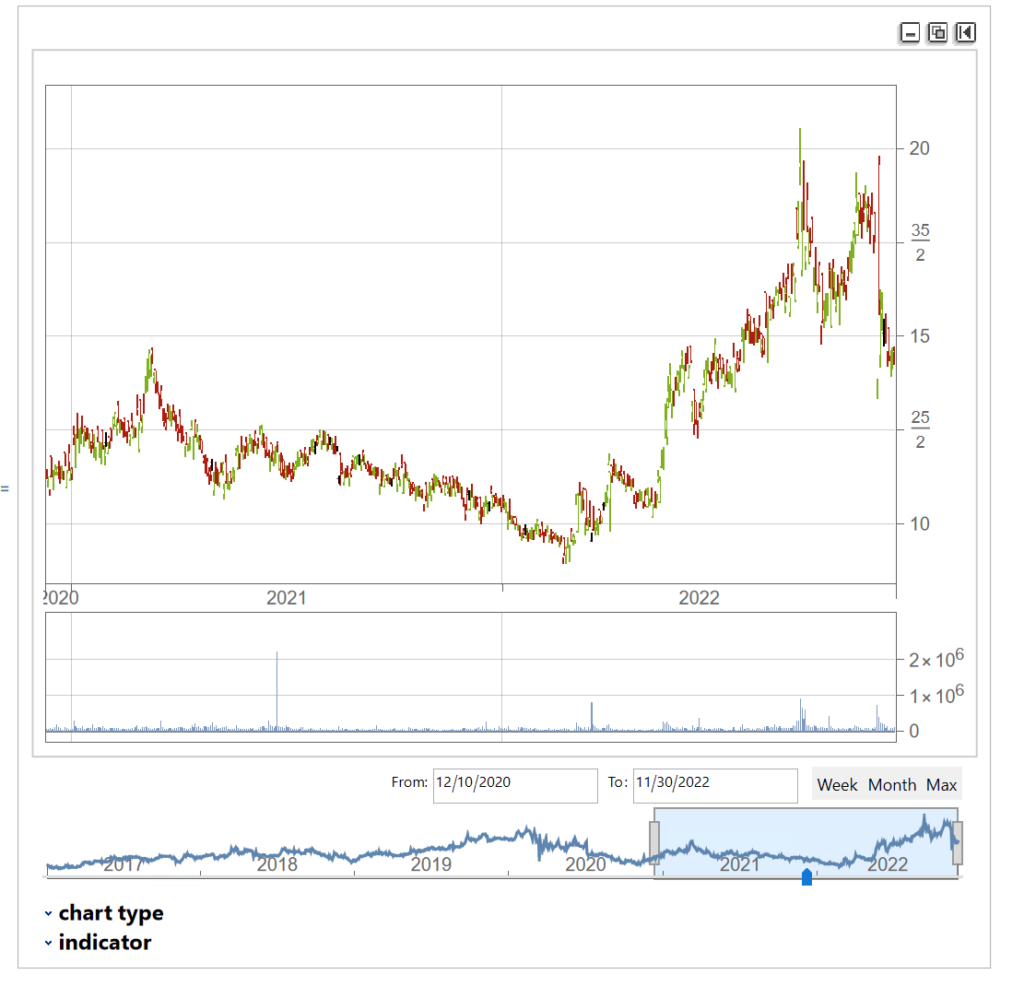
We’ll extract a daily price series from 2017 to 2022 and plot an interactive trading chart, to which we can add moving averages, or any number of other technical indicators, as we wish:

The chart shows several different types of pattern that are well-known to technical analysis, including trends, continuation patterns, gaps, double tops, etc

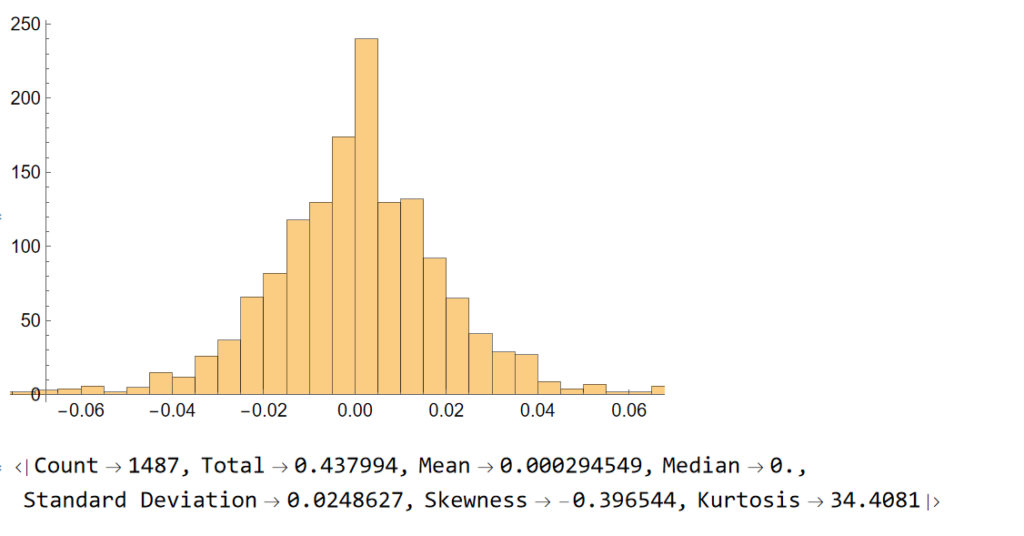
Let’ s look at the pattern of daily returns:

returns=Differences@Log[tsCWCO["PathComponent",4]["Values"]];
Histogram[returns]
stats=ReturnStatistics[returns]

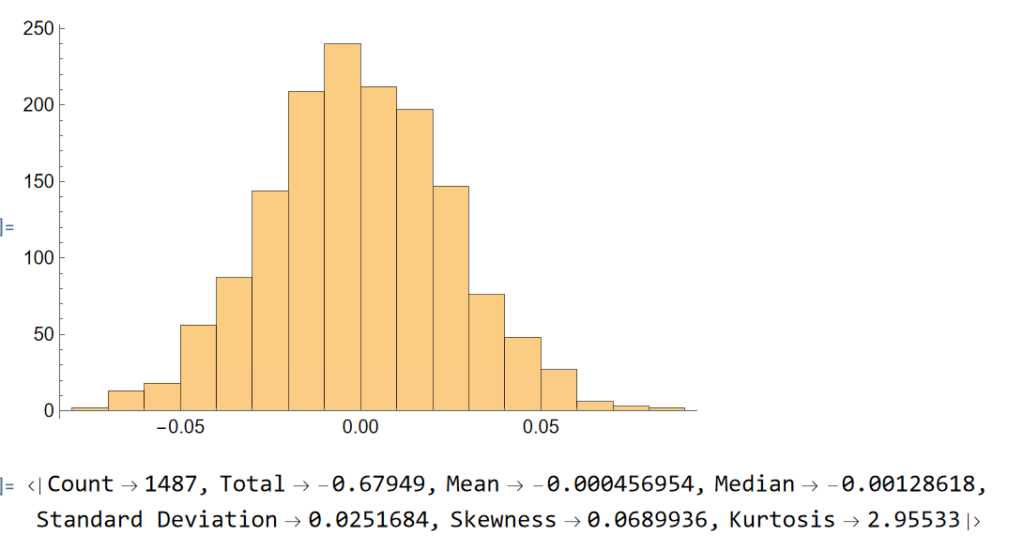
Next, we will generate a series of random returns, drawn from a Gaussian distribution with the same mean and standard deviation as the empirical returns series:

randomreturns=RandomVariate[NormalDistribution[stats["Mean"],stats["Standard Deviation"]],Length[returns]];
Histogram[randomreturns]
ReturnStatistics[randomreturns]

Clearly, the distribution of the generated returns differs from the distribution of empirical returns, but that doesn’t matter:  all that counts is that we can agree that the generated returns, which represent the changes in (log) prices from one day to the next, are completely random. Consequently, knowing the random returns, or prices,  at time t  = 1, 2, . . . , (t-1) in no way enables you to forecast the return , or price, at time t.

Now let’ s generate a series of synthetic prices  and time series, using the synthetic returns to calculate the prices for each period:

syntheticPrices=Exp[FoldList[Plus,Log[First[tsCWCO["FirstValues"]][[1;;4]]],Transpose[ConstantArray[returns,4]]]];

tsSynthetic=TimeSeries[ArrayFlatten@{{syntheticPrices,List/@tsCWCO["PathComponent",5]["Values"]}},{tsCWCO["Dates"]}]

InteractiveTradingChart[tsSynthetic]

The synthetic time series is very similar to the original and displays many of the same characteristics, including classical patterns that are immediately comprehensible to a technical analyst, such as gaps, reversals , double tops, etc.

But the two time series, although similar,  are not identical:

tsCWCO===tsSynthetic

False

We knew this already, of course, because we used randomly generated returns to create the synthetic price series.  What this means is that, unlike for the real price series, in the case of the synthetic price series we know for certain that the movement in prices from one period to the next is entirely random.  So if prices continue in an upward trend after a gap, or decline after a double top formation appears on the chart of the synthetic series, that happens entirely by random chance, not in response to a pattern flagged by the technical indicator.  If we had generated a different set of random returns, we could just as easily have produced a synthetic price series in which prices reversed after a gap up, or continued higher after a double-top formation.  Critics of Technical Analysis do not claim that patterns such as gaps, head and shoulders , etc., do not exist – they clearly do.  Rather, we say that such patterns are naturally occurring phenomena that will arise even in a series known to be completely random and hence can have no economic significance.

The point is not to say that technical signals never work: sometimes they do and sometimes they don’t.  Rather, the point is that, in any given situation, you will be unable to tell whether the signal is going to work this time, or not – because price changes are  dominated by random variation.  

You can make money in the markets using technical analysis, just as you can by picking stocks at random, throwing darts at a dartboard, or tossing a coin to decide which to buy or sell – i.e. by dumb luck.  But you can’t reliably make money this way.

  • More on the efficient market hypothesis
  • More from the Society of Technical Analysts

Survivorship Bias

From my forthcoming book Equity Analytics:

Detecting Survivorship Bias

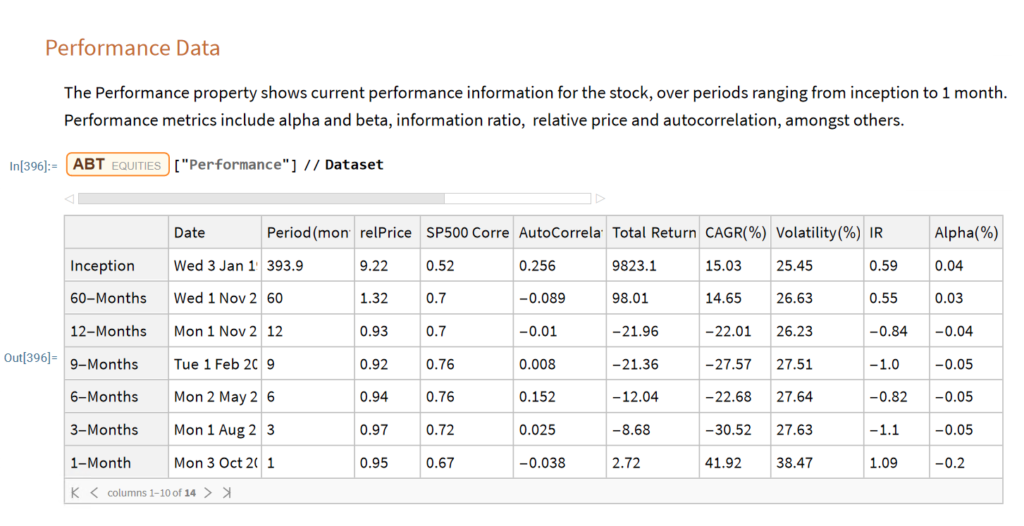
The relprice Index in the Performance Data table shows the price of the stock relative to the S&P 500 index over a specified period.

Let’s look at the median relPrice for all stocks that are currently members of the S&P500 index, eliminating any for which the relevant Performance Data is missing:

currentSP500 = Select [ allStocks , # [ Symbol Information ] [ SP500 ] && Length [ # [ Performance ] [ [ All , relPrice Index ] ] ] == 7 & ] // Quiet ;

Sort@RandomSample[currentSP500, 10]

We can then obtain the median relprice for this universe of stocks:

# [ Performance ] [ [ All , relPrice Index ] ] & /@ currentSP500 // Median

We would expect that roughly half of the S&P 500 index membership would outperform the index over any given period and consequently that the median relPrice would be close to 1. Indeed this is the case for periods of up to 60 months. But if we look at the period from inception, the median relPrice is 3.46 x this level, indicating a very significant out-performance by the current S&P membership relative to the index.

How does this arise? The composition of the index changes over time and many stocks that were once index members have been removed from the index for various reasons. In a small number of cases this will occur where a stock is acquired after a period of exceptional performance. More typically, a stock will be removed from the index after a period of poor performance, following which the firm’s capital structure no longer meets the criteria for inclusion in the index, or because the stock is delisted after acquisition or bankruptcy of the company. None of these stocks is included in the index currently, but instead have been replaced by the stocks of more successful companies – firms that have “survived”. Consequently, when looking the current membership of the index we are considering only these “survivors” and neglecting those stocks that were once index members but which have since been removed. As a result, the aggregate performance of the current members, the survivors, far exceeds the historical performance of the index, which reflects the impact of those stocks removed from membership, mostly for reasons of under-performance.

The outcome of this is that if you design equity portfolio strategies using a universe comprising only the current index membership, or indeed only stocks that are currently listed, the resulting portfolio is subject to this kind of “survivorship bias”, that will tend to inflate its performance. This probably wont make much difference over shorter periods of up to five years, but if you backtest the strategy over longer periods the results are likely to become subject to significant upward bias that will over-state the expected performance of the strategy in future. You may find evidence of this bias in the form of deteriorating strategy performance over time, for more recent periods covered in the backtest.

A secondary effect of using a survivorship-biased universe, also very important, is that it will prove difficult to identify enough short candidates to be able to design long/short or market-neutral strategies. The long term performance of even the worst performing survivors is such that shorting them will almost always detract from portfolio performance without reducing portfolio risk, due to the highly correlated performance amongst survivors. In order to design such strategies, it is essential that your universe contains stocks that are no longer listed, as many of these will have been delisted for reasons of underperformance. These are the ideal short candidates for your long/short or market-neutral strategy.

In summary, it is vital that the stock universe includes both currently listed and delisted stocks in order to mitigate the impact of survivorship bias.

Let’s take a look at the median relPrice once again, this time including both listed and delisted stocks:

allValidStocks = Select [ allStocks , Length [ # [ Performance ] [ [ All , relPrice Index ] ] ] == 7 & ] // Quiet ;

# [ Performance ] [ [ All , relPrice Index ] ] & /@ allValidStocks // Median

Equity Analytics in the Equities Data Store

Equities Entity Store  – A Brief Review

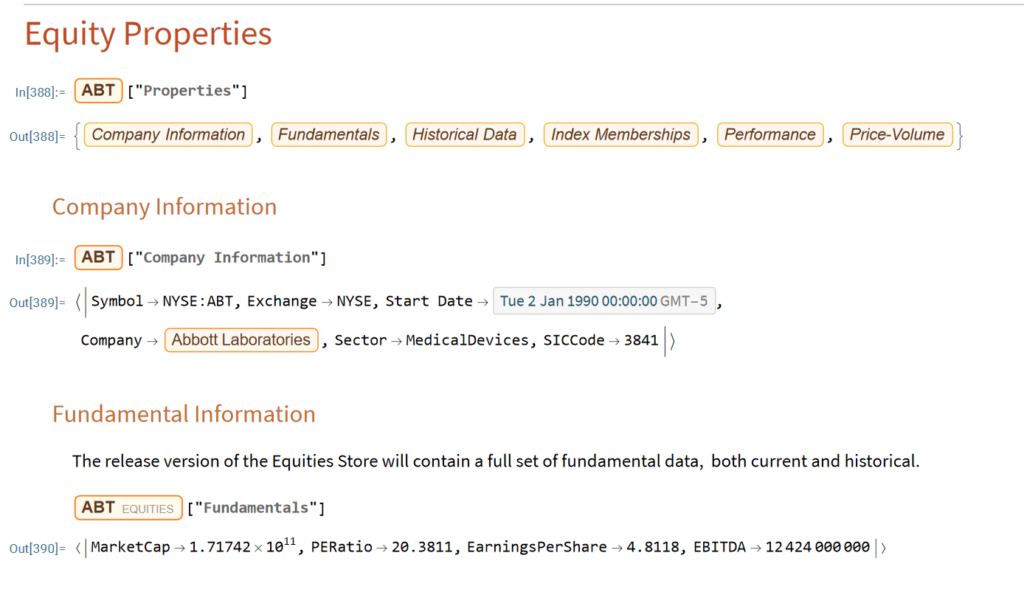
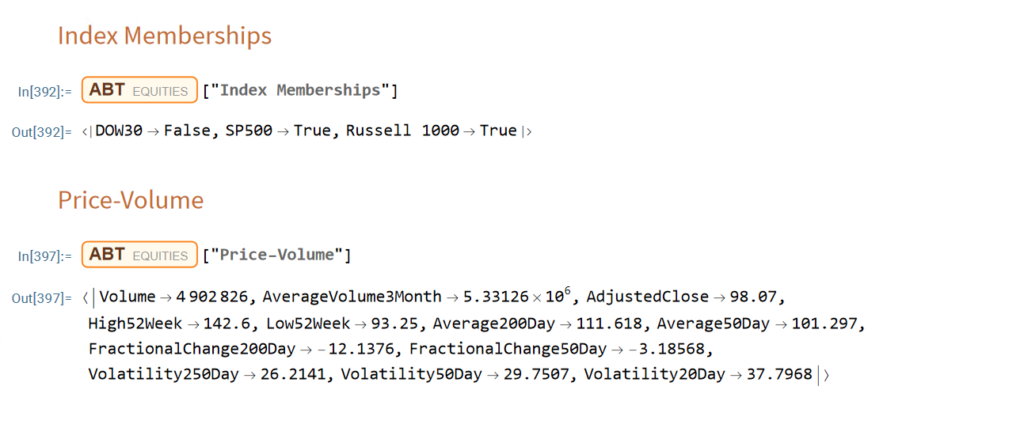
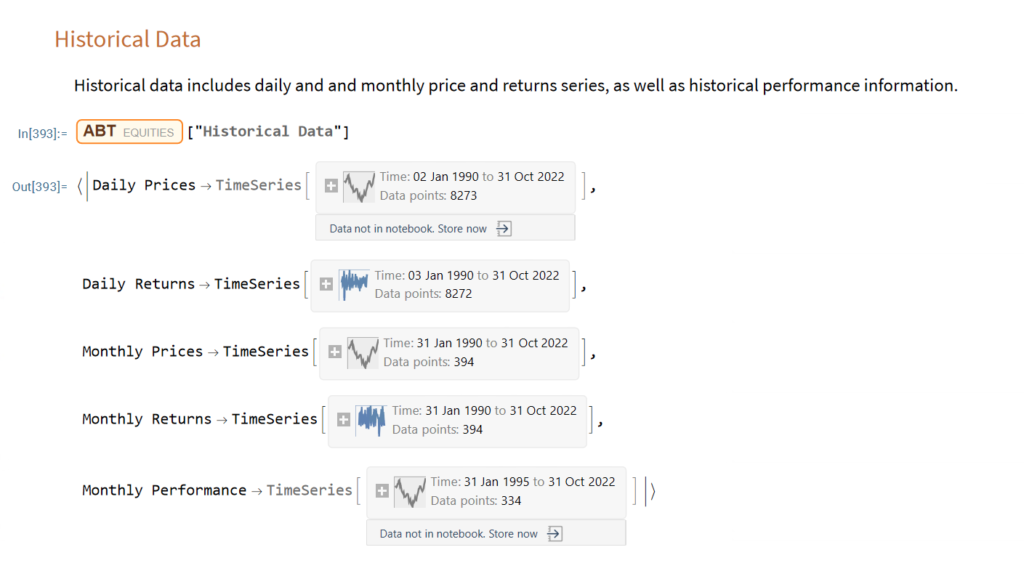
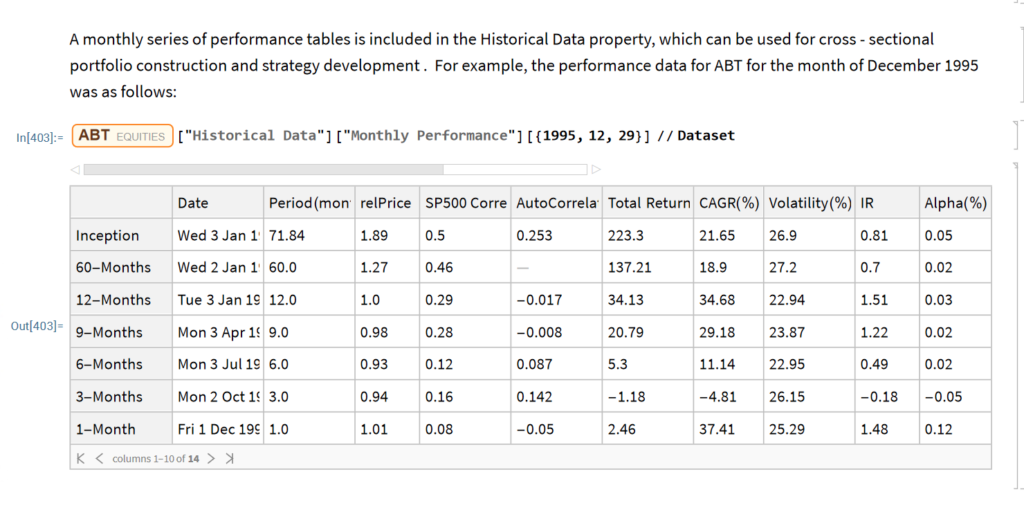
The Equities Entity Store applies the object-oriented concept of Entity Stores in the Wolfram Language to create a collection of equity objects, both stocks and stock indices, containing current and historical fundamental, technical and performance-related data. Also included in the release version of the product will be a collection of utility functions (a.k.a. “Methods”) that will facilitate equity analysis,  the formation and evaluation of equity portfolios and the development and back-testing of equities strategies, including cross-sectional strategies.

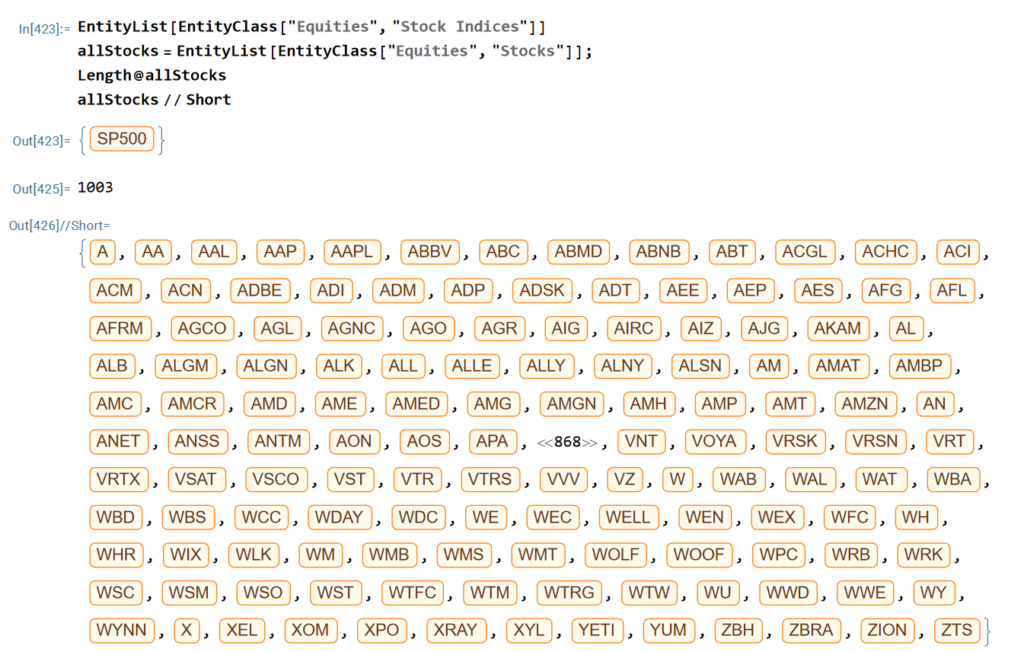
In the pre-release version of the store there are just over 1,000 equities, but this will rise to over 2,000 in the first release, as delisted securities are added to the store. This is important in order to eliminate survivor bias from the data set.

First Release of the Equities Entity Store – January 2023

The first release of the equities entity store product will contain around 2,000-2,500 equities, including at least 1,000 active stocks listed on the NYSE and NASDAQ exchanges and a further 1,000-1,500 delisted securities. All of the above information will be available for each equity and, in addition, the historical data will include quarterly fundamental data.

The other major component of the store will be analytics tools, including single-stock analytics functions such as those illustrated here. More important, however, is that the store will contain advanced analytics tools designed to assist the analyst in the construction of optimized equity portfolios and in the development and backtesting of long and long/short equity strategies.

Readers wishing to receive more information should contact me at algosciences (at) gmail.com