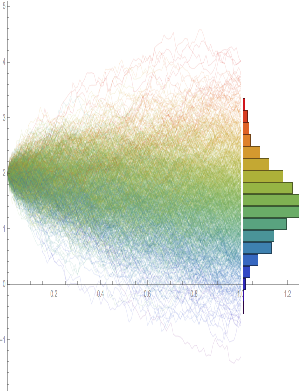
The SABR Stochastic Volatility Model

The SABR (Stochastic Alpha, Beta, Rho) model is a stochastic volatility model, which attempts to capture the volatility smile in derivatives markets. The name stands for “Stochastic Alpha, Beta, Rho”, referring to the parameters of the model. The model was developed by Patrick Hagan, Deep Kumar, Andrew Lesniewski, and Diana Woodward.

The-SABR-Stochastic-Volatility-Model

Generalized Regression

Linear regression is one of the most useful applications in the financial engineer’s tool-kit, but it suffers from a rather restrictive set of assumptions that limit its applicability in areas of research that are characterized by their focus on highly non-linear or correlated variables.  The latter problem, referred to as colinearity (or multicolinearity) arises very frequently in financial research, because asset processes are often somewhat (or even highly) correlated.  In a colinear system, one can test for the overall significant of the regression relationship, but one is unable to distinguish which of the explanatory variables is individually significant.  Furthermore, the estimates of the model parameters, the weights applied to each explanatory variable, tend to be biased.

SSALGOTRADING AD

Over time, many attempts have been made to address this issue, one well-known example being ridge regression.  More recent attempts include lasso, elastic net and what I term generalized regression, which appear to offer significant advantages vs traditional regression techniques in situations where the variables are correlated.

In this note, I examine a variety of these techniques and attempt to illustrate and compare their effectiveness.

Generalized Regression

The Mathematica notebook is also available here.

Generalized Regression

Master’s in High Frequency Finance

I have been discussing with some potential academic partners the concept for a new graduate program in High Frequency Finance.  The idea is to take the concept of the Computational Finance program developed in the 1990s and update it to meet the needs of students in the 2010s.

The program will offer a thorough grounding in the modeling concepts, trading strategies and risk management procedures currently in use by leading investment banks, proprietary trading firms and hedge funds in US and international financial markets.  Students will also learn the necessary programming and systems design skills to enable them to make an effective contribution as quantitative analysts, traders, risk managers and developers.

I would be interested in feedback and suggestions as to the proposed content of the program.

Range-Based EGARCH Option Pricing Models (REGARCH)

The research in this post and the related paper on Range Based EGARCH Option pricing Models is focused on the innovative range-based volatility models introduced in Alizadeh, Brandt, and Diebold (2002) (hereafter ABD).  We develop new option pricing models using multi-factor diffusion approximations couched within this theoretical framework and examine their properties in comparison with the traditional Black-Scholes model.

The two-factor version of the model, which I have applied successfully in various option arbitrage strategies, encapsulates the intuively appealing idea of a trending long term mean volatility process, around which oscillates a mean-reverting, transient volatility process.  The option pricing model also incorporates asymmetry/leverage effects and well as correlation effects between the asset return and volatility processes, which results in a volatility skew.

The core concept behind Range-Based Exponential GARCH model is Log-Range estimator discussed in an earlier post on volatility metrics, which contains a lengthy exposition of various volatility estimators and their properties. (Incidentally, for those of you who requested a copy of my paper on Estimating Historical Volatility, I have updated the post to include a link to the pdf).

SSALGOTRADING AD

We assume that the log stock price s follows a drift-less Brownian motion ds = sdW. The volatility of daily log returns, denoted h= s/sqrt(252), is assumed constant within each day, at ht from the beginning to the end of day t, but is allowed to change from one day to the next, from ht at the end of day t to ht+1 at the beginning of day t+1.  Under these assumptions, ABD show that the log range, defined as:

is to a very good approximation distributed as

where N[m; v] denotes a Gaussian distribution with mean m and variance v. The above equation demonstrates that the log range is a noisy linear proxy of log volatility ln ht.  By contrast, according to the results of Alizadeh, Brandt,and Diebold (2002), the log absolute return has a mean of 0.64 + ln ht and a variance of 1.11. However, the distribution of the log absolute return is far from Gaussian.  The fact that both the log range and the log absolute return are linear log volatility proxies (with the same loading of one), but that the standard deviation of the log range is about one-quarter of the standard deviation of the log absolute return, makes clear that the range is a much more informative volatility proxy. It also makes sense of the finding of Andersen and Bollerslev (1998) that the daily range has approximately the same informational content as sampling intra-daily returns every four hours.

Except for the model of Chou (2001), GARCH-type volatility models rely on squared or absolute returns (which have the same information content) to capture variation in the conditional volatility ht. Since the range is a more informative volatility proxy, it makes sense to consider range-based GARCH models, in which the range is used in place of squared or absolute returns to capture variation in the conditional volatility. This is particularly true for the EGARCH framework of Nelson (1990), which describes the dynamics of log volatility (of which the log range is a linear proxy).

ABD consider variants of the EGARCH framework introduced by Nelson (1990). In general, an EGARCH(1,1) model performs comparably to the GARCH(1,1) model of Bollerslev (1987).  However, for stock indices the in-sample evidence reported by Hentschel (1995) and the forecasting performance presented by Pagan and Schwert (1990) show a slight superiority of the EGARCH specification. One reason for this superiority is that EGARCH models can accommodate asymmetric volatility (often called the “leverage effect,” which refers to one of the explanations of asymmetric volatility), where increases in volatility are associated more often with large negative returns than with equally large positive returns.

The one-factor range-based model (REGARCH 1)  takes the form:

where the returns process Rt is conditionally Gaussian: Rt ~ N[0, ht2]

and the process innovation is defined as the standardized deviation of the log range from its expected value:

Following Engle and Lee (1999), ABD also consider multi-factor volatility models.  In particular, for a two-factor range-based EGARCH model (REGARCH2), the conditional volatility dynamics) are as follows:

and

where ln qt can be interpreted as a slowly-moving stochastic mean around which log volatility  ln ht makes large but transient deviations (with a process determined by the parameters kh, fh and dh).

The parameters q, kq, fq and dq determine the long-run mean, sensitivity of the long run mean to lagged absolute returns, and the asymmetry of absolute return sensitivity respectively.

The intuition is that when the lagged absolute return is large (small) relative to the lagged level of volatility, volatility is likely to have experienced a positive (negative) innovation. Unfortunately, as we explained above, the absolute return is a rather noisy proxy of volatility, suggesting that a substantial part of the volatility variation in GARCH-type models is driven by proxy noise as opposed to true information about volatility. In other words, the noise in the volatility proxy introduces noise in the implied volatility process. In a volatility forecasting context, this noise in the implied volatility process deteriorates the quality of the forecasts through less precise parameter estimates and, more importantly, through less precise estimates of the current level of volatility to which the forecasts are anchored.

read more

2-Factor REGARCH Model for the S&P500 Index

Robustness in Quantitative Research and Trading

What is Strategy Robustness?  What is its relevance to Quantitative Research and Trading?

One of the most highly desired properties of any financial model or investment strategy, by investors and managers alike, is robustness.  I would define robustness as the ability of the strategy to deliver a consistent  results across a wide range of market conditions.  It, of course, by no means the only desirable property – investing in Treasury bills is also a pretty robust strategy, although the returns are unlikely to set an investor’s pulse racing – but it does ensure that the investor, or manager, is unlikely to be on the receiving end of an ugly surprise when market conditions adjust.

Robustness is not the same thing as low volatility, which also tends to be a characteristic highly prized by many investors.  A strategy may operate consistently, with low volatility in certain market conditions, but behave very differently in other.  For instance, a delta-hedged short-volatility book containing exotic derivative positions.   The point is that empirical researchers do not know the true data-generating process for the markets they are modeling. When specifying an empirical model they need to make arbitrary assumptions. An example is the common assumption that assets returns follow a Gaussian distribution.  In fact, the empirical distribution of the great majority of asset process exhibit the characteristic of “fat tails”, which can result from the interplay between multiple market states with random transitions.  See this post for details:

http://jonathankinlay.com/2014/05/a-quantitative-analysis-of-stationarity-and-fat-tails/


In statistical arbitrage, for example, quantitative researchers often make use of cointegration models to build pairs trading strategies.  However the testing procedures used in current practice are not sufficient powerful to distinguish between cointegrated processes and those whose evolution just happens to correlate temporarily, resulting in the frequent breakdown in cointegrating relationships.  For instance, see this post:

http://jonathankinlay.com/2017/06/statistical-arbitrage-breaks/

Modeling Assumptions are Often Wrong – and We Know It

We are, of course, not the first to suggest that empirical models are misspecified:

“All models are wrong, but some are useful” (Box 1976, Box and Draper 1987).


Martin Feldstein (1982: 829): “In practice all econometric specifications are necessarily false models.”


Luke Keele (2008: 1): “Statistical models are always simplifications, and even the most complicated model will be a pale imitation of reality.”


Peter Kennedy (2008: 71): “It is now generally acknowledged that econometric models are false and there is no hope, or pretense, that through them truth will be found.”

During the crash of 2008 quantitative Analysts and risk managers found out the hard way that the assumptions underpinning the copula models used to price and hedge credit derivative products were highly sensitive to market conditions.  In other words, they were not robust.  See this post for more on the application of copula theory in risk management:

http://jonathankinlay.com/2017/01/copulas-risk-management/


Robustness Testing in Quantitative Research and Trading

We interpret model misspecification as model uncertainty. Robustness tests analyze model uncertainty by comparing a baseline model to plausible alternative model specifications.  Rather than trying to specify models correctly (an impossible task given causal complexity), researchers should test whether the results obtained by their baseline model, which is their best attempt of optimizing the specification of their empirical model, hold when they systematically replace the baseline model specification with plausible alternatives. This is the practice of robustness testing.

SSALGOTRADING AD

Robustness testing analyzes the uncertainty of models and tests whether estimated effects of interest are sensitive to changes in model specifications. The uncertainty about the baseline model’s estimated effect size shrinks if the robustness test model finds the same or similar point estimate with smaller standard errors, though with multiple robustness tests the uncertainty likely increases. The uncertainty about the baseline model’s estimated effect size increases of the robustness test model obtains different point estimates and/or gets larger standard errors. Either way, robustness tests can increase the validity of inferences.

Robustness testing replaces the scientific crowd by a systematic evaluation of model alternatives.

Robustness in Quantitative Research

In the literature, robustness has been defined in different ways:

  • as same sign and significance (Leamer)
  • as weighted average effect (Bayesian and Frequentist Model Averaging)
  • as effect stability We define robustness as effect stability.

Parameter Stability and Properties of Robustness

Robustness is the share of the probability density distribution of the baseline model that falls within the 95-percent confidence interval of the baseline model.  In formulaeic terms:

Formula

  • Robustness is left-–right symmetric: identical positive and negative deviations of the robustness test compared to the baseline model give the same degree of robustness.
  • If the standard error of the robustness test is smaller than the one from the baseline model, ρ converges to 1 as long as the difference in point estimates is negligible.
  • For any given standard error of the robustness test, ρ is always and unambiguously smaller the larger the difference in point estimates.
  • Differences in point estimates have a strong influence on ρ if the standard error of the robustness test is small but a small influence if the standard errors are large.

Robustness Testing in Four Steps

  1. Define the subjectively optimal specification for the data-generating process at hand. Call this model the baseline model.
  2. Identify assumptions made in the specification of the baseline model which are potentially arbitrary and that could be replaced with alternative plausible assumptions.
  3. Develop models that change one of the baseline model’s assumptions at a time. These alternatives are called robustness test models.
  4. Compare the estimated effects of each robustness test model to the baseline model and compute the estimated degree of robustness.

Model Variation Tests

Model variation tests change one or sometimes more model specification assumptions and replace with an alternative assumption, such as:

  • change in set of regressors
  • change in functional form
  • change in operationalization
  • change in sample (adding or subtracting cases)

Example: Functional Form Test

The functional form test examines the baseline model’s functional form assumption against a higher-order polynomial model. The two models should be nested to allow identical functional forms. As an example, we analyze the ‘environmental Kuznets curve’ prediction, which suggests the existence of an inverse u-shaped relation between per capita income and emissions.

Emissions and percapitaincome

Note: grey-shaded area represents confidence interval of baseline model

Another example of functional form testing is given in this review of Yield Curve Models:

http://jonathankinlay.com/2018/08/modeling-the-yield-curve/

Random Permutation Tests

Random permutation tests change specification assumptions repeatedly. Usually, researchers specify a model space and randomly and repeatedly select model from this model space. Examples:

  • sensitivity tests (Leamer 1978)
  • artificial measurement error (Plümper and Neumayer 2009)
  • sample split – attribute aggregation (Traunmüller and Plümper 2017)
  • multiple imputation (King et al. 2001)

We use Monte Carlo simulation to test the sensitivity of the performance of our Quantitative Equity strategy to changes in the price generation process and also in model parameters:

http://jonathankinlay.com/2017/04/new-longshort-equity/

Structured Permutation Tests

Structured permutation tests change a model assumption within a model space in a systematic way. Changes in the assumption are based on a rule, rather than random.  Possibilities here include:

  • sensitivity tests (Levine and Renelt)
  • jackknife test
  • partial demeaning test

Example: Jackknife Robustness Test

The jackknife robustness test is a structured permutation test that systematically excludes one or more observations from the estimation at a time until all observations have been excluded once. With a ‘group-wise jackknife’ robustness test, researchers systematically drop a set of cases that group together by satisfying a certain criterion – for example, countries within a certain per capita income range or all countries on a certain continent. In the example, we analyse the effect of earthquake propensity on quake mortality for countries with democratic governments, excluding one country at a time. We display the results using per capita income as information on the x-axes.

jackknife

Upper and lower bound mark the confidence interval of the baseline model.

Robustness Limit Tests

Robustness limit tests provide a way of analyzing structured permutation tests. These tests ask how much a model specification has to change to render the effect of interest non-robust. Some examples of robustness limit testing approaches:

  • unobserved omitted variables (Rosenbaum 1991)
  • measurement error
  • under- and overrepresentation
  • omitted variable correlation

For an example of limit testing, see this post on a review of the Lognormal Mixture Model:

http://jonathankinlay.com/2018/08/the-lognormal-mixture-variance-model/

Summary on Robustness Testing

Robustness tests have become an integral part of research methodology. Robustness tests allow to study the influence of arbitrary specification assumptions on estimates. They can identify uncertainties that otherwise slip the attention of empirical researchers. Robustness tests offer the currently most promising answer to model uncertainty.

Yield Curve Construction Models – Tools & Techniques

Yield Curve

Yield curve models are used to price a wide variety of interest rate-contingent claims.  The existence of several different competing methods of curve construction available and there is no single standard method for constructing yield curves and alternate procedures are adopted in different business areas to suit local requirements and market conditions.  This fragmentation has often led to confusion amongst some users of the models as to their precise functionality and uncertainty as to which is the most appropriate modeling technique. In addition, recent market conditions, which inter-alia have seen elevated levels of LIBOR basis volatility, have served to heighten concerns amongst some risk managers and other model users about the output of the models and the validity of the underlying modeling methods.

SSALGOTRADING AD

The purpose of this review, which was carried out in conjunction with research analyst Xu Bai, now at Morgan Stanley, was to gain a thorough understanding of current methodologies, to validate their theoretical frameworks and implementation, identify any weaknesses in the current modeling methodologies, and to suggest improvements or alternative approaches that may enhance the accuracy, generality and robustness of modeling procedures.

Yield Curve Construction Models

The Lognormal Mixture Variance Model

The LNVM model is a mixture of lognormal models and the model density is a linear combination of the underlying densities, for instance, log-normal densities. The resulting density of this mixture is no longer log-normal and the model can thereby better fit skew and smile observed in the market.  The model is becoming increasingly widely used for interest rate/commodity hybrids.

SSALGOTRADING AD

In this review of the model, I examine the mathematical framework of the model in order to gain an understanding of its key features and characteristics.

The LogNormal Mixture Variance Model

Modeling Asset Processes

Introduction

Over the last twenty five years significant advances have been made in the theory of asset processes and there now exist a variety of mathematical models, many of them computationally tractable, that provide a reasonable representation of their defining characteristics.

SSALGOTRADING AD

While the Geometric Brownian Motion model remains a staple of stochastic calculus theory, it is no longer the only game in town.  Other models, many more sophisticated, have been developed to address the shortcomings in the original.  There now exist models that provide a good explanation of some of the key characteristics of asset processes that lie beyond the scope of models couched in a simple Gaussian framework. Features such as mean reversion, long memory, stochastic volatility,  jumps and heavy tails are now readily handled by these more advanced tools.

In this post I review a critical selection of asset process models that belong in every financial engineer’s toolbox, point out their key features and limitations and give examples of some of their applications.


Modeling Asset Processes

Stochastic Calculus in Mathematica

Wolfram Research introduced random processes in version 9 of Mathematica and for the first time users were able to tackle more complex modeling challenges such as those arising in stochastic calculus.  The software’s capabilities in this area have grown and matured over the last two versions to a point where it is now feasible to teach stochastic calculus and the fundamentals of financial engineering entirely within the framework of the Wolfram Language.  In this post we take a lightening tour of some of the software’s core capabilities and give some examples of how it can be used to create the building blocks required for a complete exposition of the theory behind modern finance.

SSALGOTRADING AD

fig1 fig2

fig3 fig4 fig5 fig6 fig7 fig8 fig9

Conclusion

Financial Engineering has long been a staple application of Mathematica, an area in which is capabilities in symbolic logic stand out.  But earlier versions of the software lacked the ability to work with Ito calculus and model stochastic processes, leaving the user to fill in the gaps by other means.  All that changed in version 9 and it is now possible to provide the complete framework of modern financial theory within the context of the Wolfram Language.

The advantages of this approach are considerable.  The capabilities of the language make it easy to provide interactive examples to illustrate theoretical concepts and develop the student’s understanding of them through experimentation.  Furthermore, the student is not limited merely to learning and applying complex formulae for derivative pricing and risk, but can fairly easily derive the results for themselves.  As a consequence, a course in stochastic calculus taught using Mathematica can be broader in scope and go deeper into the theory than is typically the case, while at the same time reinforcing understanding and learning by practical example and experimentation.

Reflections on Careers in Quantitative Finance

CMU’s MSCF Program

Carnegie Mellon’s Steve Shreve is out with an interesting post on careers in quantitative finance, with his commentary on the changing landscape in quantitative research and the implications for financial education.

I taught at Carnegie Mellon in the late 1990’s, including its excellent Master’s program in quantitative finance that Steve co-founded, with Sanjay Srivastava.  The program was revolutionary in many ways and was immediately successful and rapidly copied by rival graduate schools (I help to spread the word a little, at Cambridge).

Fig1The core of the program remains largely unchanged over the last 20 years, featuring Steve’s excellent foundation course in stochastic calculus;  but I am happy to see that the school has added many, new and highly relevant topics to the second year syllabus, including market microstructure, machine learning, algorithmic trading and statistical arbitrage.  This has moved the program in terms of its primary focus, which was originally financial engineering, to include coverage of subjects that are highly relevant to quantitative investment research and trading.

It was this combination of sound theoretical grounding with practitioner-oriented training that made the program so successful.  As I recall, every single graduate was successful in finding a job on Wall Street, often at salaries in excess of $200,000, a considerable sum in those days.  One of the key features of the program was that it combined theoretical concepts with practical training, using a simulated trading floor gifted by Thomson Reuters (a model later adopted btrading-floor-1y the ICMA centre at the University of Reading in the UK).  This enabled us to test students’ understanding of what they had been taught, using market simulation models that relied upon key theoretical ideas covered in the program.  The constant reinforcement of the theoretical with the practical made for a much deeper learning experience for most students and greatly facilitated their transition to Wall Street.

Masters in High Frequency Finance

While CMU’s program has certainly evolved and remains highly relevant to the recruitment needs of Wall Street firms, I still believe there is an opportunity for a program focused exclusively on high frequency finance, as previously described in this post.  The MHFF program would be more computer science oriented, with less emphasis placed on financial engineering topics.  So, for instance, students would learn about trading hardware and infrastructure, the principles of efficient algorithm design, as well as HFT trading techniques such as order layering and priority management.  The program would also cover HFT strategies such as latency arbitrage, market making, and statistical arbitrage.  Students would learn both lower level (C++, Java) and higher level (Matlab, R) programming languages and there is  a good case for a mandatory machine code programming course also.  Other core courses might include stochastic calculus and market microstructure.

Who would run such a program?  The ideal school would have a reputation for excellent in both finance and computer science. CMU is an obvious candidate, as is MIT, but there are many other excellent possibilities.

Careers

I’ve been involved in quantitative finance since the beginning:  I recall programming one of the first 68000 Assembler microcomputers in the 1980s, which was ultimately used for an F/X system at a major UK bank. The ensuing rapid proliferation of quantitative techniques in finance has been fueled by the ubiquity of cheap computing power, facilitating the deployment of quantitate techniques that would previously been impractical to implement due to their complexity.  A good example is the machine learning techniques that now pervade large swathes of the finance arena, from credit scoring to HFT trading.  When I first began working in that field in the early 2000’s it was necessary to assemble a fairly sizable cluster of cpus to handle the computation load. These days you can access comparable levels of computational power on a single server and, if you need more, you can easily scale up via Azure or EC2.

fig3It is this explosive growth in computing power  that has driven the development of quantitative finance in both the financial engineering and quantitative investment disciplines. As the same time, the huge reduction in the cost of computing power has leveled the playing field and lowered barriers to entry.  What was once the exclusive preserve of the sell-side has now become readily available to many buy-side firms.  As a consequence, much of the growth in employment opportunities in quantitative finance over the last 20 years has been on the buy-side, with the arrival of quantitative hedge funds and proprietary trading firms, including my own, Systematic Strategies.  This trend has a long way to play out so that, when also taking into consideration the increasing restrictions that sell-side firms face in terms of their proprietary trading activity, I am inclined to believe that the buy-side will offer the best employment opportunities for quantitative financiers over the next decade.

It was often said that hedge fund managers are typically in their 30’s or 40’s when they make the move to the buy-side. That has changed in the last 15 years, again driven by the developments in technology.  These days you are more likely to find the critically important technical skills in younger candidates, in their late 20’s or early 30’s.  My advice to those looking for a career in quantitative finance, who are unable to find the right job opportunity, would be: do what every other young person in Silicon Valley is doing:  join a startup, or start one yourself.