How Analysts Traditionally Value Equity
 I learned the traditional method for producing equity valuations in the 1980’s, from Chase bank’s excellent credit training program. The standard technique was to develop several years of projected financial statements, and then discount the cash flows and terminal value to arrive at an NPV. I’m guessing the basic approach hasn’t changed all that much over the last 30-40 years and probably continues to serve as the fundamental building block for M&A transactions and PE deals.

Amongst several excellent texts on the topic I can recommend, for example, Aswath Damodaran’s book on valuation.
Arguably the weakest point in the methodology are the assumptions made about the long term growth rate of the business and the rate used to discount the cash flows to produce the PV. Since we are dealing with long term projections, small variations in these rates can make a considerable difference to the outcome.
The Monte Carlo Approach
Around 20 years ago I wrote a paper titled “A New Approach to Equity Valuation”, in which I attempted to define a new methodology for equity valuation. The idea was simple enough: instead of guessing an appropriate rate to discount the projected cash flows generated by the company, you embed the riskiness into the cash flows themselves, using probability distributions. That allows you to model the cash flows using Monte Carlo simulation and discount them using the risk-free rate, which is much easier to determine. In a similar vein, the model can allow for stochastic growth rates, perhaps also taking into account the arrival of potential new entrants, or disruptive technologies.
I recall taking the idea to an acquaintance of mine who at the time was head of M&A at a prestigious boutique bank in London. About five minutes into the conversation I realized I had lost him at “Monte Carlo”. It was yet another instance of the gulf between the fundamental and quantitative approach to investment finance, something I have always regarded as rather artificial. The line has blurred in several places over the last few decades – option theory of the firm and factor models, to name but two examples – but remains largely intact. I have met very few equity analysts who have the slightest clue about quantitative research and vice-versa, for that matter. This is a pity in my view, as there is much to be gained by blending knowledge of the two disciplines.

The basic idea of the Monte Carlo approach is to formulate probability distributions for key variables that drive the business, such as sales, gross margin, cost of goods, etc., as well as related growth rates. You then determine the outcome in terms of P&L and cash flows over a large number of simulations, from which you can derive a probability distribution for the firm/equity value.

There are two potential sources of data one can use to build a Monte Carlo model: the historical distributions of the variables and information from line management. It is the latter that is likely to be especially useful, because you can embed management’s expertise and understanding of the business and its competitive environment directly into the model variables, rather than relying upon a single discount rate to account for all the possible sources of variation in the cash flows.
It can get a little complicated, of course: one cannot simply assume that all the variables evolve independently – COGS is likely to fall as a % of sales as sales increase, for example, due to economies of scale. Such interactive effects are critically important and it is necessary to dig deep into the inner workings of the business to model them successfully. But to those who may view such a task as overwhelmingly complicated I can offer several counter examples. For instance, in the 1970’s I worked on large scale simulation models of the North Sea oil fields that incorporated volumes of information from geology to engineering to financial markets. Another large scale simulation was built to assess how best to manage tanker traffic at one of the world’s busiest sea ports.
Creating a simulation model of the financials of a single firm is a simple task, by comparison. And, after you have built the model it will typically remain fundamentally unchanged in basic form for many years making the task of producing valuation estimates much easier in future.
Applications of Monte Carlo Methods in Equity Valuation
Ok, so what’s the point? At the end of the day, don’t you just end up with the same result as from traditional methods, i.e. an estimate of the equity or firm value? Actually no – what you have instead is an estimate of the probability distribution of the value, something decidedly more useful.
For example:
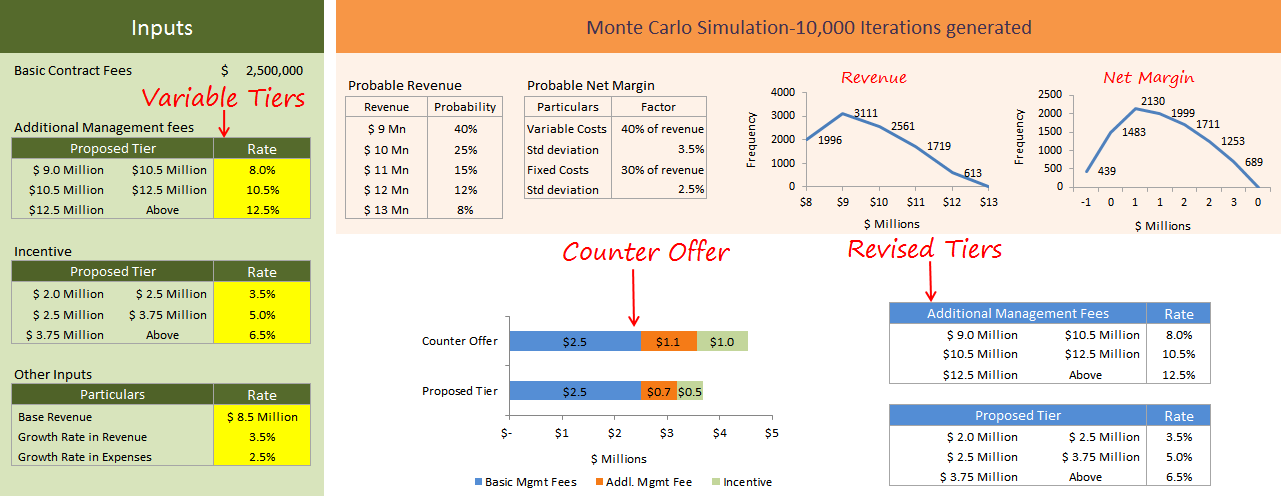
Contract Negotiation
Monte Carlo methods have been applied successfully to model contract negotiation scenarios, for instance for management consulting projects, where several rounds of negotiation are often involved in reaching an agreed pricing structure.
Stock Selection
You might build a portfolio of value stocks whose share price is below the median value, in the expectation that the majority of the universe will prove to be undervalued, over the long term. Or you might embed information about the expected value of the equities in your universe (and their cashflow volatilities) into you portfolio construction model.
Private Equity / Mergers & Acquisitions
In a PE or M&A negotiation your model provides a range of values to select from, each of which is associated with an estimated “probability of overpayment”. For example, your opening bid might be a little below the median value, where it is likely that you are under-bidding for the projected cash flows. That allows some headroom to increase the bid, if necessary, without incurring too great a risk of over-paying.
Recent Research
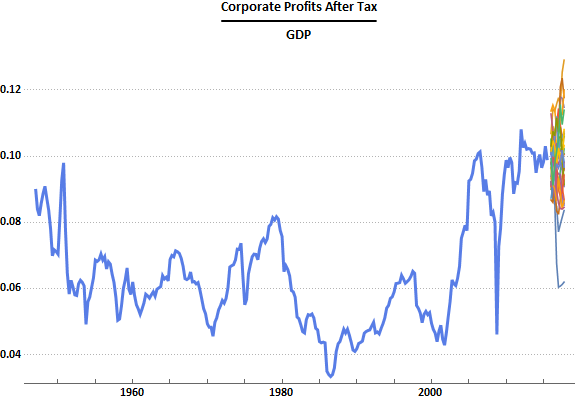
A survey of recent research in the field yields some interesting results, amongst them a paper by Magnus Pedersen entitled Monte Carlo Simulation in Financial Valuation (2014). Pedersen takes a rather different approach to applying Monte Carlo methods to equity valuation. Specifically, he uses the historical distribution of the price/book ratio to derive the empirical distribution of the equity value rather than modeling the individual cash flows. This is a sensible compromise for someone who, unlike an analyst at a major sell-side firm, may not have access to management information necessary to build a more sophisticated model. Nevertheless, Pedersen is able to demonstrate quite interesting results using MC methods to construct equity portfolios (weighted according to the Kelly criterion), in an accompanying paper Portfolio Optimization & Monte Carlo Simulation (2014).
For those who find the subject interesting, Pedersen offers several free books on his web site, which are worth reviewing.