

A perennial favorite with investors, presumably because they are easy to understand and implement, are trades based on a regularly occurring pattern, preferably one that is seasonal in nature. A well-known example is the Christmas effect, wherein equities generally make their highest risk-adjusted returns during the month of December (and equity indices make the greater proportion of their annual gains in the period from November to January).
As we approach the Easter holiday I thought I might join in the fun with a trade of my own. There being not much new under the sun, I can assume that there is some ancient trader’s almanac that documents the effect I am about to describe. If so, I apologize in advance if this is duplicative.
The Pattern of Returns in the S&P 500 Index Around Easter
I want to look at the pattern of pre- and post- Easter returns in the S&P 500 index using weekly data from 1950 (readers can of course substitute the index, ETF or other tradable security in a similar analysis).
The first question is whether there are significant differences (economic and statistical) in index returns in the weeks before and after Easter, compared to a regular week.
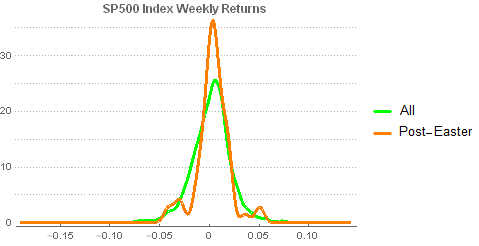
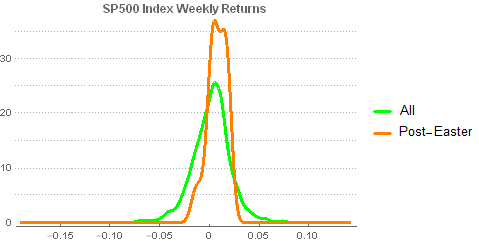
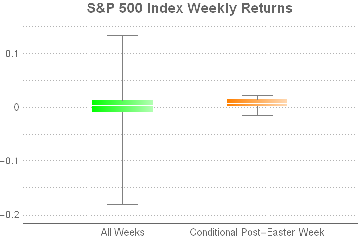
It is perhaps not immediately apparent from the smooth histogram plot above, but a whisker plot gives a clearer indication of the disparity in the distributions of returns in the post-Easter week vs. regular weeks.
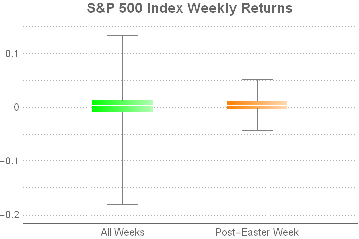
It is evident that chief distinction is not in the means of the distributions, but in their variances.
A t-test (with unequal variances) confirms that the difference in average returns in the index in the post-Easter week vs. normal weeks is not statistically significant.
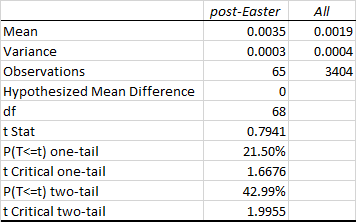 It appears that there is nothing special about Index returns in the post-Easter period.

The Lazarus Effect
Hold on – not so fast. Suppose we look at conditional returns: that is to say, we consider returns in the post-Easter week for holiday periods in which the index sold off in the week prior to Easter.
There are 26 such periods in the 65 years since 1950 and when we compare the conditional distribution of index returns for these periods against the unconditional distribution of weekly returns we appear to find significant differences in the distributions. Not only is the variance of the conditional returns much tighter, the mean is clearly higher than the unconditional weekly returns.
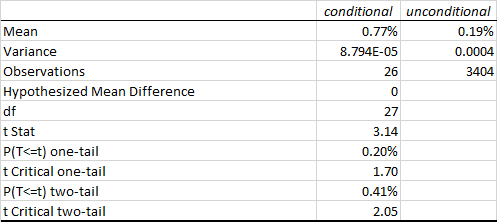
The comparison is perhaps best summarized in the following table. Here we can see that the average conditional return is more than twice that of the unconditional return in the post-Easter week and almost 4x as large as the average weekly return in the index. The standard deviation in conditional returns for the post-Easter week is less than half that of the unconditional weekly return, producing and information ratio that is almost 10x larger. Furthermore, of the 26 periods in which the index return in the week prior to Easter was negative, 22 (85%) produced a positive return in the week after Easter (compared to a win rate of only 57% for unconditional weekly returns.

A t-test of conditional vs. unconditional weekly returns confirms that the 58bp difference in conditional vs unconditional (all weeks) average returns is statistically significant at the 0.2% level.
Our initial conclusion, therefore, is that there appears to be a statistically significant pattern in the conditional returns in the S&P 500 index around the post-Easter week. Specifically, the returns in the post-Easter week tend to be much higher than average for periods in which the pre-Easter weekly returns were negative.
More simply, the S&P 500 index tends to rebound strongly in the week after Easter – a kind of “Lazarus” effect.
Lazarus – Or Not?
Hold on – not so fast. What’s so special about Easter? Yes, I realize it’s topical. But isn’t this so-called Lazarus effect just a manifestation of the usual mean-reversion in equity index returns? There is a tendency for weekly returns in the S&P 500 index to “correct” in the week after a downturn. Maybe the Lazarus effect isn’t specific to Easter.
To examine this hypothesis we need to compare two sets of conditional weekly returns in the S&P 500 index:
A: Weeks in which the prior week’s return was negative
B: the subset of A which contains only post-Easter weeks
If the difference in average returns for sets A and B is not statistically significant, we would conclude that the so-called Lazarus effect is just a manifestation of the commonplace mean reversion in weekly returns. Only if the average return for the B data set is significant higher than that for set A would we be able to conclude that, in addition to normal mean reversion at weekly frequency, there is an incremental effect specific to the Easter period – the Lazarus effect.
Let’s begin by establishing that there is a statistically significant mean reversion effect in weekly returns in the S&P 500 Index. Generally, we expect a fall in the index to be followed by a rise (and perhaps vice versa). So we need to compare the returns in the index for weeks in which the preceding week’s return was positive, vs weeks in which the preceding week’s return was negative. The t-test below shows the outcome.
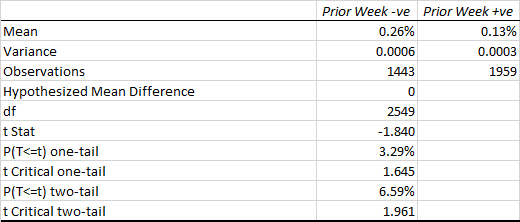
The average return in weeks following a downturn is approximately double that during weeks following a rally and the effect is statistically significant at the 3% level.
Given that result, is there any incremental “Lazarus” effect around Easter? We test that hypothesis by comparing the average returns during the 26 post-Easter weeks which were preceded by a downturn in the index against the average return for all 1,444 weeks which followed a decline in the index.
The t-test shown in the table below confirms that conditional returns in post-Easter weeks are approximately 3x larger on average than returns for all weeks that followed a decline in the index.

Lazarus, it appears, is alive and well.
Happy holidays, all.