Improving Trading System Performance Using a Meta-Strategy

What is a Meta-Strategy?

In my previous post on identifying drivers of strategy performance I mentioned the possibility of developing a meta-strategy.

fig0A meta-strategy is a trading system that trades trading systems.  The idea is to develop a strategy that will make sensible decisions about when to trade a specific system, in a way that yields superior performance compared to simply following the underlying trading system.  Put another way, the simplest kind of meta-strategy is a long-only strategy that takes positions in some underlying trading system.  At times, it will follow the underlying system exactly; at other times it is out of the market and ignore the trading system’s recommendations.

More generally, a meta-strategy can determine the size in which one, or several, systems should be traded at any point in time, including periods where the size can be zero (i.e. the system is not currently traded).  Typically, a meta-strategy is long-only:  in theory there is nothing to stop you developing a meta-strategy that shorts your underlying strategy from time to time, but that is a little counter-intuitive to say the least!

A meta-strategy is something that could be very useful for a fund-of-funds, as a way of deciding how to allocate capital amongst managers.

Caissa Capital operated a meta-strategy in its option arbitrage hedge fund back in the early 2000’s.  The meta-strategy (we called it a “model management system”) selected from a half dozen different volatility models to be used for option pricing, depending their performance, as measured by around 30 different criteria.  The criteria included both statistical metrics, such as the mean absolute percentage error in the forward volatility forecasts, as well as trading performance criteria such as the moving average of the trade PNL.  The model management system probably added 100 – 200 basis points per annum to the performance the underlying strategy, so it was a valuable add-on.

Illustration of a Meta-Strategy in US Bond Futures

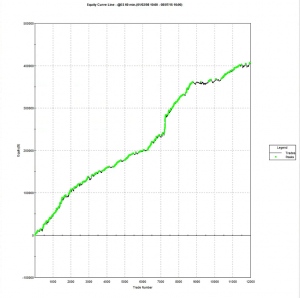
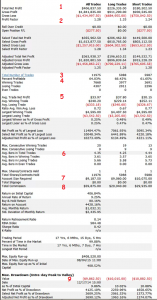
To illustrate the concept we will use an underlying system that trades US Bond futures at 15-minute bar intervals.  The performance of the system is summarized in the chart and table below.

Fig1A


FIG2A


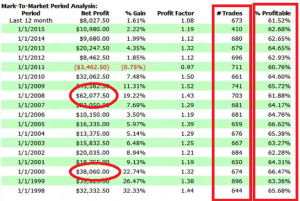
Strategy performance has been very consistent over the last seven years, in terms of the annual returns, number of trades and % win rate.  Can it be improved further?

To assess this possibility we create a new data series comprising the points of the equity curve illustrated above.  More specifically, we form a series comprising the open, high, low and close values of the strategy equity, for each trade.  We will proceed to treat this as a new data series and apply a range of different modeling techniques to see if we can develop a trading strategy, in exactly the same way as we would if the underlying was a price series for a stock.

It is important to note here that, for the meta-strategy at least, we are working in trade-time, not calendar time. The x-axis will measure the trade number of the underlying strategy, rather than the date of entry (or exit) of the underlying trade.  Thus equally spaced points on the x-axis represent different lengths of calendar time, depending on the duration of each trade.

It is necessary to work in trade time rather than calendar time because, unlike a stock, it isn’t possible to trade the underlying strategy whenever we want to – we can only enter or exit the strategy at points in time when it is about to take a trade, by accepting that trade or passing on it (we ignore the other possibility which is sizing the underlying trade, for now).

SSALGOTRADING AD

Another question is what kinds of trading ideas do we want to consider for the meta-strategy?  In principle one could incorporate almost any trading concept, including the usual range of technical indictors such as RSI, or Bollinger bands.  One can go further an use machine learning techniques, including Neural Networks, Random Forest, or SVM.

In practice, one tends to gravitate towards the simpler kinds of trading algorithm, such as moving averages (or MA crossover techniques), although there is nothing to say that more complex trading rules should not be considered.  The development process follows a familiar path:  you create a hypothesis, for example, that the equity curve of the underlying bond futures strategy tends to be mean-reverting, and then proceed to test it using various signals – perhaps a moving average, in this case.  If the signal results in a potential improvement in the performance of the default meta-strategy (which is to take every trade in the underlying system system), one includes it in the library of signals that may ultimately be combined to create the finished meta-strategy.

As with any strategy development you should follows the usual procedure of separating the trade data to create a set used for in-sample modeling and out-of-sample performance testing.

Following this general procedure I arrived at the following meta-strategy for the bond futures trading system.

FigB1

FigB2

The modeling procedure for the meta-strategy has succeeded in eliminating all of the losing trades in the underlying bond futures system, during both in-sample and out-of-sample periods (comprising the most recent 20% of trades).

In general, it is unlikely that one can hope to improve the performance of the underlying strategy quite as much as this, of course.  But it may well be possible to eliminate a sufficient proportion of losing trades to reduce the equity curve drawdown and/or increase the overall Sharpe ratio by a significant amount.

A Challenge / Opportunity

If you like the meta-strategy concept, but are unsure how to proceed, I may be able to help.

Send me the data for your existing strategy (see details below) and I will attempt to model a meta-strategy and send you the results.  We can together evaluate to what extent I have been successful in improving the performance of the underlying strategy.

Here are the details of what you need to do:

1. You must have an existing, profitable strategy, with sufficient performance history (either real, simulated, or a mixture of the two).  I don’t need to know the details of the underlying strategy, or even what it is trading, although it would be helpful to have that information.

2. You must send  the complete history of the equity curve of the underlying strategy,  in Excel format, with column headings Date, Open, High, Low, Close.  Each row represents consecutive trades of the underlying system and the O/H/L/C refers to the value of the equity curve for each trade.

3.  The history must comprise at least 500 trades as an absolute minimum and preferably 1000 trades, or more.

4. At this stage I can only consider a single underlying strategy (i.e. a single equity curve)

5.  You should not include any software or algorithms of any kind.  Nothing proprietary, in other words.

6.  I will give preference to strategies that have a (partial) live track record.

As my time is very limited these days I will not be able to deal with any submissions that fail to meet these specifications, or to enter into general discussions about the trading strategy with you.

You can reach me at jkinlay@systematic-strategies.com


Trading Strategy Design

In this post I want to share some thoughts on how to design great automated trading strategies – what to look for, and what to avoid.

For illustrative purposes I am going to use a strategy I designed for the ever-popular S&P500 e-mini futures contract.

The overall equity curve for the strategy is show below.

@ES Equity Curve

This is often the best place to start.  What you want to see, of course, is a smooth, upward-sloping curve, without too many sizable drawdowns, and one in which the strategy continues to make new highs.  This is especially important in the out-of-sample test period (Jan 2014- Jul 2015 in this case).  You will notice a flat period around 2013, which we will need to explore later.  Overall, however, this equity curve appears to fit the stereotypical pattern we hope to see when developing a new strategy.

Let’s move on look at the overall strategy performance numbers.

STRATEGY PERFORMANCE CHARACTERISTICS

@ES Perf Summary(click to enlarge)

 1. Net Profit
Clearly, the most important consideration.  Over the 17 year test period the strategy has produced a net profit  averaging around $23,000 per annum, per contract.  As a rough guide, you would want to see a net profit per contract around 10x the maintenance margin, or higher.

2. Profit Factor
The gross profit divided by the gross loss.  You want this to be as high as possible. Too low, as the strategy will be difficult to trade, because you will see sustained periods of substantial losses.  I would suggest a minimum acceptable PF in the region of 1.25.  Many strategy developers aim for a PF of 1.5, or higher.

3. Number of Trades
Generally, the more trades the better, at least from the point of view of building confidence in the robustness of strategy performance.  A strategy may show a great P&L, but if it only trades once a month it is going to take many many years of performance data to ensure statistical significance.  This strategy, on the other hand, is designed to trade 2-3 times a day.  Given that, and the length of the test period, there is little doubt that the results are statistically significant.

SSALGOTRADING AD

Profit Factor and number of trades are opposing design criteria – increasing the # trades tends to reduce the PF.  That consideration sets an upper bound on the # trades that can be accommodated, before the profit factor deteriorates to unacceptably low levels.  Typically, 4-5 trades a day is about the maximum trading frequency one can expect to achieve.

4. Win Rate
Novice system designers tend to assume that you want this to be as high as possible, but that isn’t typically the case.  It is perfectly feasible to design systems that have a 90% win rate, or higher, but which produce highly undesirable performance characteristics, such as frequent, large drawdowns.  For a typical trading system the optimal range for the win rate is in the region of 40% to 66%.  Below this range, it becomes difficult to tolerate the long sequences of losses that will result, without losing faith in the system.

5. Average Trade
This is the average net profit per trade.  A typical range would be $10 to $100.  Many designers will only consider strategies that have a higher average trade than this one, perhaps $50-$75, or more.  The issue with systems that have a very small average trade is that the profits can quickly be eaten up by commissions. Even though, in this case, the results are net of commissions, one can see a significant deterioration in profits if the average trade is low and trade frequency is high, because of the risk of low fill rates (i.e. the % of limit orders that get filled).  To assess this risk one looks at the number of fills assumed to take place at the high or low of the bar.  If this exceeds 10% of the total # trades, one can expect to see some slippage in the P&L when the strategy is put into production.

6. Average Bars
The number of bars required to complete a trade, on average.  There is no hard limit one can suggest here – it depends entirely on the size of the bars.  Here we are working in 60 minute bars, so a typical trade is held for around 4.5 hours, on average.   That’s a time-frame that I am comfortable with.  Others may be prepared to hold positions for much longer – days, or even weeks.

Perhaps more important is the average length of losing trades. What you don’t want to see is the strategy taking far longer to exit losing trades than winning trades. Again, this is a matter of trader psychology – it is hard to sit there hour after hour, or day after day, in a losing position – the temptation to cut the position becomes hard to ignore.  But, in doing that you are changing the strategy characteristics in a fundamental way, one that rarely produces a performance improvement.

What the strategy designer needs to do is to figure out in advance what the limits are of the investor’s tolerance for pain, in terms of maximum drawdown, average losing trade, etc, and design the strategy to meet those specifications, rather than trying to fix the strategy afterwards.

7. Required Account Size
It’s good to know exactly how large an account you need per contract, so you can figure out how to scale the strategy.  In this case one could hope to scale the strategy up to a 10-lot in a $100,000 account.  That may or may not fit the trader’s requirements and again, this needs to be considered at the outset.  For example, for a trader looking to utilize, say, $1,000,000 of capital, it is doubtful whether this strategy would fit his requirements without considerable work on the implementations issues that arise when trying to trade in anything approaching a 100 contract clip rate.

8. Commission
Always check to ensure that the strategy designer has made reasonable assumptions about slippage and commission.  Here we are assuming $5 per round turn.  There is no slippage, because the strategy executes using limit orders.

9. Drawdown
Drawdowns are, of course, every investor’s bugbear.  No-one likes drawdowns that are either large, or lengthy in relation to the annual profitability of the strategy, or the average trade duration.  A $10,000 max drawdown on a strategy producing over $23,000 a year is actually quite decent – I have seen many e-mini strategies with drawdowns at 2x – 3x that level, or larger.  Again, this is one of the key criteria that needs to be baked into the strategy design at the outset, rather than trying to fix later.

 ANNUAL PROFITABILITY

Let’s now take a look at how the strategy performs year-by-year, and some of the considerations and concerns that often arise.

@ES Annual1. Performance During Downturns
One aspect I always pay attention to is how well the strategy performs during periods of high market stress, because I expect similar conditions to arise in the fairly near future, e.g. as the Fed begins to raise rates.

Here, as you can see, the strategy performed admirably during both the dot com bust of 1999/2000 and the financial crisis of 2008/09.

2. Consistency in the # Trades and % Win Rate
It is not uncommon with low frequency strategies to see periods of substantial variation in the # trades or win rate.  Regardless how good the overall performance statistics are, this makes me uncomfortable.  It could be, for instance, that the overall results are influenced by one or two exceptional years that are unlikely to be repeated.  Significant variation in the trading or win rate raise questions about the robustness of the strategy, going forward.  On the other hand, as here, it is a comfort to see the strategy maintaining a very steady trading rate and % win rate, year after year.

3. Down Years
Every strategy shows variation in year to year performance and one expects to see years in which the strategy performs less well, or even loses money. For me, it rather depends on when such losses arise, as much as the size of the loss.  If a loss occurs in the out-of-sample period it raises serious questions about strategy robustness and, as a result, I am very unlikely to want to put such a strategy into production. If, as here, the period of poor performance occurs during the in-sample period I am less concerned – the strategy has other, favorable characteristics that make it attractive and I am willing to tolerate the risk of one modestly down-year in over 17 years of testing.

INTRA-TRADE DRAWDOWNS

Many trades that end up being profitable go through a period of being under-water.  What matters here is how high those intra-trade losses may climb, before the trade is closed.  To take an extreme example, would you be willing to risk $10,000 to make an average profit of only $10 per trade?  How about $20,000? $50,000? Your entire equity?

The Maximum Average Excursion chart below shows the drawdowns on a trade by trade basis.  Here we can see that, over the 17 year test period, no trade has suffered a drawdown of much more than $5,000.  I am comfortable with that level. Others may prefer a lower limit, or be tolerant of a higher MAE.

MAE

Again, the point is that the problem of a too-high MAE is not something one can fix after the event.  Sure, a stop loss will prevent any losses above a specified size.  But a stop loss also has the unwanted effect of terminating trades that would have turned into money-makers. While psychologically comfortable, the effect of a stop loss is almost always negative  in terms of strategy profitability and other performance characteristics, including drawdown, the very thing that investors are looking to control.

 CONCLUSION
I have tried to give some general guidelines for factors that are of critical importance in strategy design.  There are, of course, no absolutes:  the “right” characteristics depend entirely on the risk preferences of the investor.

One point that strategy designers do need to take on board is the need to factor in all of the important design criteria at the outset, rather than trying (and usually failing) to repair the strategy shortcomings after the event.


Algorithmic Trading

MOVING FROM RESEARCH TO TRADING

I have written recently about the comparative advantages of different programming languages in the context of research and trading (see here).  My sense of it is that there is no single “ideal” programming language – the best strategy is to pick an appropriate tool for the job and there are usually several reasonable choices one could make.

If you are engaged in econometrics research, you might choose a package like RATS, Eviews, Gauss, or Prof. James Davidson’s excellent and inexpensive TSM, which I have used for many years and can recommend highly. For a latency-sensitive high frequency trading application, you will probably want to use something like C++, or possibly a 3rd party algo system like Apama or Tethys. But for algorithmic trading systems of intermediate frequency the choice appears almost unlimited.

Matlab AlgoThe problem with retail trading tools like TradeStation, Multicharts, or Amibroker, is that they are designed primarily for single-asset strategies.  That may be ok for futures trading,where more often than not the focus is on a single underlying, but in equities the opposite is true. Using one of these products to develop and implement a pairs trading strategy is a stretch.   As for portfolio analytics – forget it.

This is where more general, high level languages like R, Matlab or Mathematica come in:  their greater power and flexibility is handling large, multivariate data sets makes it much more straightforward to develop portfolio strategies. And they can often bridge the gap between R&D and implementation quite easily:  code that was used in the research stage can often be quickly re-tooled to work in a production version of the system.  As for production systems, there is now a significant cottage industry of traders who use Matlab in algo trading.  R has a similar following (see here).

In addition to parallelizing the code (for use with the Parallel Computing Toolbox) to speed up the research phase, you might also want to implement a hybrid system by re-coding the slower routines in C++, to create a mex file (for details see here). Matlab’s Profiler is a useful tool for identifying code bottlenecks.  In a recent piece of research in which I was evaluating over 30,000,000 cointegrated portfolios, I discovered to my surprise that the main code bottleneck was the multiple calls to Matlab’s std function, a problem easily fixed with a few lines of C++ code.  The resulting hybrid program executed at more than twice the speed – important when your run time might be several hours, or even days.

HOOKING UP THE EXECUTION PLATFORM

The main challenge for developers using generic tools like Mathematica, Matlab or R is the implementation stage of the project. Providing connectivity to brokerage/execution platforms never seemed high on the list of priorities for Wolfram or Mathworks and things are similarly hit or miss with R.

Belatedly, Mathematica now offers a link to Bloomberg via its Finance Platform.  Matlab, meanwhile, offers a Trading Toolbox, which supposedly offers connectivity , not only to Bloomberg, but also Interactive Brokers and Trading Technologies, amongst other platforms.  Unfortunately, the toolbox interface to IB appears to rely on outdated 1990s ActiveX technology, which is flakey at best.  In tests, I was unable to make progress past the ‘not connected’ error message.

At that point I turned to Yair Altman’s  IB-Matlab product.  Happily, this uses IB’s Java api, which is a great deal more robust than the ActiveX platform.  It’s been some time since I last used IB-Matlab and was pleased to see that Yair has been very busy over the intervening period, building the capabilities of the system and providing very comprehensive documentation for it.  With Yair’s help, it took me no time at all to get up and running and within a day or two the system was executing orders flawlessly in IB’s TWS.  The relatively few snags I ran into were almost all due to IB’s extremely terse error messaging, which often gives almost no clue as to what the issue might be.  Fortunately, Yair is very generous with his time in providing support to his users and his responses to me questions were fast and detailed.

EXECUTION ALGOS

With intermediate  systems trading at frequencies of, say, 5-minutes to daily, one has a choice to make as regards execution.  Given that the strategy is not very latency sensitive, it is certainly conceivable to develop one’s own execution algos in Matlab.  However, platforms like TWS are equipped with native algos, not only from IB, but also other providers like Credit Suisse and JefAD Algofries.

Actually, I have found several of IB’s own algos such as Scaletrader and Accumulate/Distribute to be very effective. Certainly IB seems very proud of them – IB CEO Thomas Peterffy has patented at least one of them. Accumulate/Distribute, for instance, is quite sophisticated, allowing the user to randomize and slice the size and interval between individual orders, use passive or aggressive order types, and pause execution on a news alert, or when the price falls below a moving average, or outside a specified range.

There is much to be said for using algos native to the execution platform rather than reinventing the wheel, providing the cost is reasonable. So, while it is perfectly feasible to build execution algos in Matlab, it typically isn’t necessary – in most cases standard algos will suffice.

There are exceptions, of course.  IB doesn’t offer the  kind of basket-trading capabilities REDIthat are available in advanced algo platforms like Tethys or RediPlus.  In those systems, for example, you can set the level of long/short imbalance in the portfolio that you are willing to tolerate and the algo will speed up or slow down execution of trades in individual components of the basket to maintain the dollar imbalance within that tolerance.  You can also manage the sector risk dynamically during execution.

Those kind of advanced capabilities don’t come cheap and you wont find them at IB, or any other retail platform. If you need that kind of functionality, for example, because you are trading a long/short equity portfolio within a universe of 200-300 names, your best option is probably to switch to a different execution platform.  Otherwise you will need to code a custom algo in your language of choice.

For many quantitative strategies, (at least the low frequency ones) IB’s standard algos are often good enough.  The Accumulate/Distribute algo, for instance, will show a visual representation of the progress of the execution of individuals legs of a pairs trade, and it is easy enough to identify a potential imbalance and adjust the algo parameters in real time. If you are only trading pairs, or small portfolios of cointegrated securities, it probably isn’t worthwhile to develop the sophisticated logic that would be required to handle the adjustment of the execution of individual legs of a trade in a fully automated way.  A large portfolio would be a different matter, however.

MATLAB EXAMPLE

I thought it might be instructive to take a look at how you might implement the execution of a strategy in Matlab, using IB algos. In the Matlab code fragment below, the (2 x nTickers) array tradeActions contains, in the first row, the action we wish to take (1 = BUY, -1 = SELL, -2 = SELL SHORT) and in the second row the (absolute value of) the number of shares we wish to trade for tickers i =1:nTickers. We break each order up into hundred lots and odd lots, routing the former via IB’s Accumulate/Distribute algo and the latter as passive REL orders (note that A/D  will typically randomize the timing of each sub-order, while REL orders are posted directly into the market). The Matlab function AccumulateDistribute implements the most important features of IB’s A/D algo, including random size and time slicing of the order.  Orders are submitted as passive REL orders with zero offset (so they will sit on the current bid or ask) – obviously you would typically want to consider allowing some non-zero offset for less liquid securities.  It is not hard to envisage how one might further enhance the algo to monitor the progress of the execution and speed up or slow down certain orders accordingly.

MatlabA couple of IB api “gotchas” to be aware of:

(i) IB requires unique and monotonically increasing orderIds for each order. One way to do this, suggested by Yair, is to use orderId = round((now-735000)*3e5);  This fails when you are submitting a number of orders sequentially at high speed (say in a for loop), where the time increments are sub-second, so you need to pass the orderID back and force a minimal increment, as I have in the code below.

(ii) It is very important to specify the primary exchange of each security:  securities with identical tickers can be found trading on different exchanges.  Failing to specify the primary exchange in such a case will result in IB rejecting the order with a typically cryptic api message.

Continue reading “Algorithmic Trading”

High Frequency Trading with ADL – JonathanKinlay.com

Trading Technologies’ ADL is a visual programming language designed specifically for trading strategy development that is integrated in the company’s flagship XTrader product. ADL Extract2 Despite the radically different programming philosophy, my experience of working with ADL has been delightfully easy and strategies that would typically take many months of coding in C++ have been up and running in a matter of days or weeks.  An extract of one such strategy, a high frequency scalping trade in the E-Mini S&P 500 futures, is shown in the graphic above.  The interface and visual language is so intuitive to a trading system developer that even someone who has never seen ADL before can quickly grasp at least some of what it happening in the code.

Strategy Development in Low vs. High-Level Languages
What are the benefits of using a high level language like ADL compared to programming languages like C++/C# or Java that are traditionally used for trading system development?  The chief advantage is speed of development:  I would say that ADL offers the potential up the development process by at least one order of magnitude.  A complex trading system would otherwise take months or even years to code and test in C++ or Java, can be implemented successfully and put into production in a matter of weeks in ADL. In this regard, the advantage of speed of development is one shared by many high level languages, including, for example, Matlab, R and Mathematica.  But in ADL’s case the advantage in terms of time to implementation is aided by the fact that, unlike generalist tools such as MatLab, etc, ADL is designed specifically for trading system development.  The ADL development environment comes equipped with compiled pre-built blocks designed to accomplish many of the common tasks associated with any trading system such as acquiring market data and handling orders.  Even complex spread trades can be developed extremely quickly due to the very comprehensive library of pre-built blocks.

SSALGOTRADING AD

Integrating Research and Development
One of the drawbacks of using a higher  level language for building trading systems is that, being interpreted rather than compiled, they are simply too slow – one or more orders of magnitude, typically – to be suitable for high frequency trading.  I will come on to discuss the execution speed issue a little later.  For now, let me bring up a second major advantage of ADL relative to other high level languages, as I see it.  One of the issues that plagues trading system development is the difficulty of communication between researchers, who understand financial markets well, but systems architecture and design rather less so, and developers, whose skill set lies in design and programming, but whose knowledge of markets can often be sketchy.  These difficulties are heightened where researchers might be using a high level language and relying on developers to re-code their prototype system  to get it into production.  Developers  typically (and understandably) demand a high degree of specificity about the requirement and if it’s not included in the spec it won’t be in the final deliverable.  Unfortunately, developing a successful trading system is a highly non-linear process and a researcher will typically have to iterate around the core idea repeatedly until they find a combination of alpha signal and entry/exit logic that works.  In other words, researchers need flexibility, whereas developers require specificity. ADL helps address this issue by providing a development environment that is at once highly flexible and at the same time powerful enough to meet the demands of high frequency trading in a production environment.  It means that, in theory, researchers and developers can speak a common language and use a common tool throughout the R&D development cycle.  This is likely to reduce the kind of misunderstanding between researchers and developers that commonly arise (often setting back the implementation schedule significantly when they do).

Latency
Of course,  at least some of the theoretical benefit of using ADL depends on execution speed.  The way the problem is typically addressed with systems developed in high level languages like Matlab or R is to recode the entire system in something like C++, or to recode some of the most critical elements and plug those back into the main Matlab program as dlls.  The latter approach works, and preserves the most important benefits of working in both high and low level languages, but the resulting system is likely to be sub-optimal and can be difficult to maintain. The approach taken by Trading Technologies with ADL is very different.  Firstly,  the component blocks are written in  C# and in compiled form should run about as fast as native code.  Secondly, systems written in ADL can be deployed immediately on a co-located algo server that is plugged directly into the exchange, thereby reducing latency to an acceptable level.  While this is unlikely to sufficient for an ultra-high frequency system operating on the sub-millisecond level, it will probably suffice for high frequency systems that operate at speeds above above a few millisecs, trading up to say, around 100 times a day.

Fill Rate and Toxic Flow
For those not familiar with the HFT territory, let me provide an example of why the issues of execution speed and latency are so important.  Below is a simulated performance record for a HFT system in ES futures.  The system is designed to enter and exit using limit orders and trades around 120 times a day, with over 98% profitability, if we assume a 100% fill rate. Monthly PNL 1 Perf Summary 1  So far so good.  But  a 100% fill rate  is clearly unrealistic.  Let’s look at a pessimistic scenario: what if we  got filled on orders only when the limit price was exceeded?  (For those familiar with the jargon, we are assuming a high level of flow toxicity)  The outcome is rather different: Perf Summary 2 Neither scenario is particularly realistic, but the outcome is much more likely to be closer to the second scenario rather than the first if we our execution speed is slow, or if we are using a retail platform such as Interactive Brokers or Tradestation, with long latency wait times.  The reason is simple: our orders will always arrive late and join the limit order book at the back of the queue.  In most cases the orders ahead of ours will exhaust demand at the specified limit price and the market will trade away without filling our order.  At other times the market will fill our order whenever there is a large flow against us (i.e. a surge of sell orders into our limit buy), i.e. when there is significant toxic flow. The proposition is that, using ADL and the its high-speed trading infrastructure, we can hope to avoid the latter outcome.  While we will never come close to achieving a 100% fill rate, we may come close enough to offset the inevitable losses from toxic flow and produce a decent return.  Whether ADL is capable of fulfilling that potential remains to be seen.

More on ADL
For more information on ADL go here.

A Calendar Spread Strategy in VIX Futures

I have been working on developing some high frequency spread strategies using Trading Technologies’ Algo Strategy Engine, which is extremely impressive (more on this in a later post).  I decided to take a time out to experiment with a slower version of one of the trades, a calendar spread in VIX futures that trades  the spread on the front two contracts.  The strategy applies a variety of trend-following and mean-reversion indicators to trade the spread on a daily basis.

Modeling a spread strategy on a retail platform like Interactivebrokers or TradeStation is extremely challenging, due to the limitations of the platform and the Easylanguage programming language compared to professional platforms that are built for purpose, like TT’s XTrader and development tools like ADL.  If you backtest strategies based on signals generated from the spread calculated using the last traded prices in the two securities, you will almost certainly see “phantom trades” – trades that could not be executed at the indicated spread price (for example, because both contracts last traded on the same side of the bid/ask spread).   You also can’t easily simulate passive entry or exit strategies, which typically constrains you to using market orders for both legs, in and out of the spread.  On the other hand, while using market orders would almost certainly be prohibitively expensive in a high frequency or daytrading context, in a low-frequency scenario the higher transaction costs entailed in aggressive entries and exits are typically amortized over far longer time frames.

SSALGOTRADING AD

In the following example I have allowed transaction costs of $100 per round turn and slippage of $0.1 (equivalent to $100) per spread.  Daily settlement prices from Mar 2004 to June 2010 were used to fit the model, which was tested out of sample in the period July 2010 to June 2014. Results are summarized in the chart and table below.

Even burdened with significant transaction cost assumptions the strategy performance looks impressive on several counts, notably a profit factor in excess of 300, a win rate of over 90% and a Sortino Ratio of over 6.  These features of the strategy prove robust (and even increase) during the four year out-of-sample period, although the annual net profit per spread declines to around $8,500, from $36,600 for the in-sample period.  Even so, this being a straightforward calendar spread, it should be possible to trade the strategy in size at relative modest margin cost, making the strategy return highly attractive.

Equity Curve

 (click to enlarge)

Performance Results


(click to enlarge)