On Testing Direction Prediction Accuracy


As regards the question of forecasting accuracy discussed in the paper on Forecasting Volatility in the S&P 500 Index, there are two possible misunderstandings here that need to be cleared up.  These arise from remarks by one commentator  as follows:

“An above 50% vol direction forecast looks good,.. but “direction” is biased when working with highly skewed distributions!   ..so it would be nice if you could benchmark it against a simple naive predictors to get a feel for significance, -or- benchmark it with a trading strategy and see how the risk/return performs.”

(i) The first point is simple, but needs saying: the phrase “skewed distributions” in the context of volatility modeling could easily be misconstrued as referring to the volatility skew. This, of course, is used to describe to the higher implied vols seen in the Black-Scholes prices of OTM options. But in the Black-Scholes framework volatility is constant, not stochastic, and the “skew” referred to arises in the distribution of the asset return process, which has heavier tails than the Normal distribution (excess Kurtosis and/or skewness). I realize that this is probably not what the commentator meant, but nonetheless it’s worth heading that possible misunderstanding off at the pass, before we go on.

SSALGOTRADING AD

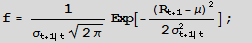
(ii) I assume that the commentator was referring to the skewness in the volatility process, which is characterized by the LogNormal distribution. But the forecasting tests referenced in the paper are tests of the ability of the model to predict the direction of volatility, i.e. the sign of the change in the level of volatility from the current period to the next period. Thus we are looking at, not a LogNormal distribution, but the difference in two LogNormal distributions with equal mean – and this, of course, has an expectation of zero. In other words, the expected level of volatility for the next period is the same as the current period and the expected change in the level of volatility is zero. You can test this very easily for yourself by generating a large number of observations from a LogNormal process, taking the difference and counting the number of positive and negative changes in the level of volatility from one period to the next. You will find, on average, half the time the change of direction is positive and half the time it is negative.

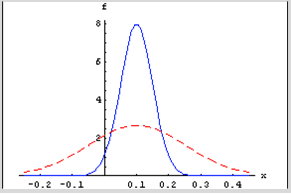
For instance, the following chart shows the distribution of the number of positive changes in the level of a LogNormally distributed random variable with mean and standard deviation of 0.5, for a sample of 1,000 simulations, each of 10,000 observations.  The sample mean (5,000.4) is very close to the expected value of 5,000.

Distribution Number of Positive Direction Changes

So, a naive predictor will forecast volatility to remain unchanged for the next period and by random chance approximately half the time volatility will turn out to be higher and half the time it will turn out to be lower than in the current period. Hence the default probability estimate for a positive change of direction is 50% and you would expect to be right approximately half of the time. In other words, the direction prediction accuracy of the naive predictor is 50%. This, then, is one of the key benchmarks you use to assess the ability of the model to predict market direction. That is what test statistics like Theil’s-U does – measures the performance relative to the naive predictor. The other benchmark we use is the change of direction predicted by the implied volatility of ATM options.
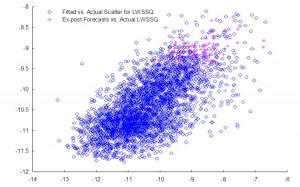
In this context, the model’s 61% or higher direction prediction accuracy is very significant (at the 4% level in fact) and this is reflected in the Theil’s-U statistic of 0.82 (lower is better). By contrast, Theil’s-U for the Implied Volatility forecast is 1.46, meaning that IV is a much worse predictor of 1-period-ahead changes in volatility than the naive predictor.

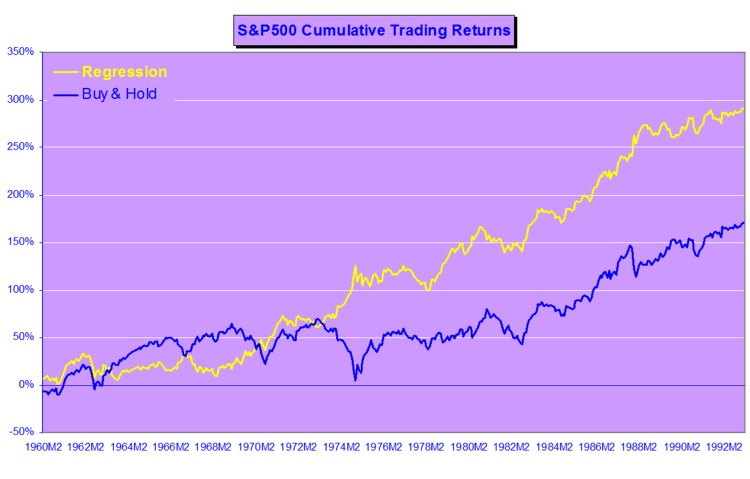
On its face, it is because of this exceptional direction prediction accuracy that a simple strategy is able to generate what appear to be abnormal returns using the change of direction forecasts generated by the model, as described in the paper. In fact, the situation is more complicated than that, once you introduce the concept of a market price of volatility risk.


Market Timing in the S&P 500 Index Using Volatility Forecasts

There has been a good deal of interest in the market timing ideas discussed in my earlier blog post Using Volatility to Predict Market Direction, which discusses the research of Diebold and Christoffersen into the sign predictability induced by volatility dynamics.  The ideas are thoroughly explored in a QuantNotes article from 2006, which you can download here.

There is a follow-up article from 2006 in which Christoffersen, Diebold, Mariano and Tay develop the ideas further to consider the impact of higher moments of the asset return distribution on sign predictability and the potential for market timing in international markets (download here).

Trading Strategy
To illustrate some of the possibilities of this approach, we constructed a simple market timing strategy in which a position was taken in the S&P 500 index or in 90-Day T-Bills, depending on an ex-ante forecast of positive returns from the logit regression model (and using an expanding window to estimate the drift coefficient).  We assume that the position is held for 30 days and rebalanced at the end of each period.  In this test we make no allowance for market impact, or transaction costs.

Results
Annual returns for the strategy and for the benchmark S&P 500 Index are shown in the figure below.  The strategy performs exceptionally well in 1987, 1989 and 1995, when the ratio between expected returns and volatility remains close to optimum levels and the direction of the S&P 500 Index is highly predictable,  Of equal interest is that the strategy largely avoids the market downturn of 2000-2002 altogether, a period in which sign probabilities were exceptionally low.

SSALGOTRADING AD

In terms of overall performance, the model enters the market in 113 out of a total of 241 months (47%) and is profitable in 78 of them (69%).  The average gain is 7.5% vs. an average loss of –4.11% (ratio 1.83).  The compound annual return is 22.63%, with an annual volatility of 17.68%, alpha of 14.9% and Sharpe ratio of 1.10.

The under-performance of the strategy in 2003 is explained by the fact that direction-of-change probabilities were rising from a very low base in Q4 2002 and do not reach trigger levels until the end of the year.  Even though the strategy out-performed the Index by a substantial margin of 6% , the performance in 2005 is of concern as market volatility was very low and probabilities overall were on a par with those seen in 1995.  Further tests are required to determine whether the failure of the strategy to produce an exceptional performance on par with 1995 was the result of normal statistical variation or due to changes in the underlying structure of the process requiring model recalibration.

Future Research & Development
The obvious next step is to develop the approach described above to formulate trading strategies based on sign forecasting in a universe of several assets, possibly trading binary options.  The approach also has potential for asset allocation, portfolio theory and risk management applications.

Market Timing in the S&P500 Index

Forecasting Volatility in the S&P500 Index

Several people have asked me for copies of this research article, which develops a new theoretical framework, the ARFIMA-GARCH model as a basis for forecasting volatility in the S&P 500 Index.  I am in the process of updating the research, but in the meantime a copy of the original paper is available here

In this analysis we are concerned with the issue of whether market forecasts of volatility, as expressed in the Black-Scholes implied volatilities of at-the-money European options on the S&P500 Index, are superior to those produced by a new forecasting model in the GARCH framework which incorporates long-memory effects.  The ARFIMA-GARCH model, which uses high frequency data comprising 5-minute returns, makes volatility the subject process of interest, to which innovations are introduced via a volatility-of-volatility (kurtosis) process.  Despite performing robustly in- and out-of-sample, an encompassing regression indicates that the model is unable to add to the information already contained in market forecasts.  However, unlike model forecasts, implied volatility forecasts show evidence of a consistent and substantial bias.  Furthermore, the model is able to correctly predict the direction of volatility approximately 62% of the time whereas market forecasts have very poor direction prediction ability.  This suggests that either option markets may be inefficient, or that the option pricing model is mis-specified.  To examine this hypothesis, an empirical test is carried out in which at-the-money straddles are bought or sold (and delta-hedged) depending on whether the model forecasts exceed or fall below implied volatility forecasts.  This simple strategy generates an annual compound return of 18.64% over a four year out-of-sample period, during which the annual return on the S&P index itself was -7.24%.  Our findings suggest that, over the period of analysis, investors required an additional risk premium of 88 basis points of incremental return for each unit of volatility risk.

Using Volatility to Predict Market Direction

Decomposing Asset Returns


We can decompose the returns process Rt as follows:

While the left hand side of the equation is essentially unforecastable, both of the right-hand-side components of returns display persistent dynamics and hence are forecastable. Both the signs of returns and magnitude of returns are conditional mean dependent and hence forecastable, but their product is conditional mean independent and hence unforecastable. This is an example of a nonlinear “common feature” in the sense of Engle and Kozicki (1993).

Although asset returns are essentially unforecastable, the same is not true for asset return signs (i.e. the direction-of-change). As long as expected returns are nonzero, one should expect sign dependence, given the overwhelming evidence of volatility dependence. Even in assets where expected returns are zero, sign dependence may be induced by skewness in the asset returns process.  Hence market timing ability is a very real possibility, depending on the relationship between the mean of the asset returns process and its higher moments. The highly nonlinear nature of the relationship means that conditional sign dependence is not likely to be found by traditional measures such as signs autocorrelations, runs tests or traditional market timing tests. Sign dependence is likely to be strongest at intermediate horizons of 1-3 months, and unlikely to be important at very low or high frequencies. Empirical tests demonstrate that sign dependence is very much present in actual US equity returns, with probabilities of positive returns rising to 65% or higher at various points over the last 20 years. A simple logit regression model captures the essentials of the relationship very successfully.

Now consider the implications of dependence and hence forecastability in the sign of asset returns, or, equivalently, the direction-of-change. It may be possible to develop profitable trading strategies if one can successfully time the market, regardless of whether or not one is able to forecast the returns themselves.  

There is substantial evidence that sign forecasting can often be done successfully. Relevant research on this topic includes Breen, Glosten and Jaganathan (1989), Leitch and Tanner (1991), Wagner, Shellans and Paul (1992), Pesaran and Timmerman (1995), Kuan and Liu (1995), Larsen and Wozniak (10050, Womack (1996), Gencay (1998), Leung Daouk and Chen (1999), Elliott and Ito (1999) White (2000), Pesaran and Timmerman (2000), and Cheung, Chinn and Pascual (2003).

There is also a huge body of empirical research pointing to the conditional dependence and forecastability of asset volatility. Bollerslev, Chou and Kramer (1992) review evidence in the GARCH framework, Ghysels, Harvey and Renault (1996) survey results from stochastic volatility modeling, while Andersen, Bollerslev and Diebold (2003) survey results from realized volatility modeling.

Sign Dynamics Driven By Volatility Dynamics

Let the returns process Rt be Normally distributed with mean m and conditional volatility st.

The probability of a positive return Pr[Rt+1 >0] is given by the Normal CDF F=1-Prob[0,f]


For a given mean return, m, the probability of a positive return is a function of conditional volatility st. As the conditional volatility increases, the probability of a positive return falls, as illustrated in Figure 1 below with m = 10% and st = 5% and 15%.

In the former case, the probability of a positive return is greater because more of the probability mass lies to the right of the origin. Despite having the same, constant expected return of 10%, the process has a greater chance of generating a positive return in the first case than in the second. Thus volatility dynamics drive sign dynamics.  

 Figure 1

Email me at jkinlay@investment-analytics.com.com for a copy of the complete article.