

The use of correlations is widespread in investment management theory and practice, from the construction of portfolios to the design of hedge trades to statistical arbitrage strategies.
A common difficulty encountered in all of these applications is the variation in correlation: assets that at one time appear to be suitably uncorrelated for hedging purposes, may become much more highly correlated at other times, such as periods of market stress. Conversely, stocks that appear suitable for pairs trading due to the high correlation in their prices or returns, may de-couple at a later time, causing significant losses.
The instability in the level of correlation is further aggravated by the empirical finding that the volatility in correlation is itself time-dependent: at times the correlations between assets may appear to fluctuate smoothly within a tight range; at other times we might see several fluctuations in the sign of the correlation coefficient over the course of a few days.
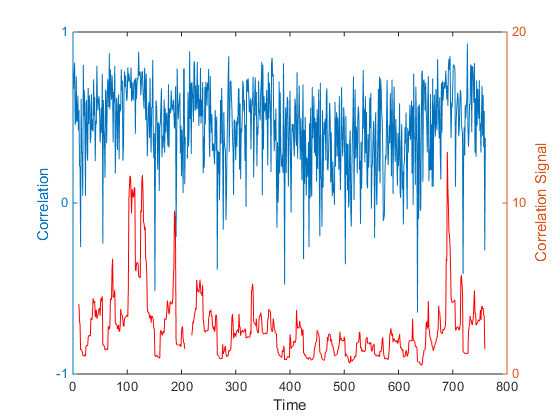
One tool I have found useful in this context is a concept I refer to as the correlation signal, defined at the average correlation divided by the standard deviation of the correlation coefficient. The chart below illustrates a typical pattern for a pair of Oil and Gas industry stocks. The blue line is the average daily correlation between the stocks, measured at 5-minute intervals. The red line is the correlation signal – the average daily correlation divided by the standard deviation in the intra-day correlation. The stochastic nature of both the correlation coefficient and the correlation signal is quite evident. Note that the correlation signal, unlike the coefficient, is not constrained within the limits of +/- 1. At times when the variation in correlation is low the signal an easily exceed those limits by as much as an order of magnitude.
In later posts I will illustrate the usefulness of the correlation signal in portfolio construction and statistical arbitrage. For now, let me just say that it is a measure of the strength of the correlation as a signal, relative to the noise of random variation in the correlation process. It can be used to identify situations in which a relationship – whether a positive or negative correlation – appears to be stable or unstable, and therefore viable as a basis for inference, or not.