I have been working on a higher frequency version of the eMini S&P 500 futures strategy, based on 3-minute bar intervals, which is designed to trade a couple of times a week, with hold periods of 2-3 days. Even higher frequency strategies are possible, of course, but my estimation is that a hold period of under a week provides the best combination of liquidity and capacity. Furthermore, the strategy is of low enough frequency that it is not at all latency sensitive – indeed, in the performance analysis below I have assumed that the market must trade through the limit price before the system enters a trade (relaxing the assumption and allowing the system to trade when the market touches the limit price improves the performance).
The other important design criteria are the high % of profitable trades and Kelly f (both over 95%). This enables the investor to employ money management techniques, such a fixed-fractional allocation for example, in order to scale the trade size up from 1 to 10 contracts, without too great a risk of a major drawdown in realized P&L.
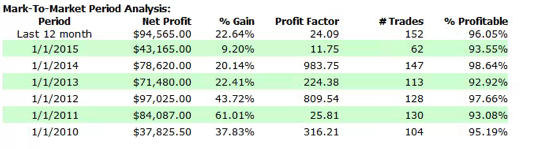
The end result is a strategy that produces profits of $80,000 to $100,000 a year on a 10 contract position, with an annual rate of return of 30% and a Sharpe ratio in excess of 2.0.
Furthermore, of the 682 trades since Jan 2010, only 29 have been losers.
Annual P&L (out of sample)
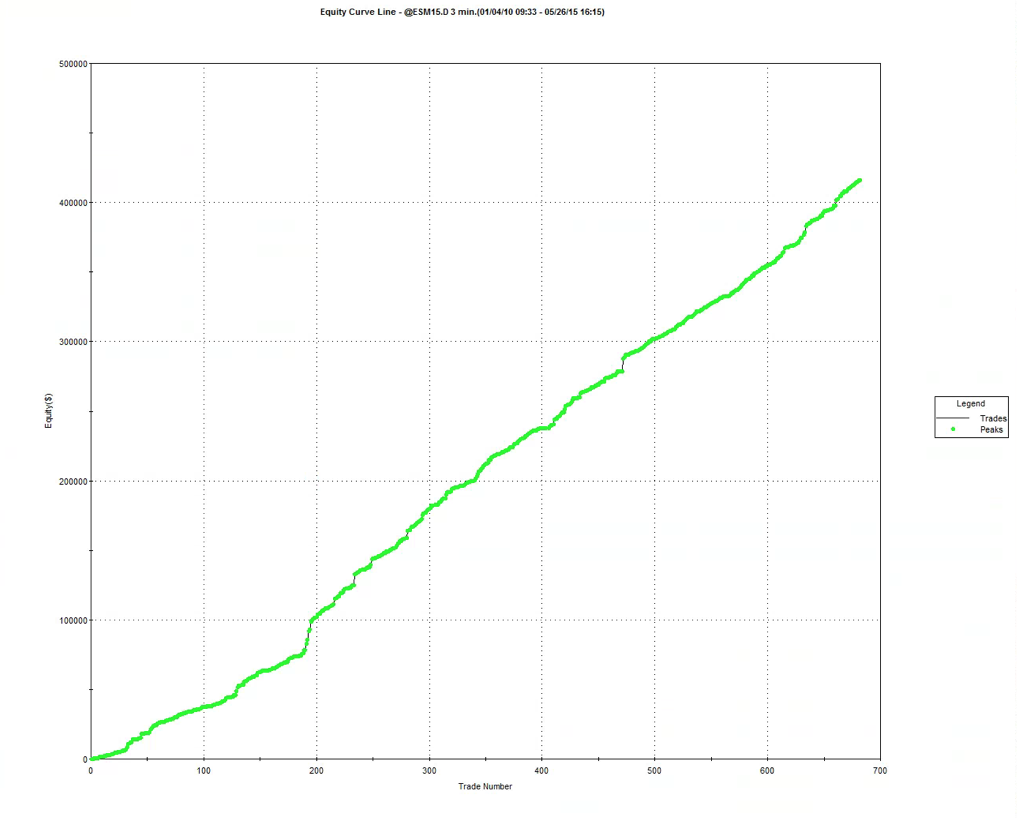
Equity Curve
Strategy Performance

What’s the Downside?
Everything comes at a price, of course. Firstly, the strategy is long-only and, by definition, will perform poorly in falling markets, such as we saw in 2008. That’s a defensible investment thesis, of course – how many $billions are invested in buy and hold strategies? – and, besides, as one commentator remarked, the trick is to develop multiple strategies for different market regimes (although, sensible as that sounds, one is left with the difficulty of correctly identifying the market regime).
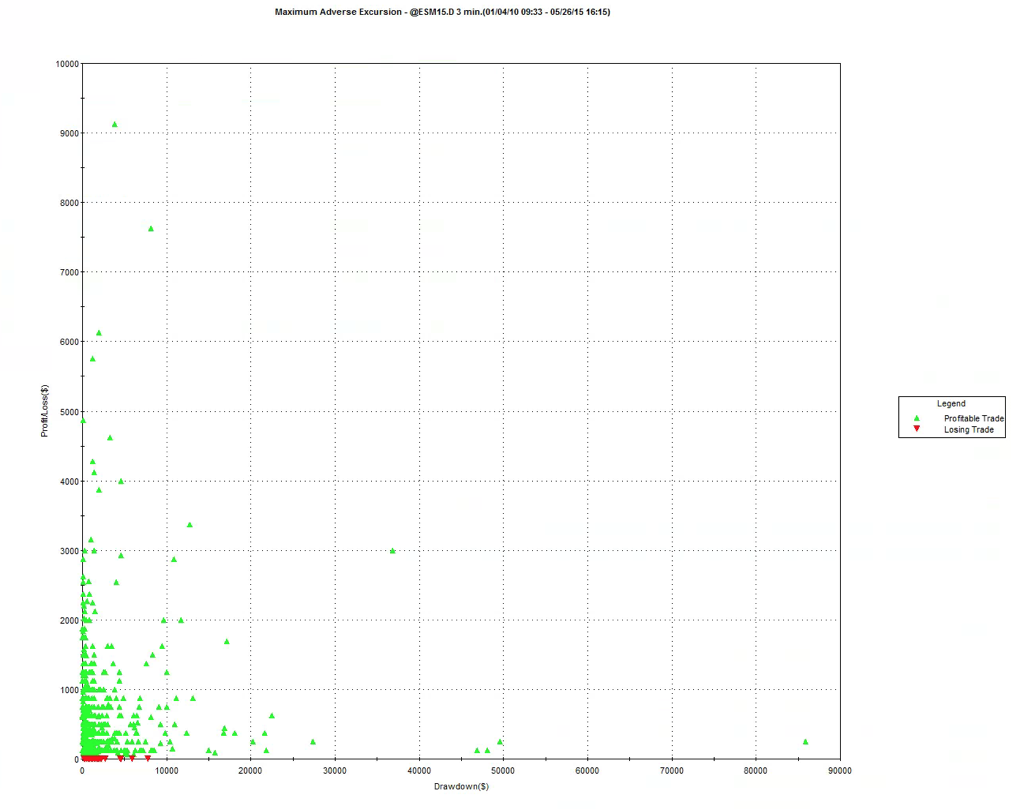
The second drawback is revealed by the trade chart below, which plots the drawdown experienced during each trade. The great majority of these drawdowns are unrealized, and in most cases the trade recovers to make a profit. However, there are some very severe cases, such as Sept 2014, when the strategy experienced a drawdown of $85,000 before recovering to make a profit on the trade. For most investors, the agony of risking an entire year’s P&L just to make a few hundred dollars would be too great.

It should be pointed out that the by the time the drawdown event took place the strategy had already produced many hundreds of thousands of dollars of profit. So, one could take the view that by that stage the strategy was playing with “house money” and could well afford to take such a risk.
One obvious “solution” to the drawdown problem is to use some kind of stop loss. Unfortunately, the effect is simply to convert an unrealized drawdown into a realized loss. For some, however, it might be preferable to take a hit of $40,000 or $50,000 once every few years, rather than suffer the uncertainty of an even larger potential loss. Either way, despite its many pleasant characteristics, this is not a strategy for investors with weak stomachs!