The Hedged Volatility Strategy

Being short regular Volatility ETFs or long Inverse Volatility ETFs are winning strategies…most of the time. The challenge is that when the VIX spikes or when the VIX futures curve is downward sloping instead of upward sloping, very significant losses can occur. Many people have built and back-tested models that attempt to move from long to short to neutral positions in the various Volatility ETFs, but almost all of them have one or both of these very significant flaws: 1) Failure to use “out of sample” back-testing and 2) Failure to protect against “black swan” events.

In this strategy a position and weighting in the appropriate Volatility ETFs are established based on a multi-factor model which always uses out of sample back-testing to determine effectiveness. Volatility Options are always used to protect against significant short-term moves which left unchecked could result in the total loss of one’s portfolio value; these options will usually lose money, but that is a small price to pay for the protection they provide. (Strategies should be scaled at a minimum of 20% to ensure options protection.)

This is a good strategy for IRA accounts in which short selling is not allowed. Long positions in Inverse Volatility ETFs are typically held. Suggested minimum capital: $26,000 (using 20% scaling).

The F/X Momentum Strategy

Our approach is based upon the idea that currencies tend to be range bound, that momentum ultimately exhausts itself and that prices tend to fall faster than they rise. The strategy seeks to exploit these characteristics with short trades that may be closed within a few hours, or continue over several days when the exhaustion pattern emerges more slowly.
FXMomentum Aug 20 2018

A Meta-Strategy in S&P 500 E-Mini Futures

In earlier posts I have described the idea of a meta-strategy as a strategies that trades strategies.  It is an algorithm, or set of rules, that is used to decide when to trade an underlying strategy.  In some cases a meta-strategy may influence the size in which the underlying strategy is traded, or may even amend the base code.  In other word, a meta-strategy actively “trades” an underlying strategy, or group of strategies, much as in the same way a regular strategy may actively trade stocks, going long or short from time to time.  One distinction is that a meta-strategy will rarely, if ever, actually “short” an underlying strategy – at most it will simply turn the strategy off (reduce the position size to zero) for a period.

For a more detailed description, see this post:

Improving Trading System Performance Using a Meta-Strategy

In this post I look at a meta-strategy that developed for a client’s strategy in S&P E-Mini futures.  What is extraordinary is that the underlying strategy was so badly designed (not by me!) and performs so poorly that no rational systematic trader would likely give it  a second look –  instead he would toss it into the large heap of failed ideas that all quantitative researchers accumulate over the course of their careers.  So this is a textbook example that illustrates the power of meta-strategies to improve, or in this case transform, the performance of an underlying strategy.

1. The Strategy

The Target Trader Strategy (“TTS”) is a futures strategy applied to S&P 500 E-Mini futures that produces a very high win rate, but which occasionally experiences very large losses. The purpose of the analysis if to find methods that will:

1) Decrease the max loss / drawdown
2) Increase the win rate / profitability

For longs the standard setting is entry 40 ticks below the target, stop loss 1000 ticks below the target, and then 2 re-entries 100 ticks below entry 1 and 100 ticks below entry 2

For shorts the standard is entry 80 ticks above the target. stop loss 1000 ticks above the target, and then 2 re-entries 100 ticks above entry 1 and 100 ticks above entry 2

For both directions its 80 ticks above/below for entry 1, 1000 tick stop, and then 1 re entry 100 ticks above/below, and then re-entry 2 100 ticks above/below entry 2


2. Strategy Performance

2.1 Overall Performance

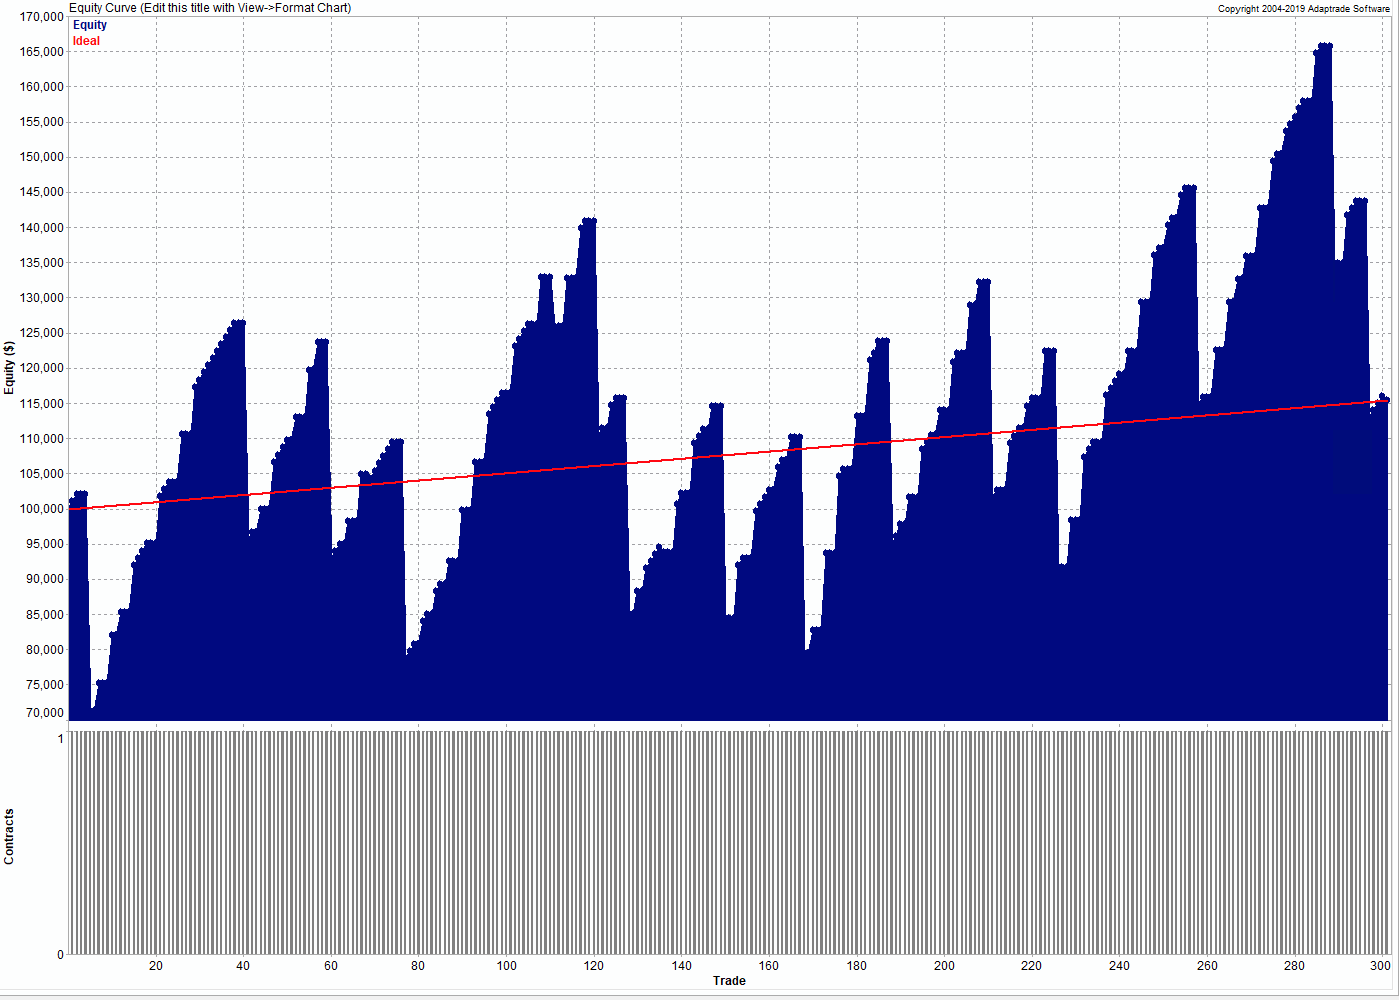
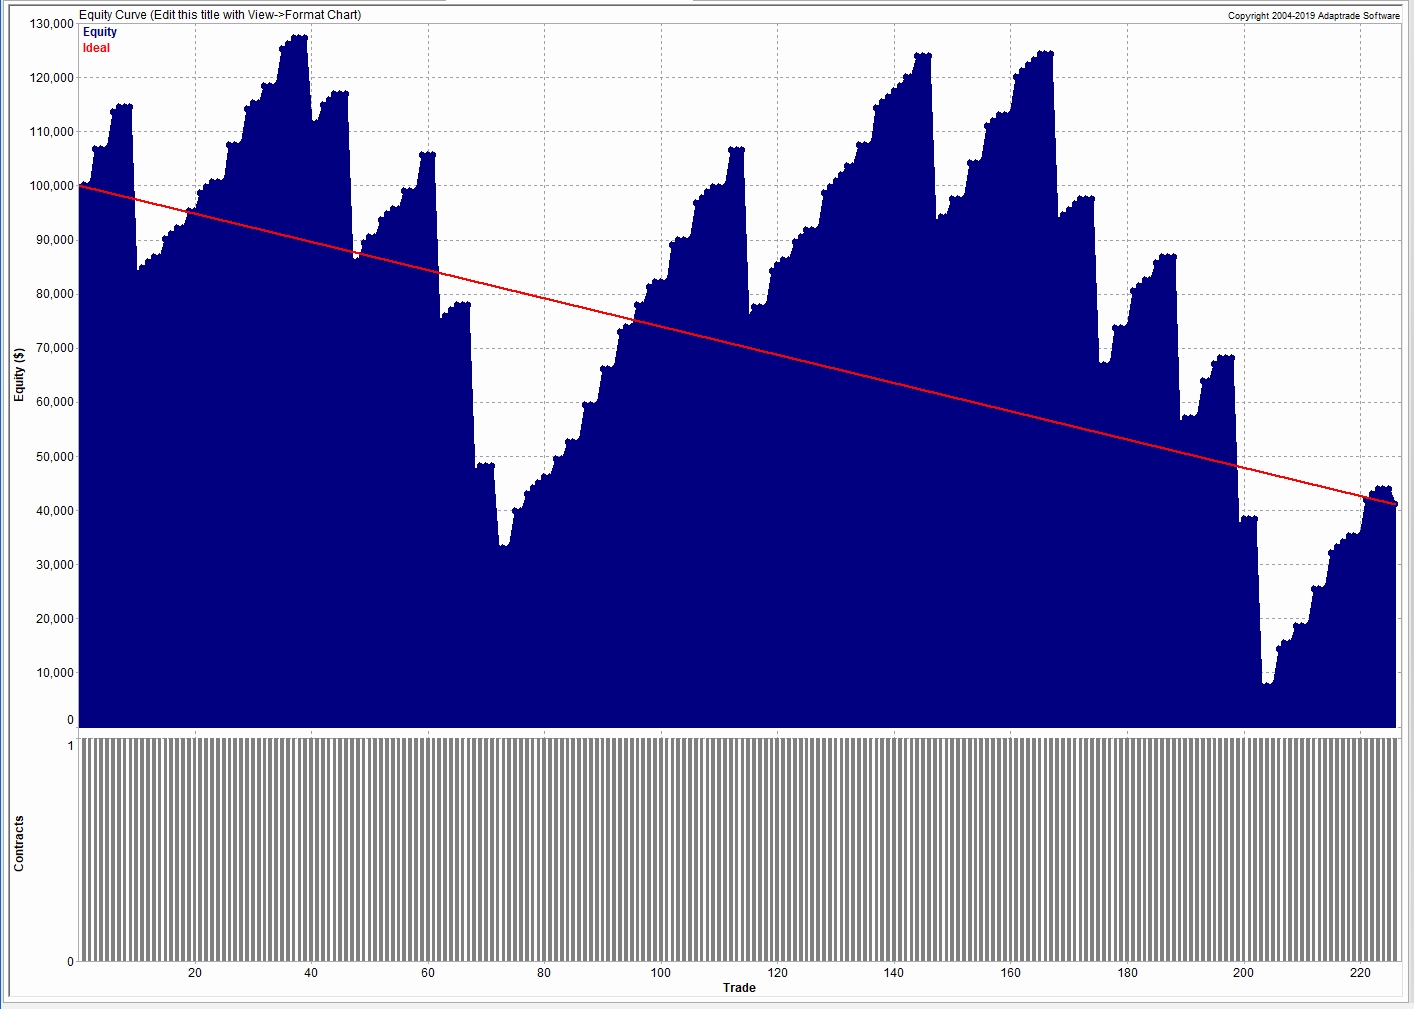
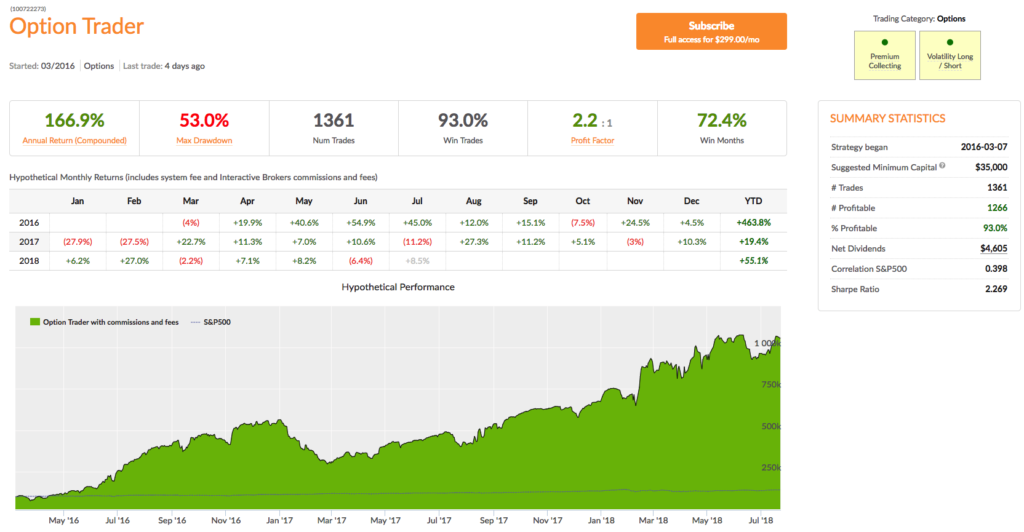
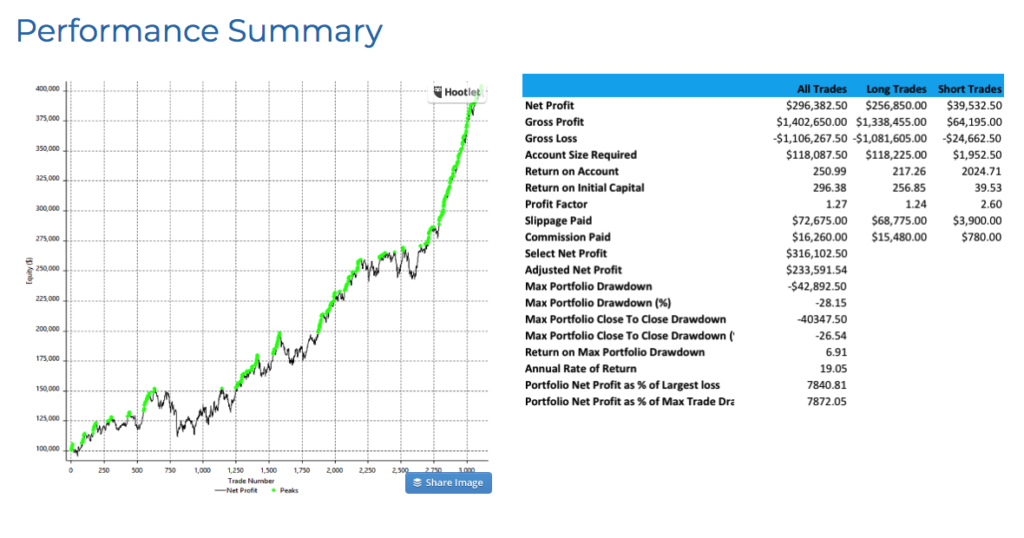
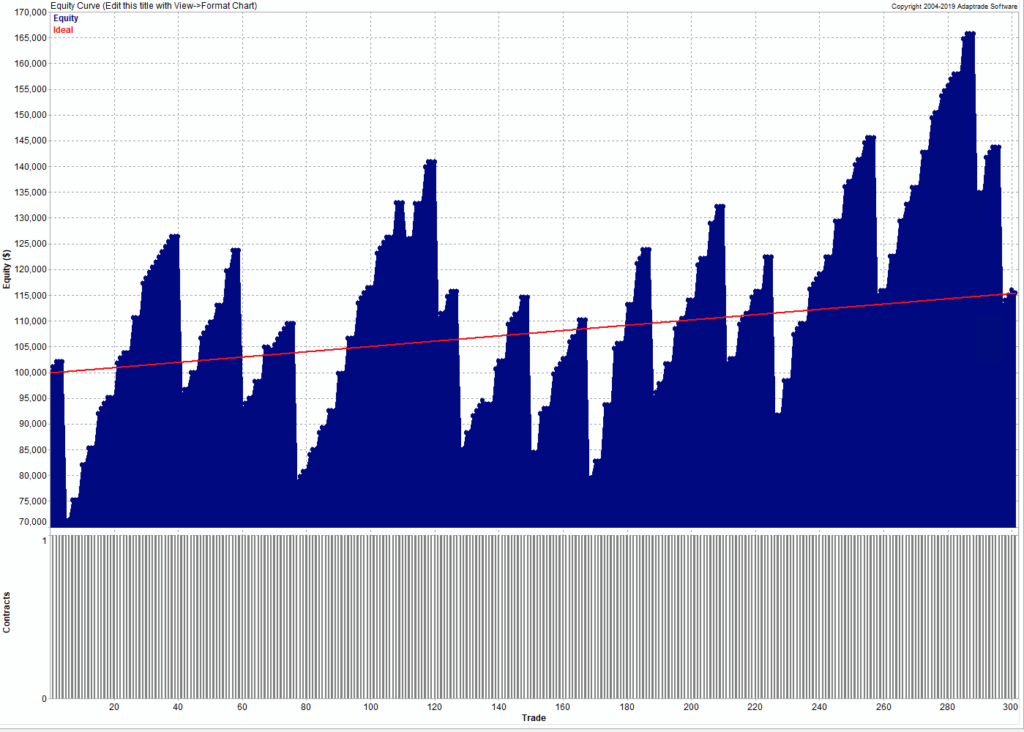
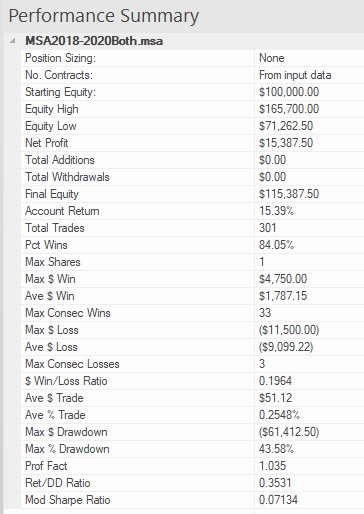
The overall performance of the strategy over the period from 2018 to 2020 is summarized in the chart of the strategy equity curve and table of performance statistics below.
These confirm that, while the win rate if very high (over 84%) there strategy experiences many significant drawdowns, including a drawdown of -$61,412.50 (-43.58%). The total return is of the order of 5% per year, the strategy profit factor is fractionally above 1 and the Sharpe Ratio is negligibly small. Many traders would consider the performance to be highly unattractive.


2.2 Long Trades

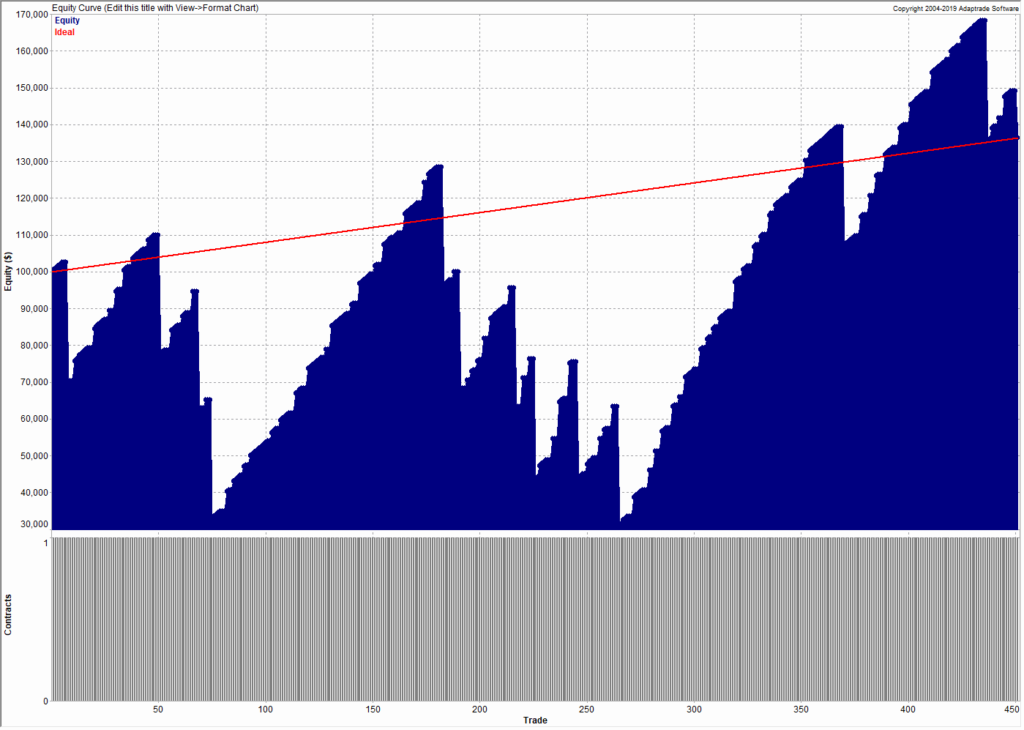
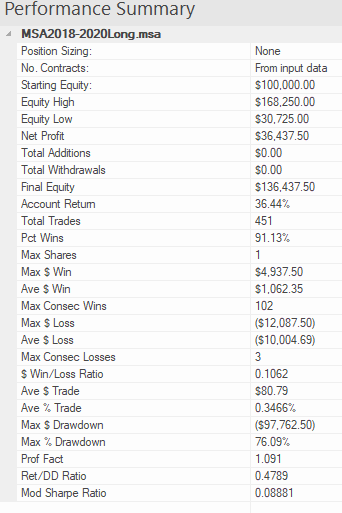
We break the strategy performance down into long and short trades, and consider them separately. On the long side, the strategy has been profitable, producing a gain of over 36% during the period 2018-2020. It also suffered catastrophic drawdown of over -$97,000 during that period:
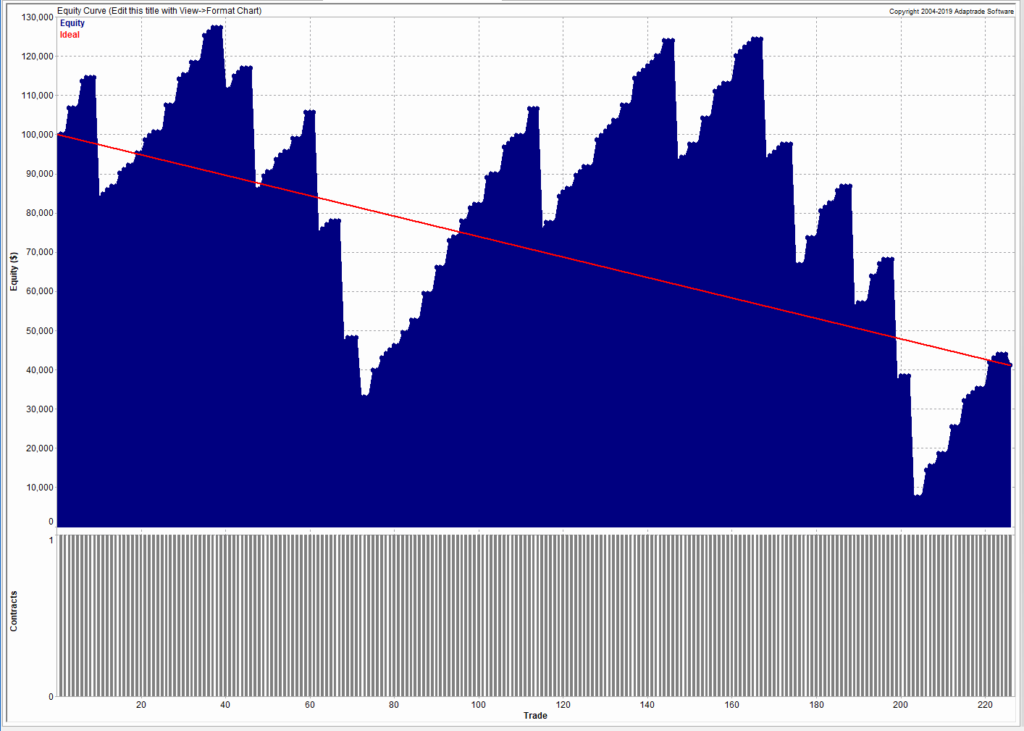
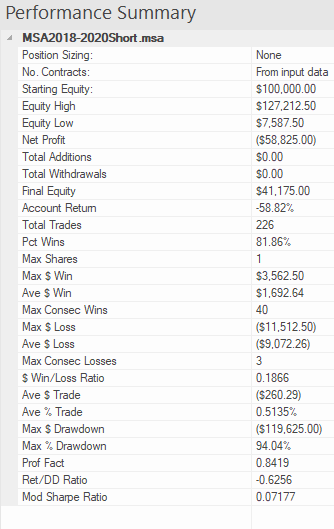


2.3 Short Trades

On the short side, the story is even worse, producing an overall loss of nearly -$59,000:


3. Improving Strategy Performance with a Meta-Strategy

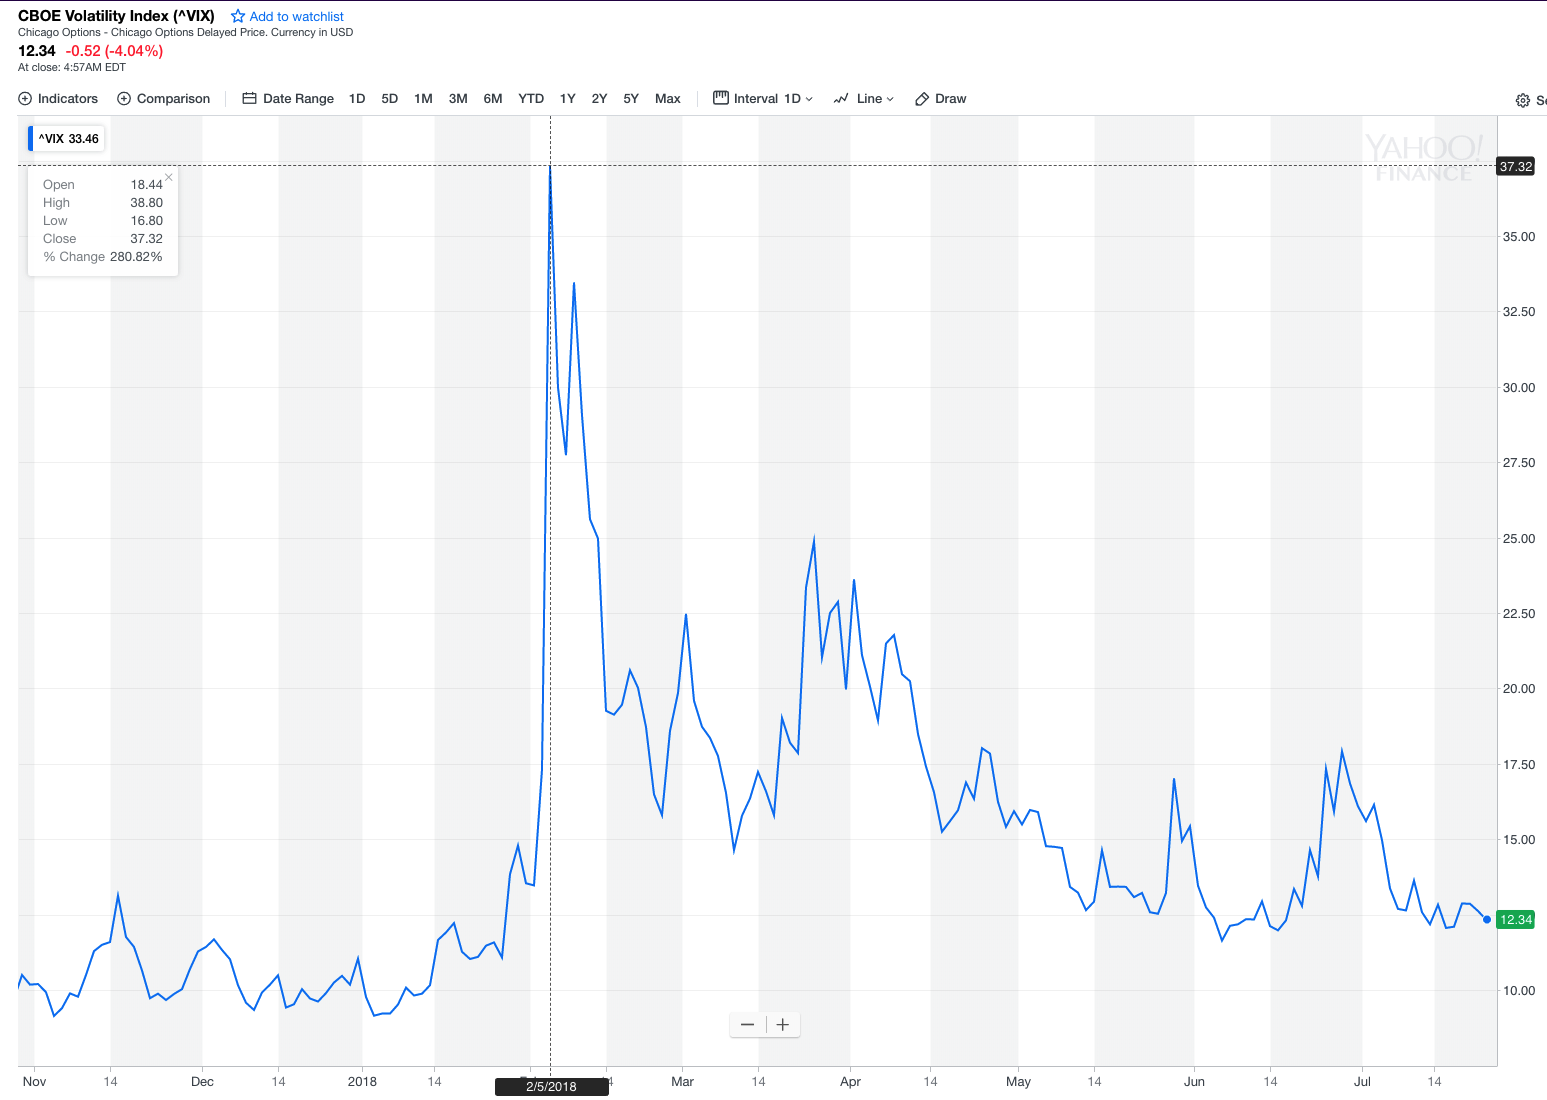
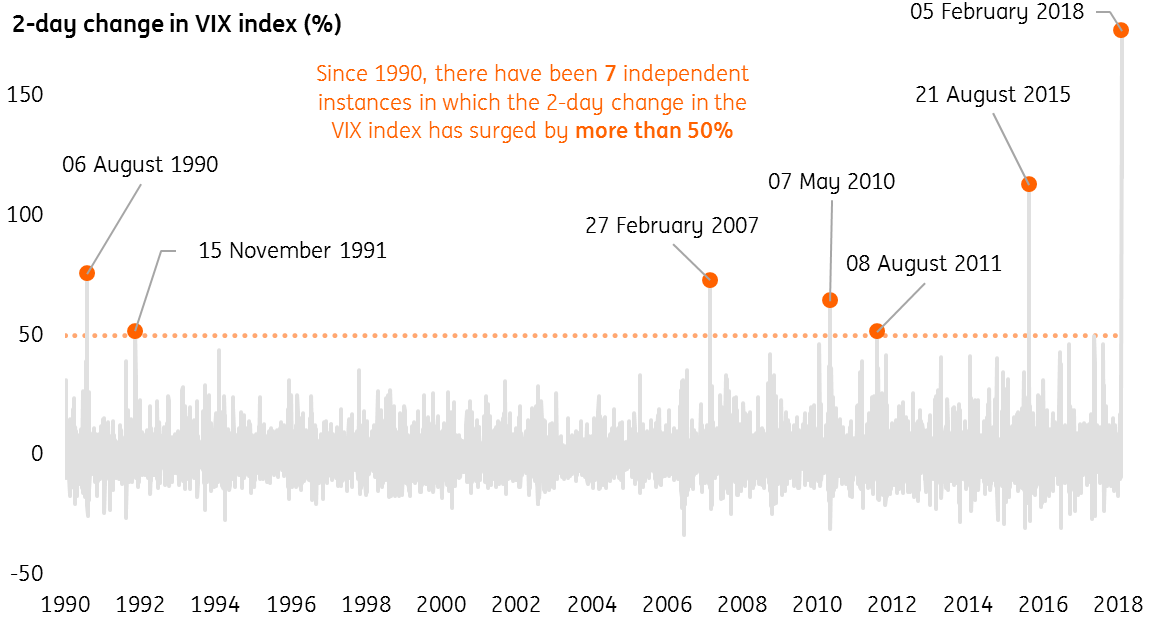
We considered two possible methods to improve strategy performance. The first method attempts to apply technical indicators and other data series to improve trading performance. Here we evaluated price series such as the VIX index and a wide selection of technical indicators, including RSI, ADX, Moving Averages, MACD, ATR and others. However, any improvement in strategy performance proved to be temporary in nature and highly variable, in many cases amplifying the problems with the strategy performance rather than improving them.

The second approach proved much more effective, however. In this method we create a meta-strategy which effectively “trades the strategy”, turning it on and off depending on its recent performance. The meta-strategy consists of a set of rules that determines whether or not to continue trading the strategy after a series of wins or losses. In some cases the meta-strategy may increase the trade size for a sequence of trades, at times when it considers the conditions for the underlying strategy to be favorable.

The result of applying the meta-strategy are described in the following sections.

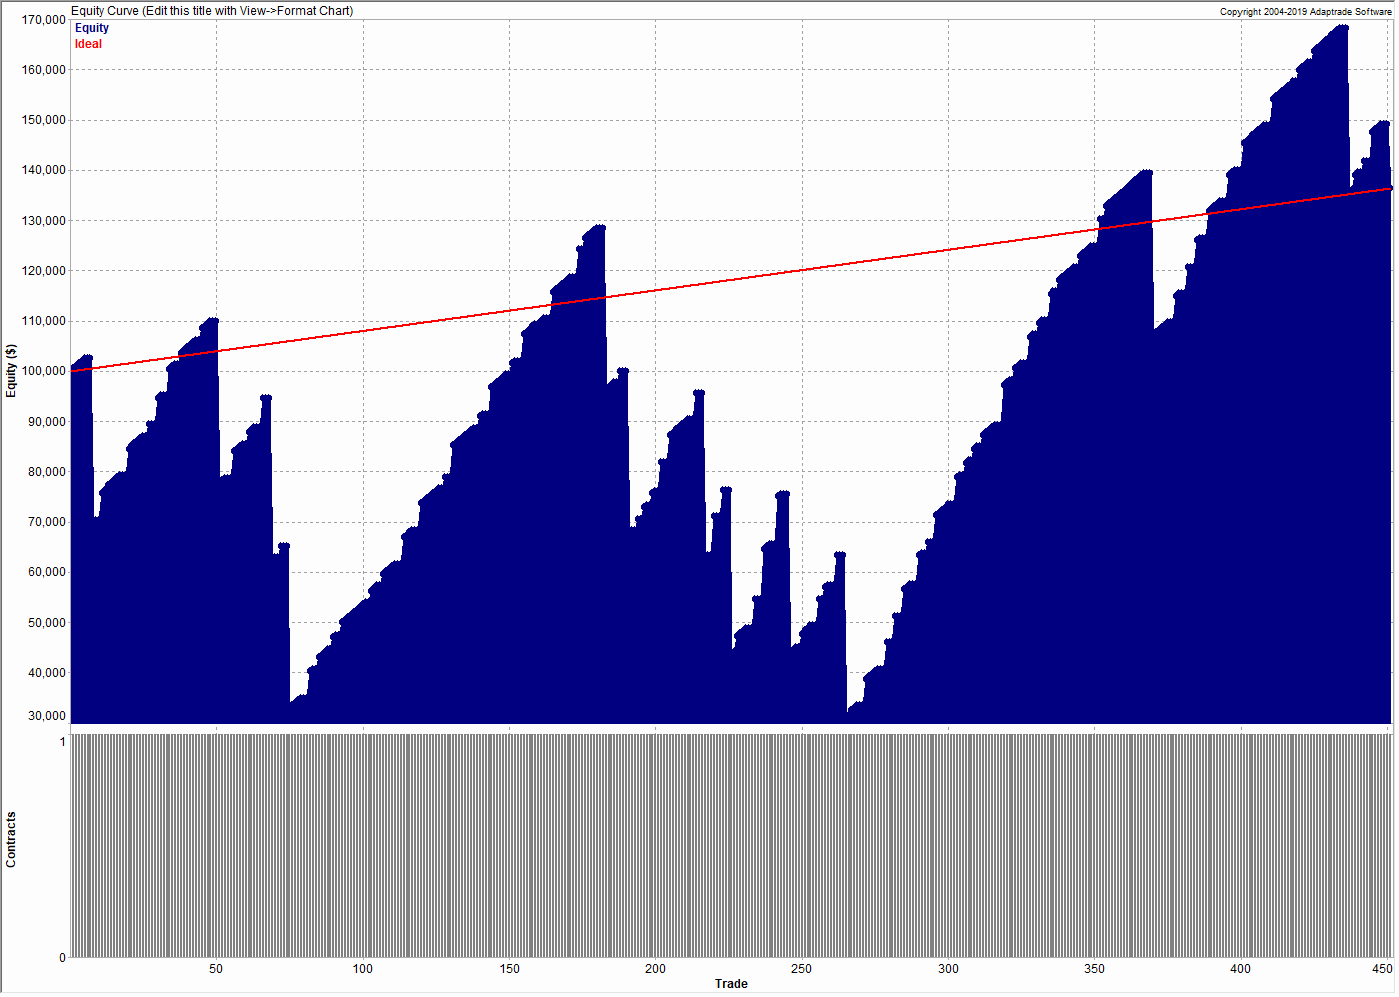
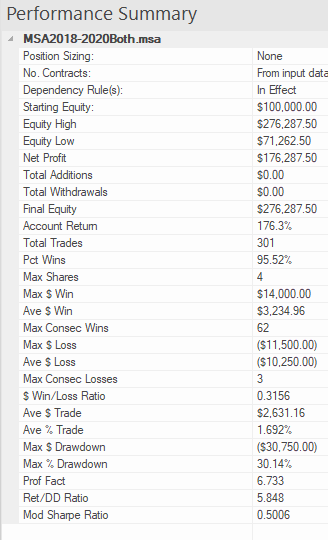
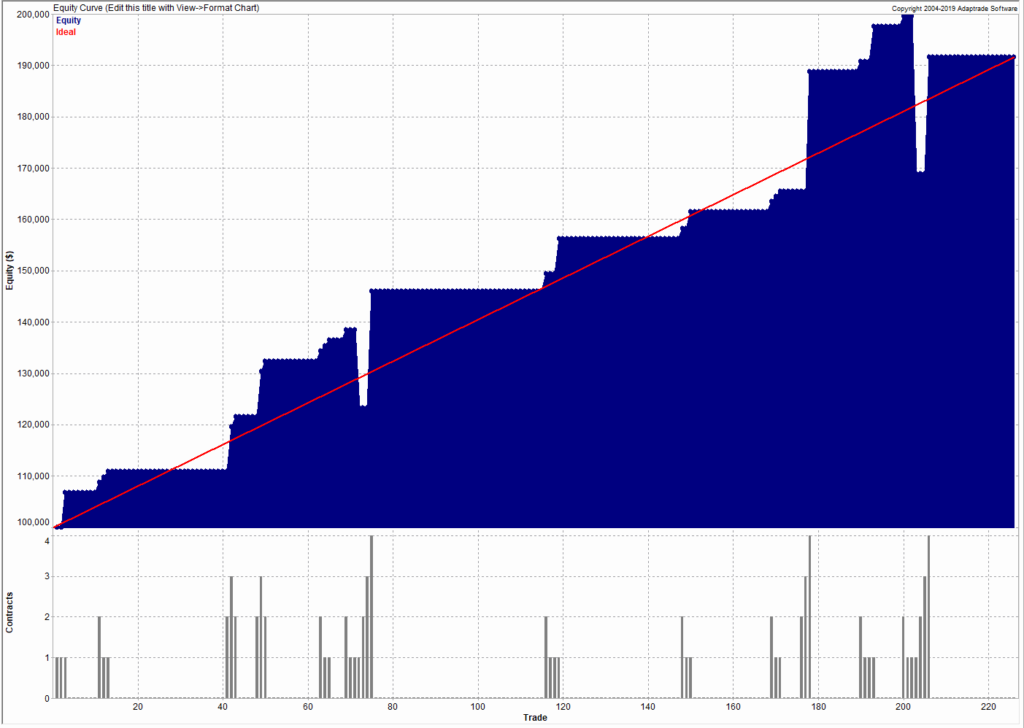
3.1 Long & Short Strategies with Meta-Strategy Overlay

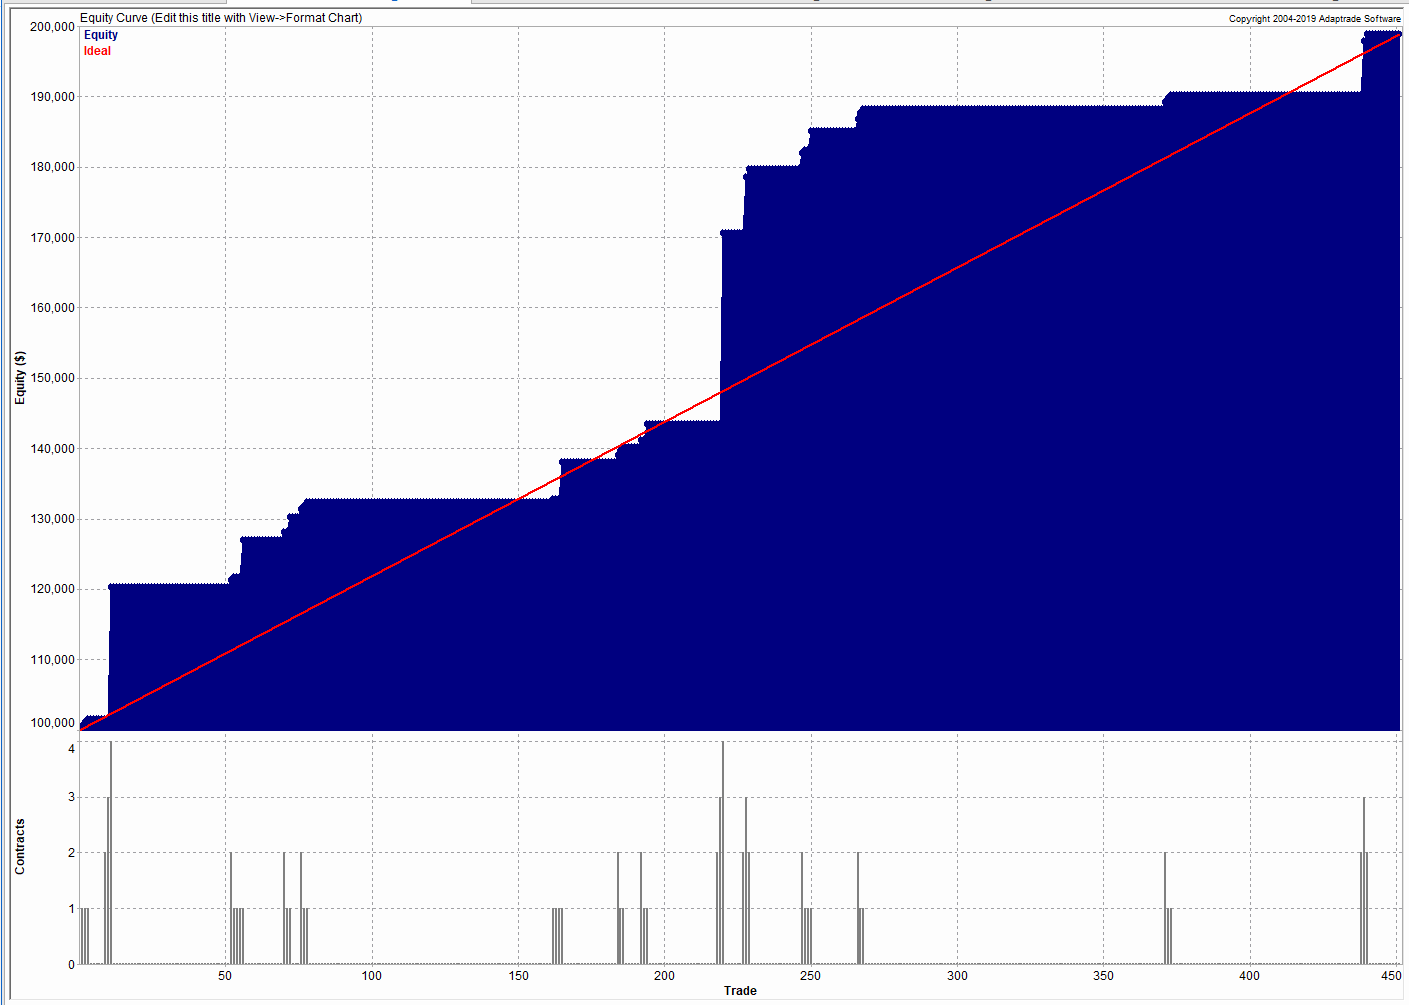
The performance of the long/short strategies combined with the meta-strategy overlay are set out in the chart and table below.
The overall improvements can be summarized as follows:

  • Net profit increases from $15,387 to $176,287
  • Account return rises from 15% to 176%
  • Percentage win rate rises from 84% to 95%
  • Profit factor increases from 1.0 to 6.7
  • Average trade rises from $51 to $2,631
  • Max $ Drawdown falls from -$61,412 to -$30,750
  • Return/Max Drawdown ratio rises from 0.35 to 5.85
  •  The modified Sharpe ratio increases from 0.07 to 0.5

Taken together, these are dramatic improvements to every important aspect of strategy performance.

There are two key rules in the meta-strategy, applicable to winning and losing trades:

Rule for winning trades:
After 3 wins in a row, skip the next trade.

Rule for losing trades:
After 3 losses in a row, add 1 contract until the first win. Subtract 1 contract after each win until the next loss, or back to 1 contract.


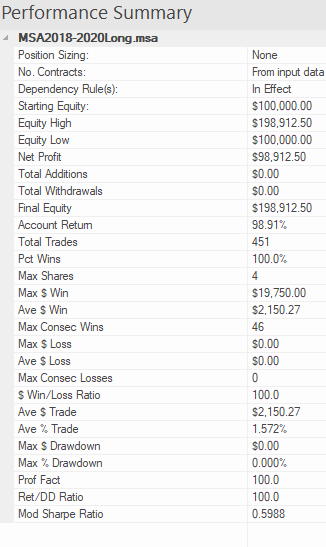
3.2 Long Trades with Meta-Strategy

The meta-strategy rules produce significant improvements in the performance of both the long and short components of the strategy. On the long side the percentage win rate is increased to 100% and the max % drawdown is reduced to 0%:


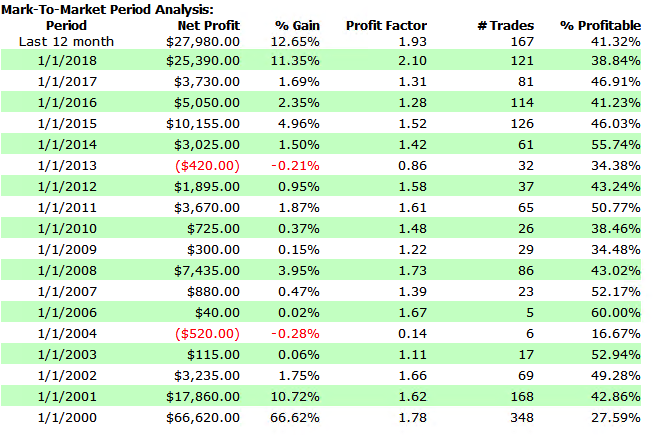
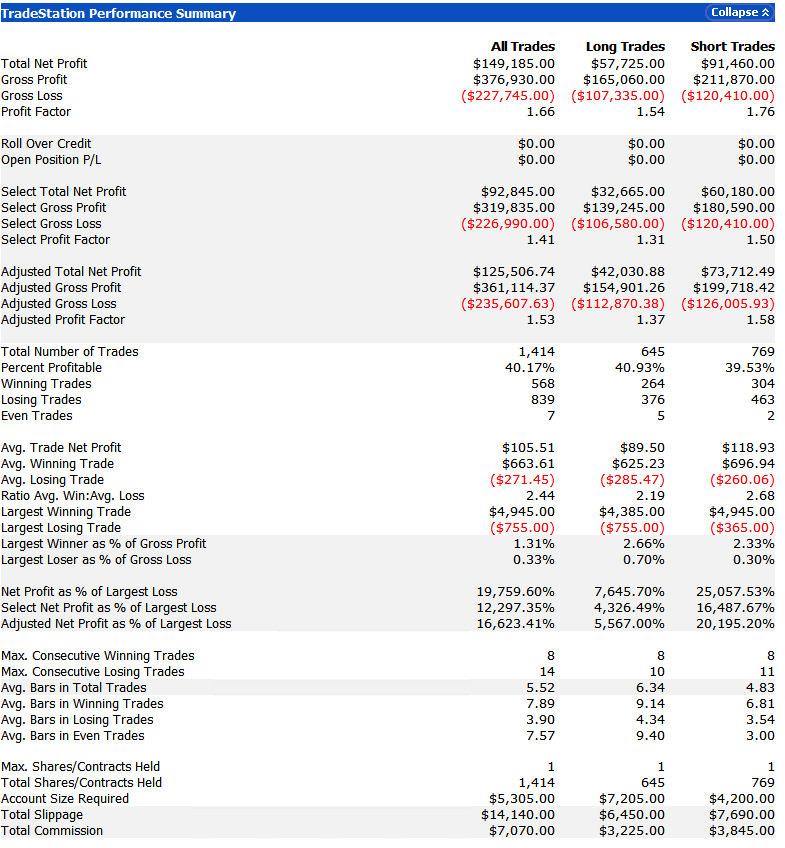
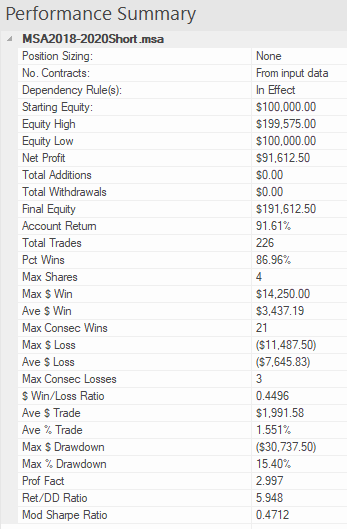
3.3 Short Trades with Meta-Strategy

Improvements to the strategy on the short side are even more significant, transforming a loss of -$59,000 into a profit of $91,600:


4. Conclusion

A meta-strategy is a simple, yet powerful technique that can transform the performance of an underlying strategy.  The rules are often simple, although they can be challenging to implement.  Meta strategies can be applied to almost any underlying strategy, whether in futures, equities, or forex. Worthwhile improvements in strategy performance are often achievable, although not often as spectacular as in this case.

If any reader is interested in designing a meta-strategy for their own use, please get in contact.

Career Opportunity for Quant Traders

Career Opportunity for Quant Traders as Strategy Managers

We are looking for 3-4 traders (or trading teams) to showcase as Strategy Managers on our Algorithmic Trading Platform.  Ideally these would be systematic quant traders, since that is the focus of our fund (although they don’t have to be).  So far the platform offers a total of 10 strategies in equities, options, futures and f/x.  Five of these are run by external Strategy Managers and five are run internally.

The goal is to help Strategy Managers build a track record and gain traction with a potential audience of over 100,000 members.  After a period of 6-12 months we will offer successful managers a position as a PM at Systematic Strategies and offer their strategies in our quantitative hedge fund.  Alternatively, we will assist the manager is raising external capital in order to establish their own fund.

If you are interested in the possibility (or know a talented rising star who might be), details are given below.

Manager Platform

Daytrading Index Futures Arbitrage

Trading with Indices

I have always been an advocate of incorporating index data into one’s trading strategies.  Since they are not tradable, the “market” in index products if often highly inefficient and displays easily identifiable patterns that can be exploited by a trader, or a trading system.  In fact, it is almost trivially easy to design “profitable” index trading systems and I gave a couple of examples in the post below, including a system producing stellar results in the S&P 500 Index.


http://jonathankinlay.com/2016/05/trading-with-indices/

Of course such systems are not directly useful.  But traders often use signals from such a system as a filter for an actual trading system.  So, for example, one might look for a correlated signal in the S&P 500 index as a means of filtering trades in the E-Mini futures market or theSPDR S&P 500 ETF (SPY).

Multi-Strategy Trading Systems

This is often as far as traders will take the idea, since it quickly gets a lot more complicated and challenging to build signals generated from an index series into the logic of a strategy designed for related, tradable market. And for that reason, there is a great deal of unexplored potential in using index data in this way.  So, for instance, in the post below I discuss a swing trading system in the S&P500 E-mini futures (ticker: ES) that comprises several sub-systems build on prime-valued time intervals.  This has the benefit of minimizing the overlap between signals from multiple sub-systems, thereby increasing temporal diversification.

http://jonathankinlay.com/2018/07/trading-prime-market-cycles/

A critical point about this system is that each of sub-systems trades the futures market based on data from both the E-mini contract and the S&P 500 cash index.  A signal is generated when the system finds particular types of discrepancy between the cash index and corresponding futures, in a quasi risk-arbitrage.

SSALGOTRADING AD

Arbing the NASDAQ 100 Index Futures

Developing trading systems for the S&P500 E-mini futures market is not that hard.  A much tougher challenge, at least in my experience, is presented by the E-mini NASDAQ-100 futures (ticker: NQ).  This is partly to do with the much smaller tick size and different market microstructure of the NASDAQ futures market. Additionally, the upward drift in equity related products typically favors strategies that are long-only.  Where a system trades both long and short sides of the market, the performance on the latter is usually much inferior.  This can mean that the strategy performs poorly in bear markets such as 2008/09 and, for the tech sector especially, the crash of 2000/2001.  Our goal was to develop a daytrading system that might trade 1-2 times a week, and which would perform as well or better on short trades as on the long side.  This is where NASDAQ 100 index data proved to be especially helpful.  We found that discrepancies between the cash index and futures market gave particularly powerful signals when markets seemed likely to decline.  Using this we were able to create a system that performed exceptionally well during the most challenging market conditions. It is notable that, in the performance results below (for a single futures contract, net of commissions and slippage), short trades contributed the greater proportion of total profits, with a higher overall profit factor and average trade size.

EC

Annual PL

PL

Conclusion: Using Index Data, Or Other Correlated Signals, Often Improves Performance

It is well worthwhile investigating how non-tradable index data can be used in a trading strategy, either as a qualifying signal or, more directly, within the logic of the algorithm itself.  The greater challenge of building such systems means that there are opportunities to be found, even in well-mined areas like index futures markets.  A parallel idea that likewise offers plentiful opportunity is in designing systems that make use of data on multiple time frames, and in correlated markets, for instance in the energy sector.Here one can identify situations in which, under certain conditions, one market has a tendency to lead another, a phenomenon referred to as Granger Causality.


Riders on the Storm

The Worst Volatility Scare for Years

February 2018 was an insane month for stocks, wrote CNN:

A profound inflation scare. Not one but two 1,000-point plunges for the Dow. And a powerful comeback that almost went straight back up.

The CNN story-line continues:

The Dow plummeted more than 3,200 points, or 12%, in just two weeks. Then stocks raced back to life, at one point recovering about three-quarters of those losses.

Fittingly, February ended with more drama. The Dow tumbled 680 points during the month’s final two days, leaving it down about 1,600 points from the record high in late January.

The headline in the Financial Times was a little more nuanced, focusing on the impact of the market turmoil on quant hedge funds:


FT


Quant Funds Get Trashed

The FT reported:

Computer-driven, trend-following hedge funds are heading for their worst month in nearly 17 years after getting whipsawed when the stock market’s steady soar abruptly reversed into one of the quickest corrections in history earlier in February.

The carnage amongst hedge funds was widespread, according to the article:

Société Générale’s CTA index is down 5.55 per cent this month, even after the recent market rebound, making it the worst period for these systematic hedge funds since November 2001.
Man AHL’s $1.1bn Diversified fund lost almost 10 per cent in the month to February 16, while the London investment firm’s AHL Evolution and Alpha funds were down about 4-5 per cent over the same period. The flagship funds of GAM’s Cantab Capital, Systematica and Winton lost 9.5 per cent, 7.2 per cent and 4.6 per cent* respectively between the start of the month and February 16. Aspect Capital’s Diversified Fund dropped 9.5 per cent in the month to February 20, while a trend-following fund run by Lynx Asset Management slumped 12.7 per cent. A leveraged version of the same fund tumbled 18.8 per cent. One of the other big victims is Roy Niederhoffer, whose fund lost 21.1 per cent in the month to February 20.

Painful reading, indeed.


Traders conditioned to a state of somnambulance were shocked by the ferocity of the volatility spike, as the CBOE VIX index soared by over 200% in a single day, reaching a high of over 38 on Feb 5th:


VIX Index


Indeed, this turned out to be the largest ever two-day increase in the history of the index:

VIX_Spike_1

This Quant Strategy Made 27% In February Alone

So, for a quant-driven options strategy that is typically a premium seller, February must surely have been a disaster, if not a total wipe-out.  Not quite.  On the contrary, our Option Trader strategy made a massive gain of 27% for the month.  As a result strategy performance is now running at over 55% for 2018 YTD, while maintaining a Sharpe Ratio of 2.23.

Option Trader

You can tell that the strategy has a tendency to collect option premiums, not only because the strategy description says as much, but also from the observation that over 90% of strategy trades have been profitable – one of the defining characteristics of volatility strategies that are short-Vega, long-Theta.  The theory is that such strategies make money most of the time, but then give it all back (and more) when volatility inevitably spikes.  While that is generally true, in my experience, that clearly didn’t occur here.  So what’s the story?

One of the advantages of our Algo Trading Platform is that it not only reports in detail the live performance of our strategies, but it also reveals the actual trades on the site (typically delayed by 24-72 hours).  A review of the trades made by the Option Trader strategy from the end of January though early February indicates a strongly bullish bias, with short put trades in stocks such as Netflix, Inc. (NFLX), Shopify Inc. (SHOP), The Goldman Sachs Group, Inc. (GS) and Facebook, Inc. (FB), coupled with short call trades in VIX ETF products such as ProShares Ultra VIX Short-Term Futures (UVXY) and iPath S&P 500 VIX ST Futures ETN (VXX).  As volatility began to spike on 2/5, more calls were sold at increasingly fat premiums in several of the VIX Index ETFs.  These short volatility positions were later hedged with long trades in the underlying ETFs and, over time, both the hedges and the original option sales proved highly profitable. In other words, the extremely high levels of volatility enabled the strategy to profit on both legs of the trade, a highly unusual occurrence.  Meanwhile, while it was hedging its bets in the VIX ETF option trades, the strategy was becoming increasingly aggressive in the single stocks sector, taking outright long positions in Baidu, Inc. (BIDU), Align Technology, Inc. (ALGN), Netflix, Inc. (NFLX) and others, just as they became trading off their lows in the second week of the month.  By around Feb 12th the strategy recognized that the volatility shock had begun to subside and took advantage of the inflated option premia, selling puts across the board, in particular in the technology (Tesla, Inc. (TSLA), NVIDIA Corporation (NVDA)) and retail sectors (GrubHub Inc. (GRUB), Alibaba Group Holding Limited (BABA)) that had suffered especially heavy declines.  Many of these trades were closed at a substantial profit within a span of just a few days as the market stabilized and volatility subsided.  The strategy broadened the scope of its option selling as the month progressed, initially recovering the entirety of the drawdown it had initially suffered, before going on to register substantial profits on almost every trade.

To summarize:

  1.  Like many other market players, the Volatility Trader strategy was initially caught on the wrong side of the volatility spike and suffered a significant drawdown.
  2. Instead of liquidating positions, the strategy began hedging aggressively in sectors holding the greatest danger – VIX ETFs, in particular.  These trades ultimately proved profitable on both option and hedge legs as the market turned around and volatility collapsed.
  3. As soon as volatility showed signed of easing, the strategy began making aggressive bets on market stabilization and recovery, taking long positions in some of the most beaten-down stocks and selling puts across the board to capture inflated option premia.

Lesson Learned:  Aggressive Defense is the best Options Strategy in a Volatile Market

If there is one lesson above all others to be learned from this case study it is this:  that a period of market turmoil is a time of opportunity for option traders, but only if they play aggressively, both in defense and offense.  Many traders run scared at times like this and liquidate positions, taking heavy losses in the process that can prove impossible to recover from if, as here, the drawdown is severe.  This study shows that by holding one’s nerve and hedging rather than liquidating loss-making positions and then moving aggressively to capitalize on inflated option prices a trader can not only weather the storm but, as in this case, produce exceptional returns.

The key take-away is this: in order to play aggressively you have to have sufficient reserves in the tank to enable you to hold positions rather than liquidate them and, later on, to transition to selling expensive option premiums.  The mistake many option traders make is to trade too close to the line in term of margin limits, resulting  in a forced liquidation of positions that would otherwise have been profitable.

You can trade the Option Trader strategy live in your own brokerage account – go here for details.


Trading Prime Market Cycles

Magicicada tredecassini NC XIX male dorsal trim.jpg

Magicicada is the genus of the 13-year and 17-year periodical cicadas of eastern North America. Magicicada species spend most of their 13- and 17-year lives underground feeding on xylem fluids from the roots of deciduous forest trees in the eastern United States.  After 13 or 17 years, mature cicada nymphs emerge in the springtime at any given locality, synchronously and in tremendous numbers.  Within two months of the original emergence, the lifecycle is complete, the eggs have been laid, and the adult cicadas are gone for another 13 or 17 years.

The emergence period of large prime numbers (13 and 17 years) has been hypothesized to be a predator avoidance strategy adopted to eliminate the possibility of potential predators receiving periodic population boosts by synchronizing their own generations to divisors of the cicada emergence period. If, for example, the cycle length was, say, 12 years, then the species would be exposed to predators regenerating over cycles of 2, 3, 4, or 6 years.  Limiting their cycle to a large prime number reduces the variety of predators the species is likely to face.

SSALGOTRADING AD

Prime Cycles in Trading Strategies

What has any of this to do with trading?  When building a strategy in a particular market we might start by creating a model that works reasonably well on, say, 5-minute bars. Then, in order to improve the risk-adjusted returns we might try create a second sub-strategy on a different frequency.  This will hopefully result in a new series of signals, an increase in the number of trades, and corresponding improvement in the risk-adjusted returns of the overall strategy.  This phenomenon is referred to as temporal diversification.

What time frequency should we select for our second sub-strategy?  There are many factors to consider, of course, but one of them is that we would like to see as few duplicate signals between the two sub-strategies.  Otherwise we will simply be replicating trades, rather than reducing the overall level of strategy risk through temporal diversification.  The best way to minimize the overlap in signals generated by multiple sub-strategies is to use prime number bar frequencies (5 minute, 7 minute, 11 minute, etc).

S&P500 Swing Trading Strategy

An example of this approach is our EMini Swing Trading strategy which we operate on our Systematic Algotrading Platform.  This strategy is actually a combination of several different sub-strategies that operate on 5-minute, 11-minute, 17-minute and 31-minute bars.  Each strategy focuses on a different set of characteristics of the S&P 500 futures market, but the key point here is that the trading signals very rarely overlap and indeed several of the sub-strategies have a low correlation.

correl


The resulting increase in trade frequency and temporal diversification produces very attractive risk-adjusted performance: after an exceptional year in 2017 which saw a 78.58% net return, the strategy is already at  +60% YTD in 2018 and showing no sign of slowing down.

Investors can auto-trade the E-Mini Swing Trading strategy and many other strategies in their own account – see the Leaderboard for more details.

Perf1Monthly returns

Momentum Strategies

A few weeks ago I wrote an extensive post on a simple momentum strategy in E-Mini Futures. The basic idea is to buy the S&P500 E-Mini futures when the contract makes a new intraday high. This is subject to the qualification that the Internal Bar Strength fall below a selected threshold level. In order words, after a period of short-term weakness – indicated by the low reading of the Internal Bar Strength – we buy when the futures recover to make a new intraday high, suggesting continued forward momentum.

IBS is quite a useful trading indicator, which you can learn more about in the blog post:

A characteristic of momentum strategies is that they can often be applied successfully across several markets, usually with simple tweaks to the strategy parameters. As a case in point, take our Tech Momentum strategy, listed on the Systematic Strategies Algotrading platform which you can find out more about here:

This swing trading strategy applies similar momentum concepts to exploits long and short momentum effects in technology sector ETFs, focusing on the PROSHARES ULTRAPRO QQQ (TQQQ) and PROSHARES ULTRAPRO SHORT QQQ (SQQQ). Does it work? The results speak for themselves:

In four years of live trading the strategy has produced a compound annual return of 48.9%, with a Sharpe Ratio of 1.78 and Sortino Ratio of 2.98. 2018 is proving to be a banner year for the strategy, which is up by more than 48% YTD.

A very attractive feature of this momentum approach is that it is almost completely uncorrelated with the market and with a beta of just over 1 is hardly more risky than the market portfolio.

You can find out more about the Tech Momentum and other momentum strategies and how to trade them live in your own account on our Strategy Leaderboard:

New Algotrading Platform

Fig1


Systematic Strategies is pleased to announce the launch of its new Algo Trading Platform.  This will allow subscribers to follow a selection of our best strategies in equities, futures and options, for a low monthly subscription fee.

There is no minimum account size, and accounts of up to $250,000 can be traded on the platform.

The strategies are fully systematic and trades are executed automatically in your existing brokerage account, or you can open an account at one of our supported brokers, which include  Interactive Brokers, NinjaTrader, CQG, Gain Capital, AMP, Garwood, and many others.


Fig2


Find Strategies

Short LineFig3


Find Strategies


Short Line

FAQ1 FAQ2


More


Short Line

SYSTEMATIC STRATEGIES LLC

Systematic Strategies is an alternative investments firm utilizing quantitative modeling techniques to develop profitable trading strategies for deployment into global markets. Systematic Strategies seeks qualified investors as defined in Regulation D of the Securities Act of 1933. For information please contact us at info@ systematic-strategies.com or visit www.systematic-strategies.com.


RISK DISCLOSURE

This web site and the information contained herein is not and must not be construed as an offer to sell securities. Certain statements included in this web site, including, without limitation, statements regarding investment goals, strategies, and statements as to the manager’s expectations or opinions are forward-looking statements within the meaning of Section 27A of the Securities Act of 1933 (the “Securities Act”) and Section 21E of the Securities Exchange Act of 1944 (the “Exchange Act”) and are subject to risks and uncertainties. The factors discussed herein could cause actual results and development to be materially different from those expressed in or implied by such forward-looking statements. Accordingly, the information in this web site cannot be construed as to be guaranteed.

Futures WealthBuilder – June 2017: +4.4%

The Futures WealthBuilder product is an algorithmic CTA strategy that trades several highly liquid futures contracts using machine learning algorithms.  More details about the strategy are given in this blog post.

We offer a version of the strategy on the Collective 2 site (see here for details) that the user can subscribe to for a very modest fee of only $149 per month.  The Collective 2 version of the strategy is unlikely to perform as well as the product we offer in our Systematic Strategies Fund, which trades a much wider range of futures products.  But the strategy is off to an excellent start, making +4.4% in June and is now up 6.7% since inception in May.  In June the strategy made profitable trades in US Bonds, Euro F/X and VIX futures, and the last seven trades in a row have been winners.

You can find full details of the strategy, including a listing of all of the trades, on the Collective 2 site.

Subscribers can sign up for a free, seven day trial and thereafter they can choose to trade the strategy automatically in their own brokerage account, using the Collective 2 api.

Futures WealthBuilder June 2017