
There has been a good deal of interest in the market timing ideas discussed in my earlier blog post Using Volatility to Predict Market Direction, which discusses the research of Diebold and Christoffersen into the sign predictability induced by volatility dynamics. The ideas are thoroughly explored in a QuantNotes article from 2006, which you can download here.
There is a follow-up article from 2006 in which Christoffersen, Diebold, Mariano and Tay develop the ideas further to consider the impact of higher moments of the asset return distribution on sign predictability and the potential for market timing in international markets (download here).
Trading Strategy
To illustrate some of the possibilities of this approach, we constructed a simple market timing strategy in which a position was taken in the S&P 500 index or in 90-Day T-Bills, depending on an ex-ante forecast of positive returns from the logit regression model (and using an expanding window to estimate the drift coefficient). We assume that the position is held for 30 days and rebalanced at the end of each period. In this test we make no allowance for market impact, or transaction costs.
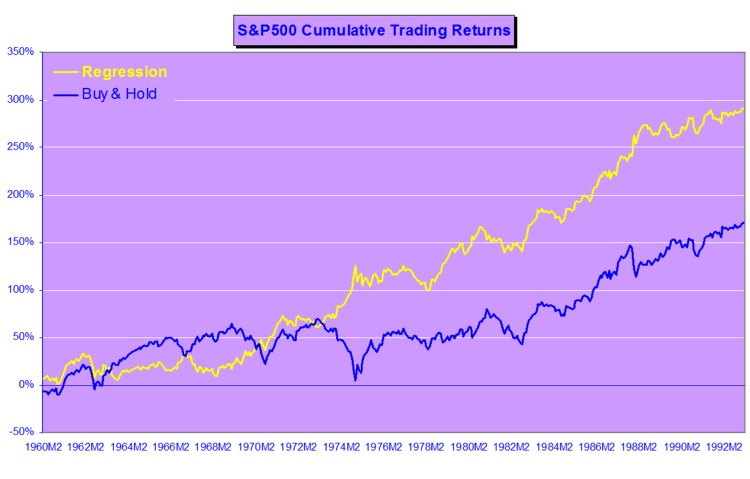
Results
Annual returns for the strategy and for the benchmark S&P 500 Index are shown in the figure below. The strategy performs exceptionally well in 1987, 1989 and 1995, when the ratio between expected returns and volatility remains close to optimum levels and the direction of the S&P 500 Index is highly predictable, Of equal interest is that the strategy largely avoids the market downturn of 2000-2002 altogether, a period in which sign probabilities were exceptionally low.

In terms of overall performance, the model enters the market in 113 out of a total of 241 months (47%) and is profitable in 78 of them (69%). The average gain is 7.5% vs. an average loss of –4.11% (ratio 1.83). The compound annual return is 22.63%, with an annual volatility of 17.68%, alpha of 14.9% and Sharpe ratio of 1.10.
The under-performance of the strategy in 2003 is explained by the fact that direction-of-change probabilities were rising from a very low base in Q4 2002 and do not reach trigger levels until the end of the year. Even though the strategy out-performed the Index by a substantial margin of 6% , the performance in 2005 is of concern as market volatility was very low and probabilities overall were on a par with those seen in 1995. Further tests are required to determine whether the failure of the strategy to produce an exceptional performance on par with 1995 was the result of normal statistical variation or due to changes in the underlying structure of the process requiring model recalibration.
Future Research & Development
The obvious next step is to develop the approach described above to formulate trading strategies based on sign forecasting in a universe of several assets, possibly trading binary options. The approach also has potential for asset allocation, portfolio theory and risk management applications.
