This is a follow up post to my post on the Mathematics of Scalping. To illustrate the scalping methodology, I coded up a simple strategy based on the techniques described in the post.
The strategy trades a single @ES contract on 1-minute bars. The attached ELD file contains the Easylanguage code for ES scalping strategy, which can be run in Tradestation or Multicharts.
This strategy makes no attempt to forecast market direction and doesn’t consider market trends at all. It simply looks at the current levels of volatility and takes a long volatility position or a short volatility position depending on whether volatility is above or below some threshold parameters.
By long volatility I mean a position where we buy or sell the market and set a loose Profit Target and a tight Stop Loss. By short volatility I mean a position where we buy or sell the market and set a tight Profit Target and loose Stop Loss. This is exactly the methodology I described earlier in the post. The parameters I ended up using are as follows:
Long Volatility: Profit Target = 8 ticks, Stop Loss = 2 ticks
Short Volatility: Profit Target = 2 ticks, Stop Loss = 30 ticks
I have made no attempt to optimize these parameters settings, which can easily be done in Tradestation or Multicharts.
What do we mean by volatility being above our threshold level? I use a very simple metric: I take the TrueRange for the current bar and add 50% of the increase or decrease in TrueRange over the last two bars. That’s my crude volatility “forecast”.

The final point to explain is this: let’s suppose our volatility forecast is above our threshold level, so we know we want to be long volatility. Ok, but do we buy or sell the ES? One approach ia to try to gauge the direction of the market by estimating the trend. Not a bad idea, by any means, although I have argued that volatility drowns out any trend signal at short time frames (like 1 minute, for example). So I prefer an approach that makes no assumptions about market direction.
In this approach what we do is divide volatility into upsideVolatility and downsideVolatility. upsideVolatility uses the TrueRange for bars where Close > Close[1]. downsideVolatility is calculated only for bars where Close < Close[1]. This kind of methodology, where you calculate volatility based on the sign of the returns, is well known and is used in performance measures like the Sortino ratio. This is like the Sharpe ratio, except that you calculate the standard deviation of returns using only days in which the market was down. When it’s calculated this way, standard deviation is known as the (square root of the) semi-variance.
Anyway, back to our strategy. So we calculate the upside and downside volatilities and test them against our upper and lower volatility thresholds.
The decision tree looks like this:
LONG VOLATILITY
If upsideVolatilityForecast > upperVolThrehold, buy at the market with wide PT and tight ST (long market, long volatility)
If downsideVolatilityForecast > upperVolThrehold, sell at the market with wide PT and tight ST (short market, long volatility)
SHORT VOLATILITY
If upsideVolatilityForecast < lowerVolThrehold, sell at the Ask on a limit with tight PT and wide ST (short market, short volatility)
If downsideVolatilityForecast < lowerVolThrehold, buy at the Bid on a limit with tight PT and wide ST (long market, short volatility)
NOTE THE FOLLOWING CAVEATS. DO NOT TRY TO TRADE THIS STRATEGY LIVE (but use it as a basis for a tradable strategy)
1. The strategy makes the usual TS assumption about fill rates, which is unrealistic, especially at short intervals like 1-minute.
2. The strategy allows fees and commissions of $3 per contract, or $6 per round turn. Your trading costs may be higher than this.
3. Tradestation is unable to perform analysis at the tick level for a period as long at the one used here (2000 to 2014). A tick by tick analysis would likely show very different results (better or worse).
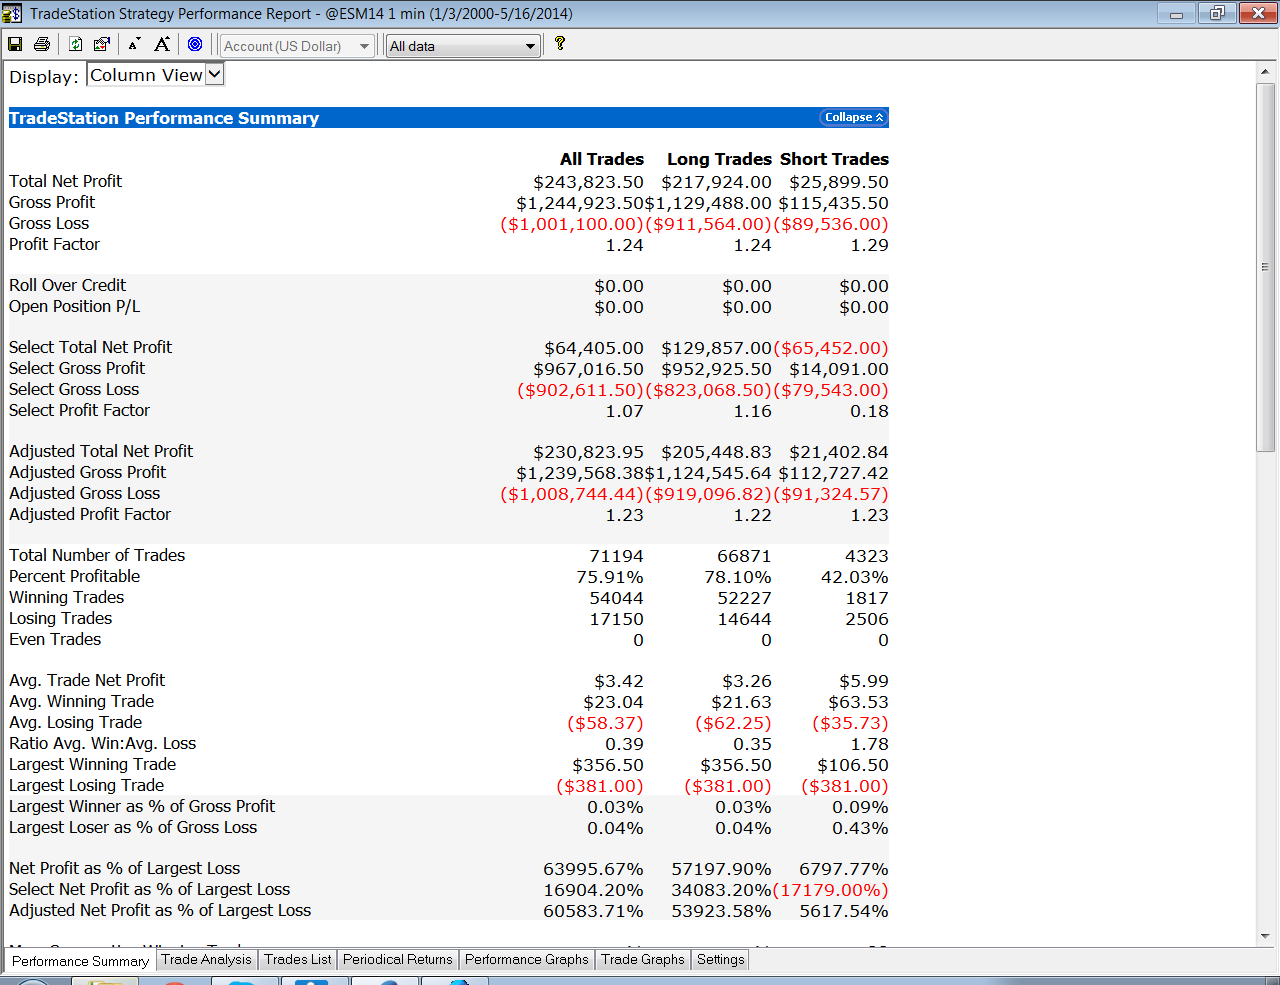
4. The strategy is extremely lop-sided: the great majority of the profits are made on the long side and the Win Rates and Profit Factors are very different for long trades vs short trades. I suspect this would change with a tick by tick analysis. But it also may be necessary to add more parameters so that long trades are treated differently from short trades.
5. No attempt has been made to optimize the parameters.
6 This is a daytading strategy that will exit the market on close.
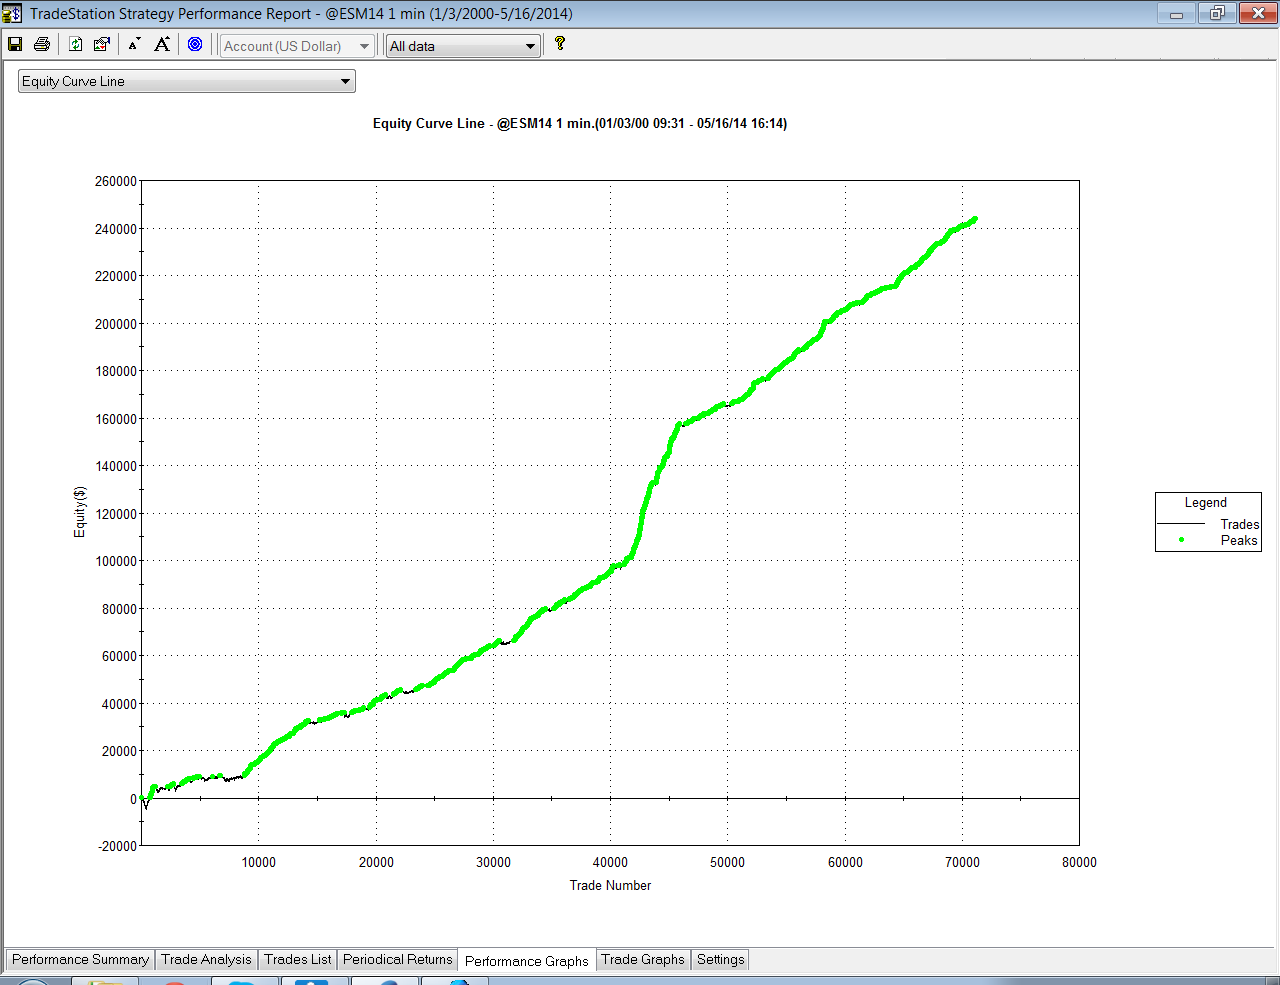
So with all that said here are the results.
As you can see, the strategy produces a smooth, upward sloping equity curve, the slope of which increases markedly during the period of high market volatility in 2008.
Net profits after commissions for a single ES contract amount to $243,000 ($3.42 per contract) with a win rate of 76% and Profit Factor of 1.24.
This basic implementation would obviously require improvement in several areas, not least of which would be to address the imbalance in strategy profitability on the short vs long side, where most of the profits are generated.