Portfolio Improvement for the Equity Investor

Portfolio

Equity investors and long-only portfolio managers are constantly on the lookout for ways to improve their portfolios, either by yield enhancement, or risk reduction.  In the case of yield enhancement, the principal focus is on adding alpha to the portfolio through stock selection and active management, while risk reduction tends to be accomplished through diversification.

Another approach is to seek improvement by adding investments outside the chosen universe of stocks, while remaining within the scope of the investment mandate (which, for instance, may include equity-related products, but not futures or options).  The advent of volatility products in the mid-2000’s offered new opportunities for risk reduction; but this benefit was typically achieved at the cost of several hundred basis points in yield.  Over the last decade, however, a significant evolution has taken place in volatility strategies, such that they can now not only provide insurance for the equity portfolio, but, in addition, serve as an orthogonal source of alpha to enhance portfolio yields.

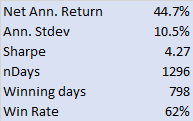
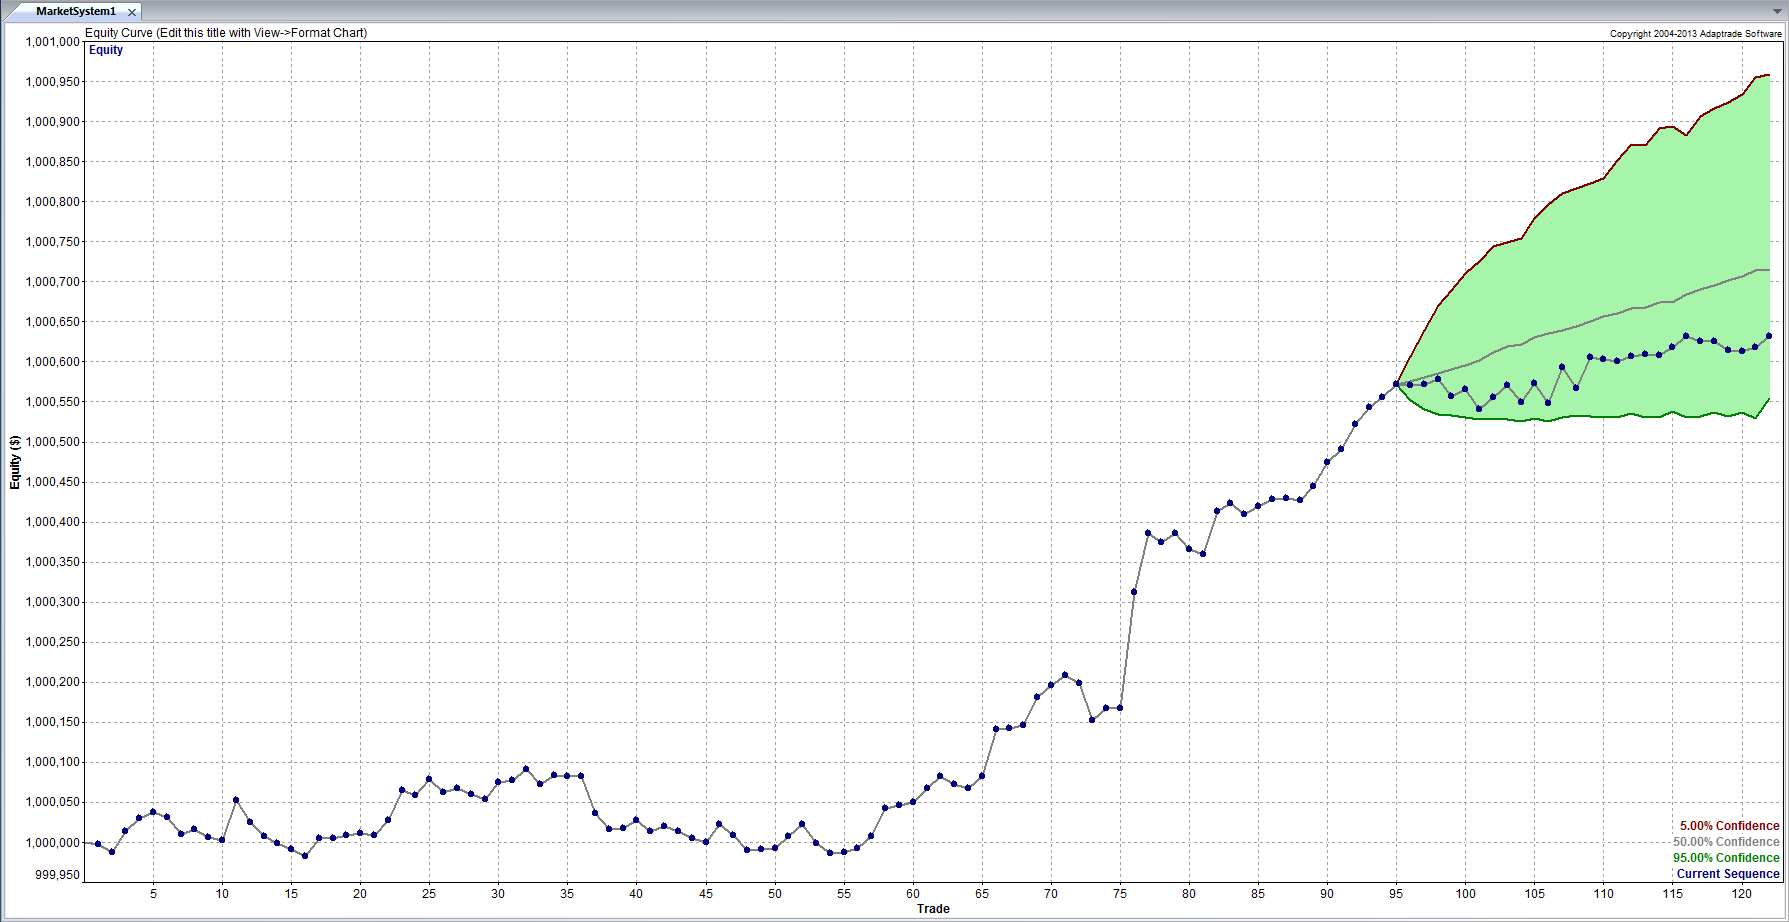
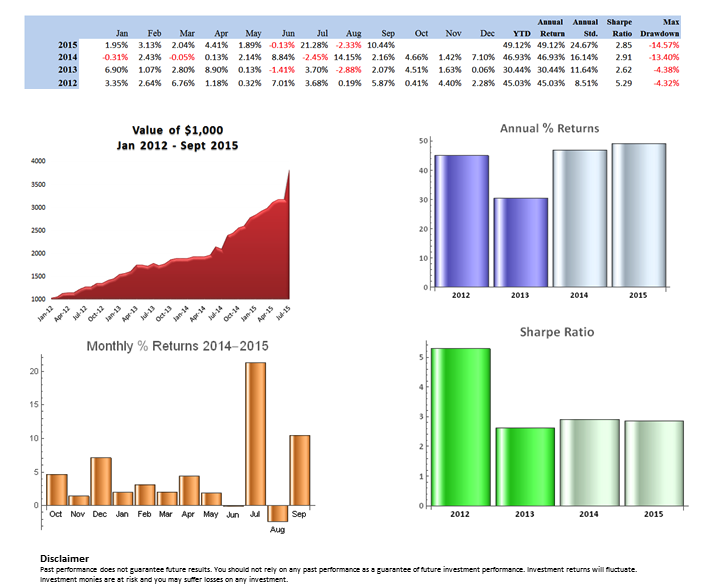
An example of one such product is our volatility strategy, a quantitative approach to trading VIX-related ETF products traded on ARCA. A summary of the performance of the strategy is given below.

Vol Strategy perf Sept 2015

The mechanics of the strategy are unlikely to be of great interest to the typical equity investor and so need not detain us here.  Rather, I want to focus on how an investor can use such products to enhance their equity portfolio.

Performance of the Equity Market and Individual Sectors

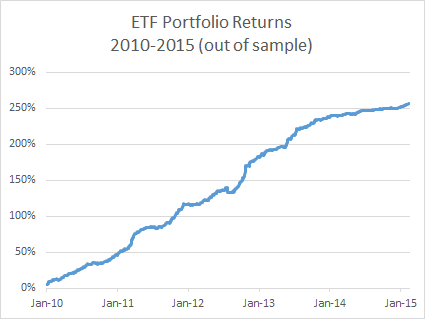
The last five years have been extremely benign for the equity market, not only for the broad market, as evidenced by the performance of the SPDR S&P 500 Trust ETF (SPY), and also by almost every individual sector, with the notable exception of energy.

Sector ETF Performance 2012-2015

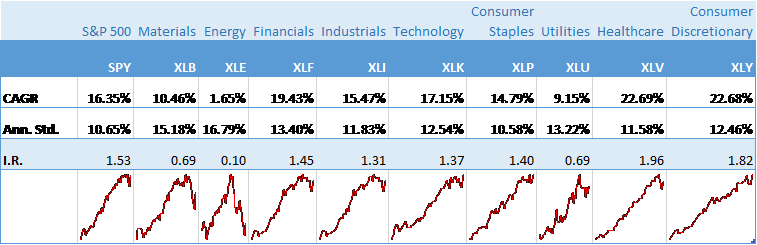
The risk-adjusted returns have been exceptional over this period, with information ratios reaching 1.4 or higher for several of the sectors, including Financials, Consumer Staples, Healthcare and Consumer Discretionary.  If the equity investor has been in a position to diversify his portfolio as fully as the SPY ETF, it might reasonably been assumed that he has accomplished the maximum possible level of risk reduction; at the same time, no-one is going to argue with a CAGR of 16.35%.  Yet, even here, portfolio improvement is possible.

Yield Enhancement

The key to improving the portfolio yield lies in the superior risk-adjusted performance of the volatility portfolio compared to the equity portfolio and also due the fact that, while the correlation between the two is significant (at 0.44), it is considerably lower than 1.  Hence there is potential for generating higher rates of return on a risk-adjusted basis by combining the pair of portfolios in some proportion.

SSALGOTRADING AD

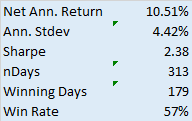
To illustrate this we assume, firstly, that the investor is comfortable with the currently level of risk in his broadly diversified equity portfolio, as measured by the annual standard deviation of returns, currently 10.65%.   Holding this level of risk constant, we now introduce an overlay strategy, namely the volatility portfolio, to which we seek to allocate some proportion of the available investment capital.  With this constraint it turns out that we can achieve a substantial improvement in the overall yield by reducing our holding in the equity portfolio to just over 2/3 of the current level (67.2%) and allocating 32.8% of the capital to the volatility portfolio.  Over the period from 2012, the combined equity and volatility portfolio produced a CAGR of 26.83%, but with the same annual standard deviation – a yield enhancement of 10.48% annually.  The portfolio Information Ratio improves from 1.53 to a 2.52, reflecting the much higher returns produced by the combined portfolio, for the same level of risk as before.

Chart

Risk Reduction

The given example may appear impressive, but it isn’t really a practical proposition.  Firstly, no equity investor or portfolio manager is likely to want to allocate 1/3 of their total capital to a strategy operated by a third party, no matter how impressive the returns. Secondly, the capacity in the volatility strategy is, realistically, of the order of $100 million.  A 32.8% allocation of capital from a sizeable equity portfolio would absorb a large proportion of the available capacity in the volatility ETF strategy, or even all of it.

A much more realistic approach would be to cap the allocation to the volatility component at a reasonable level – say, 5%.  Then the allocation from a $100M capital budget would be $5M, well within the capacity constraints of the volatility product.  In fact, operating at this capped allocation percentage, the volatility strategy provides capacity for equity portfolios of up to $2Bn in total capital.

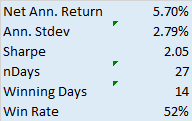
Let’s look at an example of what can be achieved under a 5% allocation constraint.  In this scenario I am going to move along the second axis of portfolio improvement – risk reduction.  Here, we assume that we wish to maintain the current level of performance of the equity portfolio (CAGR 16.35%), while reducing the risk as much as possible.

A legitimate question at this stage would be to ask how it might be possible to reduce risk by introducing a new investment that has a higher annual standard deviation than the existing portfolio?  The answer is simply that we move some of our existing investment into cash (or, rather, Treasury securities).  In fact, by allocating the maximum allowed to the volatility portfolio (5%) and reducing our holding in the equity portfolio to 85.8% of the original level (with the remaining 9.2% in cash), we are able to create a portfolio with the same CAGR but with an annual volatility in single digits: 9.53%, a reduction in risk of  112 basis points annually.  At the same time, the risk adjusted performance of the portfolio improves from 1.53 to 1.71 over the period from 2012.

Of course, the level of portfolio improvement is highly dependent on the performance characteristics of both the equity portfolio and overlay strategy, as well as the correlation between them. To take a further example, if we consider an equity portfolio mirroring the characteristics of the Materials Select Sector SPDR ETF (XLB), we can achieve a reduction of as much as 3.31% in the annual standard deviation, without any loss in expected yield, through an allocation of 5% to the volatility overlay strategy and a much higher allocation of 18% to cash.

Other Considerations

Investors and money managers being what they are, it goes against the grain to consider allocating money to a third party – after all, a professional money manager earns his living from his own investment expertise, rather than relying on others.  Yet no investor can reasonably expect to achieve the same level of success in every field of investment.  If you have built your reputation on your abilities as a fundamental analyst and stock picker, it is unreasonable to expect that you will be able accomplish as much in the arena of quantitative investment strategies.  Secondly, by capping the allocation to an external manager at the level of 5% to 10%, your primary investment approach remains unaltered –  you are maintaining the fidelity of your principal investment thesis and investment mandate.  Thirdly, there is no reason why overlay strategies such as the one discussed here should not provide easy liquidity terms – after all, the underlying investments are liquid, exchange traded products. Finally, if you allocate capital in the form of a managed account you can maintain control over the allocated capital and make adjustments rapidly, as your investment needs change.

Conclusion

Quantitative strategies have a useful role to play for equity investors and portfolio managers as a means to improve existing portfolios, whether by yield enhancement, risk reduction, or a combination of the two.  While the level of improvement is highly dependent on the performance characteristics of the equity portfolio and the overlay strategy, the indications are that yield enhancement, or risk reduction, of the order of hundreds of basis points may be achievable even through very modest allocations of capital.

Is Your Trading Strategy Still Working?

The Challenge of Validating Strategy Performance

One of the challenges faced by investment strategists is to assess whether a strategy is continuing to perform as it should.  This applies whether it is a new strategy that has been backtested and is now being traded in production, or a strategy that has been live for a while.
All strategies have a limited lifespan.  Markets change, and a trading strategy that can’t accommodate that change will get out of sync with the market and start to lose money. Unless you have a way to identify when a strategy is no longer in sync with the market, months of profitable trading can be undone very quickly.

The issue is particularly important for quantitative strategies.  Firstly, quantitative strategies are susceptible to the risk of over-fitting.  Secondly, unlike a strategy based on fundamental factors, it may be difficult for the analyst to verify that the drivers of strategy profitability remain intact.

Savvy investors are well aware of the risk of quantitative strategies breaking down and are likely to require reassurance that a period of underperformance is a purely temporary phenomenon.

It might be tempting to believe that you will simply stop trading when the strategy stops working.  But given the stochastic nature of investment returns, how do you distinguish a losing streak from a system breakdown?

SSALGOTRADING AD

Stochastic Process Control

One approach to the problem derives from the field of Monte Carlo simulation and stochastic process control.  Here we random draw samples from the distribution of strategy returns and use these to construct a prediction envelope to forecast the range of future returns.  If the equity curve of the strategy over the forecast period  falls outside of the envelope, it would raise serious concerns that the strategy may have broken down.  In those circumstances you would almost certainly want to trade the strategy in smaller size for a while to see if it recovers, or even exit the strategy altogether it it does not.

I will illustrate the procedure for the long/short ETF strategy that I described in an earlier post, making use of Michael Bryant’s excellent Market System Analyzer software.

To briefly refresh, the strategy is built using cointegration theory to construct long/short portfolios is a selection of ETFs that provide exposure to US and international equity, currency, real estate and fixed income markets.  The out of sample back-test performance of the strategy is very encouraging:

Fig 2


Fig 1

There was evidently a significant slowdown during 2014, with a reduction in the risk-adjusted returns and win rate for the strategy:

Fig 1

This period might itself have raised questions about the continuing effectiveness of the strategy.  However, we have the benefit of hindsight in seeing that, during the first two months of 2015, performance appeared to be recovering.

Consequently we put the strategy into production testing at the beginning of March 2015 and we now wish to evaluate whether the strategy is continuing on track.   The results indicate that strategy performance has been somewhat weaker than we might have hoped, although this is compensated for by a significant reduction in strategy volatility, so that the net risk-adjusted returns remain somewhat in line with recent back-test history.

Fig 3

Using the MSA software we sample the most recent back-test returns for the period to the end of Feb 2015, and create a 95% prediction envelope for the returns since the beginning of March, as follows:

Fig 2

As we surmised, during the production period the strategy has slightly underperformed the projected median of the forecast range, but overall the equity curve still falls within the prediction envelope.  As this stage we would tentatively conclude that the strategy is continuing to perform within expected tolerance.

Had we seen a pattern like the one shown in the chart below, our conclusion would have been very different.

Fig 4

As shown in the illustration, the equity curve lies below the lower boundary of the prediction envelope, suggesting that the strategy has failed. In statistical terms, the trades in the validation segment appear not to belong to the same statistical distribution of trades that preceded the validation segment.

This strategy failure can also be explained as follows: The equity curve prior to the validation segment displays relatively little volatility. The drawdowns are modest, and the equity curve follows a fairly straight trajectory. As a result, the prediction envelope is fairly narrow, and the drawdown at the start of the validation segment is so large that the equity curve is unable to rise back above the lower boundary of the envelope. If the history prior to the validation period had been more volatile, it’s possible that the envelope would have been large enough to encompass the equity curve in the validation period.

 CONCLUSION

Systematic trading has the advantage of reducing emotion from trading because the trading system tells you when to buy or sell, eliminating the difficult decision of when to “pull the trigger.” However, when a trading system starts to fail a conflict arises between the need to follow the system without question and the need to stop following the system when it’s no longer working.

Stochastic process control provides a technical, objective method to determine when a trading strategy is no longer working and should be modified or taken offline. The prediction envelope method extrapolates the past trade history using Monte Carlo analysis and compares the actual equity curve to the range of probable equity curves based on the extrapolation.

Next we will look at nonparametric distributions tests  as an alternative method for assessing strategy performance.

Developing Long/Short ETF Strategies

Recently I have been working on the problem of how to construct large portfolios of cointegrated securities.  My focus has been on ETFs rather that stocks, although in principle the methodology applies equally well to either, of course.

My preference for ETFs is due primarily to the fact that  it is easier to achieve a wide diversification in the portfolio with a more limited number of securities: trading just a handful of ETFs one can easily gain exposure, not only to the US equity market, but also international equity markets, currencies, real estate, metals and commodities. Survivorship bias, shorting restrictions  and security-specific risk are also less of an issue with ETFs than with stocks (although these problems are not too difficult to handle).

On the downside, with few exceptions ETFs tend to have much shorter histories than equities or commodities.  One also has to pay close attention to the issue of liquidity. That said, I managed to assemble a universe of 85 ETF products with histories from 2006 that have sufficient liquidity collectively to easily absorb an investment of several hundreds of  millions of dollars, at minimum.

The Cardinality Problem

The basic methodology for constructing a long/short portfolio using cointegration is covered in an earlier post.   But problems arise when trying to extend the universe of underlying securities.  There are two challenges that need to be overcome.

Magic Cube.112

The first issue is that, other than the simple regression approach, more advanced techniques such as the Johansen test are unable to handle data sets comprising more than about a dozen securities. The second issue is that the number of possible combinations of cointegrated securities quickly becomes unmanageable as the size of the universe grows.  In this case, even taking a subset of just six securities from the ETF universe gives rise to a total of over 437 million possible combinations (85! / (79! * 6!).  An exhaustive test of all the possible combinations of a larger portfolio of, say, 20 ETFs, would entail examining around 1.4E+19 possibilities.

Given the scale of the computational problem, how to proceed? One approach to addressing the cardinality issue is sparse canonical correlation analysis, as described in Identifying Small Mean Reverting Portfolios,  d’Aspremont (2008). The essence of the idea is something like this. Suppose you find that, in a smaller, computable universe consisting of just two securities, a portfolio comprising, say, SPY and QQQ was  found to be cointegrated.  Then, when extending consideration to portfolios of three securities, instead of examining every possible combination, you might instead restrict your search to only those portfolios which contain SPY and QQQ. Having fixed the first two selections, you are left with only 83 possible combinations of three securities to consider.  This process is repeated as you move from portfolios comprising 3 securities to 4, 5, 6, … etc.

Other approaches to the cardinality problem are  possible.  In their 2014 paper Sparse, mean reverting portfolio selection using simulated annealing,  the Hungarian researchers Norbert Fogarasi and Janos Levendovszky consider a new optimization approach based on simulated annealing.  I have developed my own, hybrid approach to portfolio construction that makes use of similar analytical methodologies. Does it work?

A Cointegrated Long/Short ETF Basket

Below are summarized the out-of-sample results for a portfolio comprising 21 cointegrated ETFs over the period from 2010 to 2015.  The basket has broad exposure (long and short) to US and international equities, real estate, currencies and interest rates, as well as exposure in banking, oil and gas and other  specific sectors.

The portfolio was constructed using daily data from 2006 – 2009, and cointegration vectors were re-computed annually using data up to the end of the prior year.  I followed my usual practice of using daily data comprising “closing” prices around 12pm, i.e. in the middle of the trading session, in preference to prices at the 4pm market close.  Although liquidity at that time is often lower than at the close, volatility also tends to be muted and one has a period of perhaps as much at two hours to try to achieve the arrival price. I find this to be a more reliable assumption that the usual alternative.

Fig 2   Fig 1 The risk-adjusted performance of the strategy is consistently outstanding throughout the out-of-sample period from 2010.  After a slowdown in 2014, strategy performance in the first quarter of 2015 has again accelerated to the level achieved in earlier years (i.e. with a Sharpe ratio above 4).

Another useful test procedure is to compare the strategy performance with that of a portfolio constructed using standard mean-variance optimization (using the same ETF universe, of course).  The test indicates that a portfolio constructed using the traditional Markowitz approach produces a similar annual return, but with 2.5x the annual volatility (i.e. a Sharpe ratio of only 1.6).  What is impressive about this result is that the comparison one is making is between the out-of-sample performance of the strategy vs. the in-sample performance of a portfolio constructed using all of the available data.

Having demonstrated the validity of the methodology,  at least to my own satisfaction, the next step is to deploy the strategy and test it in a live environment.  This is now under way, using execution algos that are designed to minimize the implementation shortfall (i.e to minimize any difference between the theoretical and live performance of the strategy).  So far the implementation appears to be working very well.

Once a track record has been built and audited, the really hard work begins:  raising investment capital!

What Wealth Managers and Family Offices Need to Understand About Alternative Investing

Gold

The most recent Morningstar survey provides an interesting snapshot of the state of the alternatives market.  In 2013, for the third successive year, liquid alternatives was the fastest growing category of mutual funds, drawing in flows totaling $95.6 billion.  The fastest growing subcategories have been long-short stock funds (growing more than 80% in 2013), nontraditional bond funds (79%) and “multi-alternative” fund-of-alts-funds products (57%).

Benchmarking Alternatives
The survey also provides some interesting insights into the misconceptions about alternative investments that remain prevalent amongst advisors, despite contrary indications provided by long-standing academic research.  According to Morningstar, a significant proportion of advisors continue to use inappropriate benchmarks, such as the S&P 500 or Russell 2000, to evaluate alternatives funds (see Some advisers using ill-suited benchmarks to measure alts performance by Trevor Hunnicutt, Investment News July 2014).  As Investment News points out, the problem with applying standards developed to measure the performance of funds that are designed to beat market benchmarks is that many alternative funds are intended to achieve other investment goals, such as reducing volatility or correlation.  These funds will typically have under-performed standard equity indices during the bull market, causing investors to jettison them from their portfolios at a time when the additional protection they offer may be most needed.

SSALGOTRADING AD

This is but one example in a broader spectrum of issues about alternative investing that are poorly understood.  Even where advisors recognize the need for a more appropriate hedge fund index to benchmark fund performance, several traps remain for the unwary.  As shown in Brooks and Kat (The Statistical Properties of Hedge Fund Index Returns and Their Implications for Investors, Journal of Financial and Quantitative Analysis, 2001), there can be considerable heterogeneity between indices that aim to benchmark the same type of strategy, since indices tend to cover different parts of the alternatives universe.  There are also significant differences between indices in terms of their survivorship bias – the tendency to overstate returns by ignoring poorly performing funds that have closed down (see Welcome to the Dark Side – Hedge Fund Attribution and Survivorship Bias, Amin and Kat, Working Paper, 2002).  Hence, even amongst more savvy advisors, the perception of performance tends to be biased by the choice of index.

Risks and Benefits of Diversifying with Alternatives
An important and surprising discovery in relation to diversification with alternatives was revealed in Amin and Kat’s Diversification and Yield Enhancement with Hedge Funds (Working Paper, 2002).  Their study showed that the median standard deviation of a portfolio of stocks, bonds and hedge funds reached its lowest point where the allocation to alternatives was 50%, far higher than the 1%-5% typically recommended by advisors.

Standard Deviation of Portfolios of Stocks, Bonds and 20 hedge Funds

Hedge Fund Pct Mix and Volatility

Source: Diversification and Yield Enhancement with Hedge Funds, Amin and Kat, Working Paper, 2002

Another potential problem is that investors will not actually invest in the fund index that is used for benchmarking, but in a basket containing a much smaller number of funds, often through a fund of funds vehicle.  The discrepancy in performance between benchmark and basket can often be substantial in the alternatives space.

Amin and Kat studied this problem in 2002 (Portfolios of Hedge Funds, Working Paper, 2002), by constructing hedge fund portfolios ranging in size from 1 to 20 funds and measuring their performance on a number of criteria that included, not just the average return and standard deviation, but also the skewness (a measure of the asymmetry of returns), kurtosis (a measure of the probability of extreme returns)and the correlation with the S&P 500 Index and the Salomon (now Citigroup) Government Bond Index.  Their startling conclusion was that, in the alternatives space, diversification is not necessarily a good thing.    As expected, as the number of funds in the basket is increased, the overall volatility drops substantially; but at the same time skewness drops and kurtosis and market correlation increase significantly.  In other words, when adding more funds, the likelihood of a large loss increases and the diversification benefit declines.   The researchers found that a good approximation to a typical hedge fund index could be constructed with a basket of just 15 well-chosen funds, in most cases.

Concerns about return distribution characteristics such as skewness and kurtosis may appear arcane, but these factors often become crucially important at just the wrong time, from the investor’s perspective.  When things go wrong in the stock market they also tend to go wrong for hedge funds, as a fall in stock prices is typically accompanied by a drop in market liquidity, a widening of spreads and, often, an increase in stock loan costs.  Equity market neutral and long/short funds that are typically long smaller cap stocks and short larger cap stocks will pay a higher price for the liquidity they need to maintain neutrality.  Likewise, a market sell-off is likely to lead to postponing of M&A transactions that will have a negative impact on the performance of risk arbitrage funds.  Nor are equity-related funds the only alternatives likely to suffer during a market sell-off.  A market fall will typically be accompanied by widening credit spreads, which in turn will damage the performance of fixed income and convertible arbitrage funds.   The key point is that, because they all share this risk, diversification among different funds will not do much to mitigate it.

Conclusions
Many advisors remain wedded to using traditional equity indices that are inappropriate benchmarks for alternative strategies.  Even where more relevant indices are selected, they may suffer from survivorship and fund-selection bias.

In order to reap the diversification benefit from alternatives, research shows that investors should concentrate a significant proportion of their wealth in the limited number of alternatives funds, a portfolio strategy that is diametrically opposed to the “common sense” approach of many advisors.

Finally, advisors often overlook the latent correlation and liquidity risks inherent in alternatives that come into play during market down-turns, at precisely the time when investors are most dependent on diversification to mitigate market risk.  Such risks can be managed, but only by paying attention to portfolio characteristics such as skewness and kurtosis, which alternative funds significantly impact.