Volatility as an asset class has grown up over the fifteen years since I started my first volatility arbitrage fund in 2000. Caissa Capital grew to about $400m in assets before I moved on, while several of its rivals have gone on to manage assets in the multiple billions of dollars. Back then volatility was seen as a niche, esoteric asset class and quite rightly so. Nonetheless, investors who braved the unknown and stayed the course have been well rewarded: in recent years volatility strategies as an asset class have handily outperformed the indices for global macro, equity market neutral and diversified funds of funds, for example. 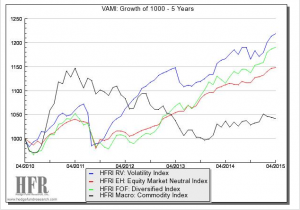
The Fundamentals of Volatility
It’s worth rehearsing a few of the fundamental features of volatility for those unfamiliar with the territory.
Volatility is Unobservable
Volatility is the ultimate derivative, one whose fair price can never be known, even after the event, since it is intrinsically unobservable. You can estimate what the volatility of an asset has been over some historical period using, for example, the standard deviation of returns. But this is only an estimate, one of several possibilities, all of which have shortcomings. We now know that volatility can be measured with almost arbitrary precision using an integrated volatility estimator (essentially a metric based on high frequency data), but that does not change the essential fact: our knowledge of volatility is always subject to uncertainty, unlike a stock price, for example.
Volatility Trends
Huge effort is expended in identifying trends in commodity markets and many billions of dollars are invested in trend following CTA strategies (and, equivalently, momentum strategies in equities). Trend following undoubtedly works, according to academic research, but is also subject to prolonged drawdowns during periods when a trend moderates or reverses. By contrast, volatility always trends. You can see this from the charts below, which express the relationship between volatility in the S&P 500 index in consecutive months. The r-square of the regression relationship is one of the largest to be found in economics. 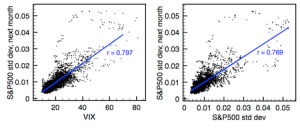 And this is a feature of volatility not just in one asset class, such as equities, nor even for all classes of financial assets, but in every time series process for which data exists, including weather and other natural phenomena. So an investment strategy than seeks to exploit volatility trends is relying upon one of the most consistent features of any asset process we know of (more on this topic in Long Memory and Regime Shifts in Asset Volatility).
Volatility Mean-Reversion and Correlation
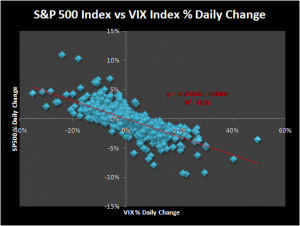
One of the central assumptions behind the ever-popular stat-arb strategies is that the basis between two or more correlated processes is stationary. Consequently, any departure from the long term relationship between such assets will eventually revert to the mean. Mean reversion is also an observed phenomenon in volatility processes. In fact, the speed of mean reversion (as estimated in, say, an Ornstein-Ulenbeck framework) is typically an order of magnitude larger than for a typical stock-pairs process. Furthermore, the correlation between one volatility process and another volatility process, or indeed between a volatility process and an asset returns process, tends to rise when markets are stressed (i.e. when volatility increases). 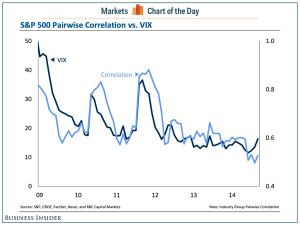
Another interesting feature of volatility correlations is that they are often lower than for the corresponding asset returns processes. One can therefore build a diversified volatility portfolio with far fewer assets that are required for, say, a basket of equities (see Modeling Asset Volatility for more on this topic).
 Finally, more sophisticated stat-arb strategies tend to rely on cointegration rather than correlation, because cointegrated series are often driven by some common fundamental factors, rather than purely statistical ones, which may prove temporary (see Developing Statistical Arbitrage Strategies Using Cointegration for more details). Again, cointegrated relationships tend to be commonplace in the universe of volatility processes and are typically more reliable over the long term than those found in asset return processes.
Volatility Term Structure
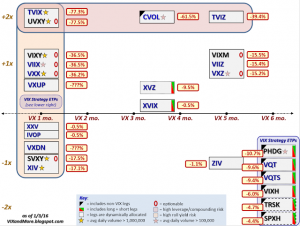
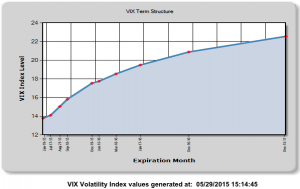
One of the most marked characteristics of the typical asset volatility process its upward sloping term structure. An example of the typical term structure for futures on the VIX S&P 500 Index volatility index (as at the end of May, 2015), is shown in the chart below. A steeply upward-sloping curve characterizes the term structure of equity volatility around 75% of the time.
 Fixed income investors can only dream of such yield in the current ZIRP environment, while f/x traders would have to plunge into the riskiest of currencies to achieve anything comparable in terms of yield differential and hope to be able to mitigate some of the devaluation risk by diversification.
The Volatility of Volatility
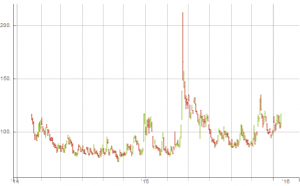
One feature of volatility processes that has been somewhat overlooked is the consistency of the volatility of volatility. Only on one occasion since 2007 has the VVIX index, which measures the annual volatility of the VIX index, ever fallen below 60.
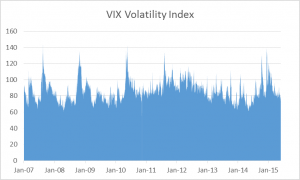 What this means is that, in trading volatility, you are trading an asset whose annual volatility has hardly ever fallen below 60% and which has often exceeded 100% per year. Trading opportunities tend to abound when volatility is consistently elevated, as here (and, conversely, the performance of many hedge fund strategies tends to suffer during periods of sustained, low volatility)

Anything You Can Do, I Can Do better
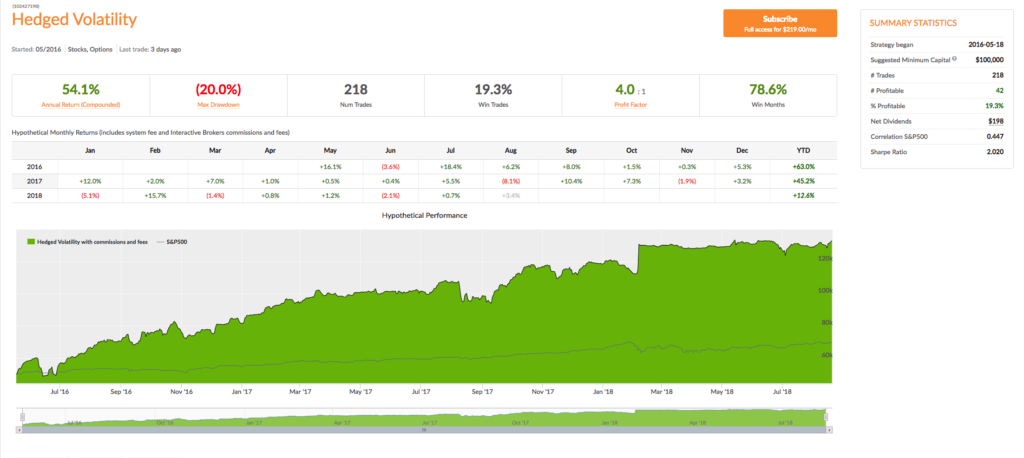
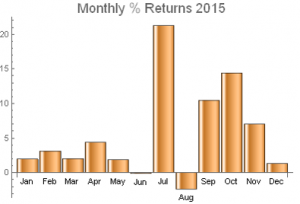
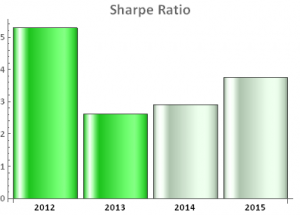
The take-away from all this should be fairly obvious: almost any strategy you care to name has an equivalent in the volatility space, whether it be volatility long/short, relative value, stat-arb, trend following or carry trading. What is more, because of the inherent characteristics of volatility, all these strategies tend to produce higher levels of performance than their more traditional counterparts. Take as an example our own Volatility ETF strategy, which has produced consistent annual returns of between 30% and 40%, with a Sharpe ratio in excess of 3, since 2012. 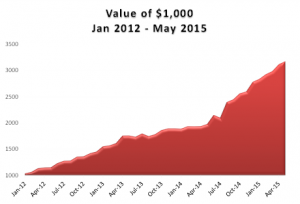

(click to enlarge)
Where does the Alpha Come From?
It is traditional at this stage for managers to point the finger at hedgers as the source of abnormal returns and indeed I will do the same now. Equity portfolio managers are hardly ignorant of the cost of using options and volatility derivatives to hedge their portfolios; but neither are they likely to be leading experts in the pricing of such derivatives. And, after all, in a year in which they might be showing a 20% to 30% return, saving a few basis points on the hedge is neither here nor there, compared to the benefits of locking in the performance gains (and fees!). The same applies even when the purpose of using such derivatives is primarily to produce trading returns. Maple Leaf’s George Castrounis puts it this way:
Significant supply/demand imbalances continuously appear in derivative markets. The principal users of options (i.e. pension funds, corporates, mutual funds, insurance companies, retail and hedge funds) trade these instruments to express a view on the direction of the underlying asset rather than to express a view on the volatility of that asset, thus making non-economic volatility decisions. Their decision process may be driven by factors that have nothing to do with volatility levels, such as tax treatment, lockup, voting rights, or cross ownership. This creates opportunities for strategies that trade volatility.
We might also point to another source of potential alpha: the uncertainty as to what the current level of volatility is, and how it should be priced. As I have already pointed out, volatility is intrinsically uncertain, being unobservable. This allows for a disparity of views about its true level, both currently and in future. Secondly, there is no universal agreement on how volatility should be priced. This permits at times a wide divergence of views on fair value (to give you some idea of the complexities involved, I would refer you to, for example, Range based EGARCH Option pricing Models). What this means, of course, is that there is a basis for a genuine source of competitive advantage, such as the Caissa Capital fund enjoyed in the early 2000s with its advanced option pricing models. The plethora of volatility products that have emerged over the last decade has only added to the opportunity set.
Why Hasn’t It Been Done Before?
This was an entirely legitimate question back in the early days of volatility arbitrage. The cost of trading an option book, to say nothing of the complexities of managing the associated risks, were significant disincentives for both managers and investors. Bid/ask spreads were wide enough to cause significant heads winds for strategies that required aggressive price-taking. Mangers often had to juggle two sets of risks books, one reflecting the market’s view of the portfolio Greeks, the other the model view. The task of explaining all this to investors, many of whom had never evaluated volatility strategies previously, was a daunting one. And then there were the capacity issues: back in the early 2000s a $400m long/short option portfolio would typically have to run to several hundred names in order to meet liquidity and market impact risk tolerances. Much has changed over the last fifteen years, especially with the advent of the highly popular VIX futures contract and the newer ETF products such as VXX and XIV, whose trading volumes and AUM are growing rapidly. These developments have exerted strong downward pressure on trading costs, while providing sufficient capacity for at least a dozen volatility funds managing over $1Bn in assets.
Why Hasn’t It Been Done Right Yet?
Again, this question is less apposite than it was ten years ago and since that time there have been a number of success stories in the volatility space. One of the learning points occurred in 2004-2007, when volatility hit the lows for a 20 month period, causing performance to crater in long volatility funds, as well as funds with a volatility neutral mandate. I recall meeting with Nassim Taleb to discuss his Empirica volatility fund prior to that period, at the start of the 2000s. My advice to him was that, while he had some great ideas, they were better suited to an insurance product rather than a hedge fund. A long volatility fund might lose money month after month for an entire year, and with it investors and AUM, before seeing the kind of payoff that made such investment torture worthwhile. And so it proved.
Conversely, stories about managers of short volatility funds showing superb performance, only to blow up spectacularly when volatility eventually explodes, are legion in this field. One example comes to mind of a fund in Long Beach, CA, whose prime broker I visited with sometime in 2002. He told me the fund had been producing a rock-steady 30% annual return for several years, and the enthusiasm from investors was off the charts – the fund was managing north of $1Bn by then. Somewhat crestfallen I asked him how they were producing such spectacular returns. “They just sell puts in the S&P, 100 points out of the money”, he told me. I waited, expecting him to continue with details of how the fund managers handled the enormous tail risk. I waited in vain. They were selling naked put options. I can only imagine how those guys did when the VIX blew up in 2003 and, if they made it through that, what on earth happened to them in 2008!
Conclusion
The moral is simple: one cannot afford to be either all-long, or all-short volatility. The fund must run a long/short book, buying cheap Gamma and selling expensive Theta wherever possible, and changing the net volatility exposure of the portfolio dynamically, to suit current market conditions. It can certainly be done; and with the new volatility products that have emerged in recent years, the opportunities in the volatility space have never looked more promising.

