Strategy Portfolio Construction


QUANTITATIVE RESEARCH AND TRADING
The latest theories, models and investment strategies in quantitative research and trading
Beta convexity is a measure of how stable a stock beta is across market regimes. The essential idea is to evaluate the beta of a stock during down-markets, separately from periods when the market is performing well. By choosing a portfolio of stocks with low beta-convexity we seek to stabilize the overall risk characteristics of our investment portfolio.
A primer on beta convexity and its applications is given in the following post:

In this post I am going to use the beta-convexity concept to construct a long-only equity portfolio capable of out-performing the benchmark S&P 500 index.
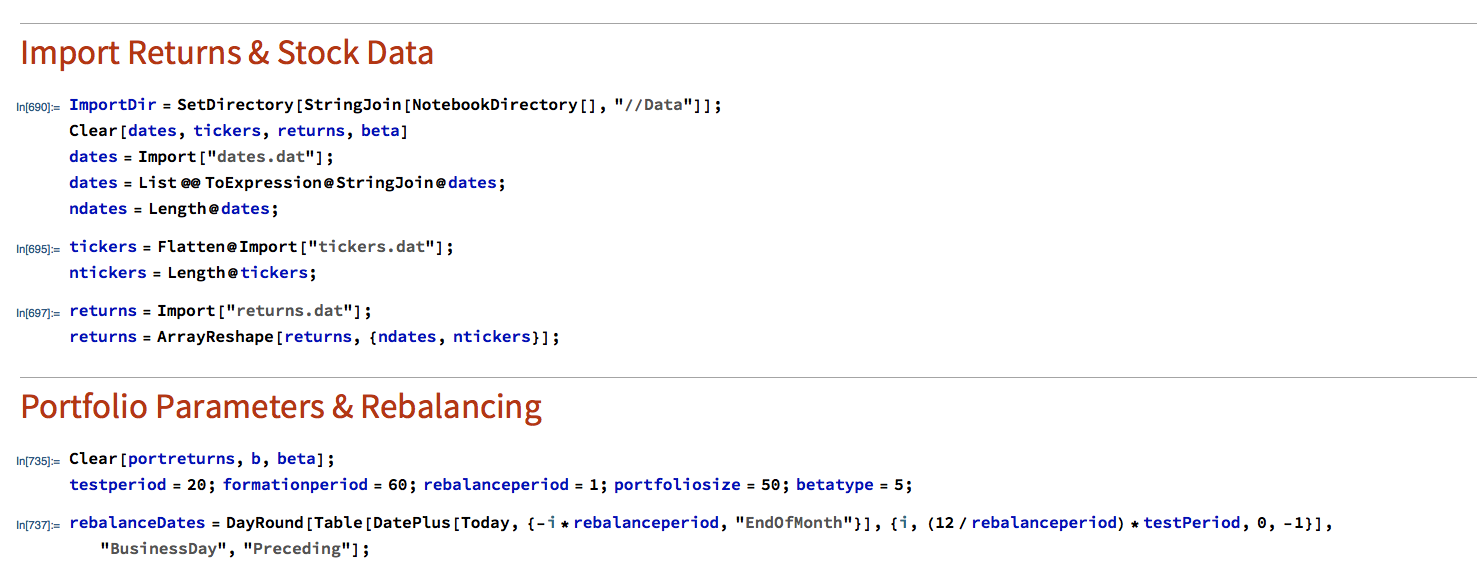
The post is in two parts. In the first section I outline the procedure in Mathematica for downloading data and creating a matrix of stock returns for the S&P 500 membership. This is purely about the mechanics, likely to be of interest chiefly to Mathematica users. The code deals with the issues of how to handle stocks with multiple different start dates and missing data, a problem that the analyst is faced with on a regular basis. Details are given in the pdf below. Let’s skip forward to the analysis.
We begin by importing the data saved using the data retrieval program, which comprises a matrix of (continuously compounded) monthly returns for the S&P500 Index and its constituent stocks. We select a portfolio size of 50 stocks, a test period of 20 years, with a formation period of 60 months and monthly rebalancing.
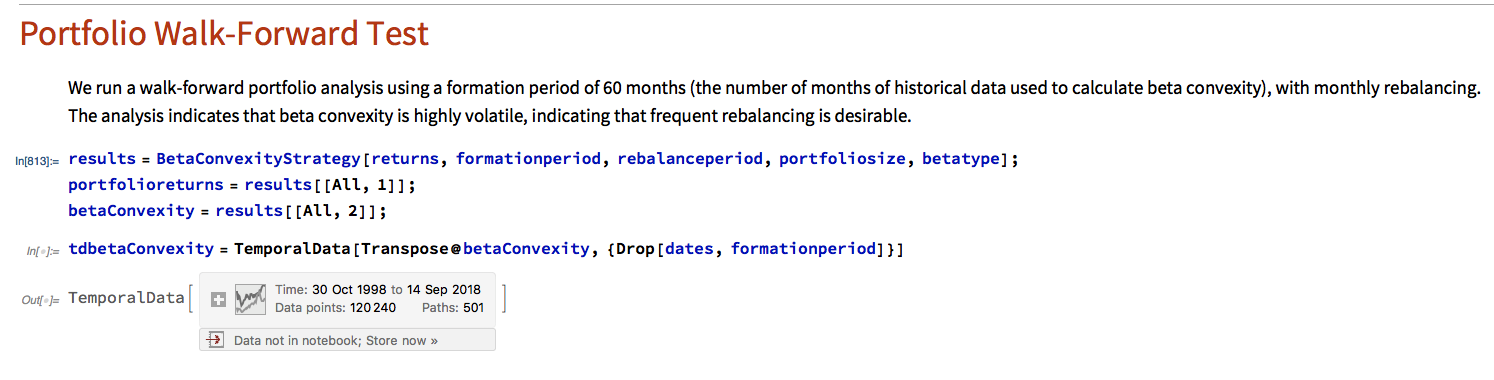
In the processing stage, for each month in our 20-year test period we calculate the beta convexity for each index constituent stock and select the 50 stocks that have the lowest beta-convexity during the prior 5-year formation period. We then compute the returns for an equally weighted basket of the chosen stocks over the following month. After that, we roll forward one month and repeat the exercise.
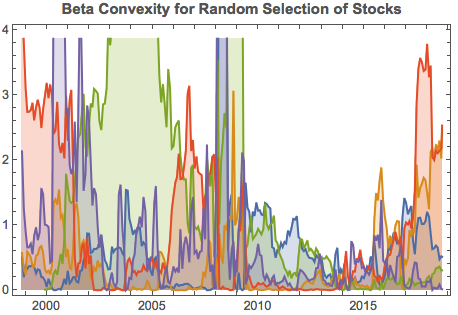
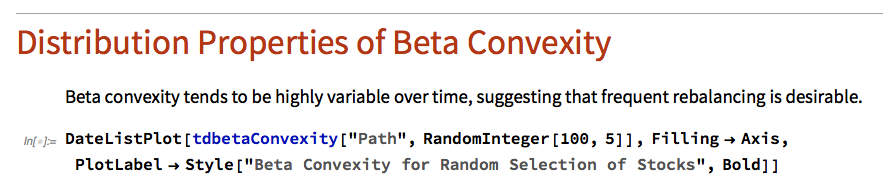
It turns out that beta-convexity tends to be quite unstable, as illustrated for a small sample of component stocks in the chart below:
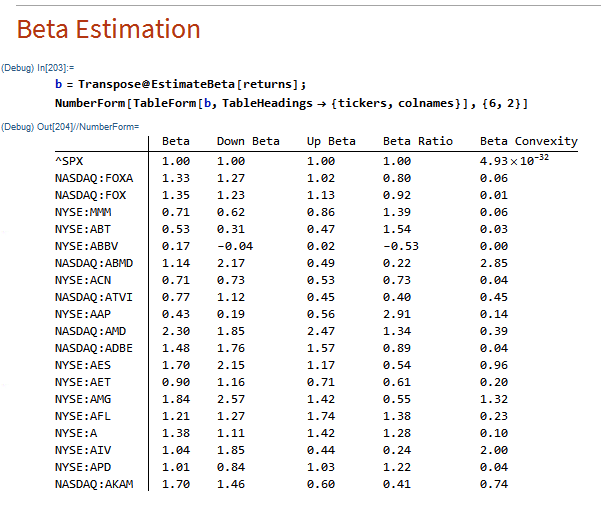
A snapshot of estimated convexity factors is shown in the following table. As you can see, there is considerable cross-sectional dispersion in convexity, in addition to time-series dependency.
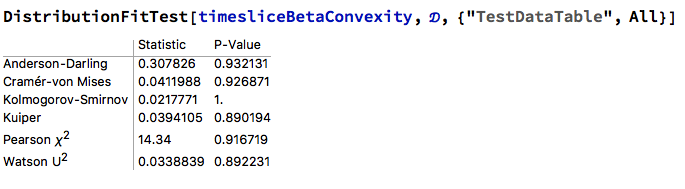
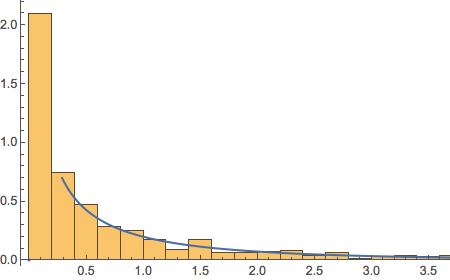
At any point in time the cross-sectional dispersion is well described by a Weibull distribution, which passes all of the usual goodness-of-fit tests.
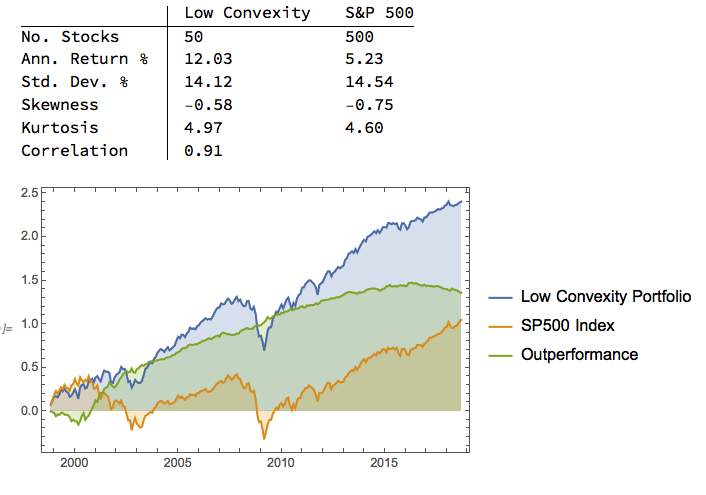
We compare the annual returns and standard deviation of the low convexity portfolio with the S&P500 benchmark in the table below. The results indicate that the average gross annual return of a low-convexity portfolio of 50 stocks is more than double that of the benchmark, with a comparable level of volatility. The portfolio also has slightly higher skewness and kurtosis than the benchmark, both desirable characteristics.
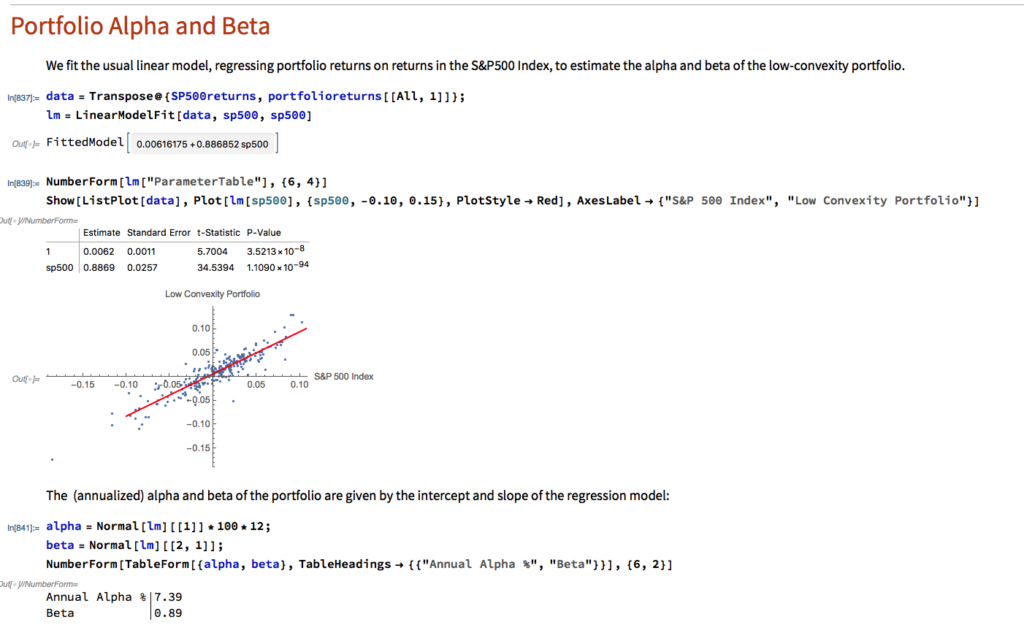
Using the standard linear CAPM model we estimate the annual alpha of the low-convexity portfolio to be around 7.39%, with a beta of 0.89.
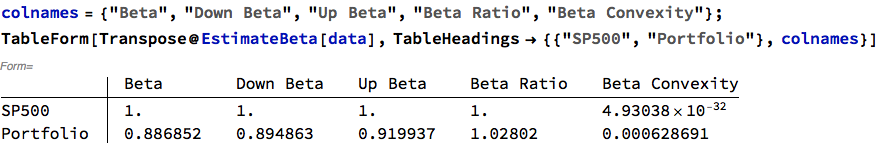
As we might anticipate, the beta convexity of the portfolio is very low since it comprises stocks with the lowest beta-convexity:
Using a beta-convexity factor model, we are able to construct a small portfolio that matches the benchmark index in terms of volatility, but with markedly superior annual returns. Larger portfolios offering greater liquidity produce slightly lower alpha, but a 100-200 stock portfolio typically produce at least double the annual rate of return of the benchmark over the 20-year test period.
For those interested, we shall shortly be offering a low-convexity strategy on our Systematic Algotrading platform – see details below:
