Trading Prime Market Cycles

Magicicada tredecassini NC XIX male dorsal trim.jpg

Magicicada is the genus of the 13-year and 17-year periodical cicadas of eastern North America. Magicicada species spend most of their 13- and 17-year lives underground feeding on xylem fluids from the roots of deciduous forest trees in the eastern United States.  After 13 or 17 years, mature cicada nymphs emerge in the springtime at any given locality, synchronously and in tremendous numbers.  Within two months of the original emergence, the lifecycle is complete, the eggs have been laid, and the adult cicadas are gone for another 13 or 17 years.

The emergence period of large prime numbers (13 and 17 years) has been hypothesized to be a predator avoidance strategy adopted to eliminate the possibility of potential predators receiving periodic population boosts by synchronizing their own generations to divisors of the cicada emergence period. If, for example, the cycle length was, say, 12 years, then the species would be exposed to predators regenerating over cycles of 2, 3, 4, or 6 years.  Limiting their cycle to a large prime number reduces the variety of predators the species is likely to face.

SSALGOTRADING AD

Prime Cycles in Trading Strategies

What has any of this to do with trading?  When building a strategy in a particular market we might start by creating a model that works reasonably well on, say, 5-minute bars. Then, in order to improve the risk-adjusted returns we might try create a second sub-strategy on a different frequency.  This will hopefully result in a new series of signals, an increase in the number of trades, and corresponding improvement in the risk-adjusted returns of the overall strategy.  This phenomenon is referred to as temporal diversification.

What time frequency should we select for our second sub-strategy?  There are many factors to consider, of course, but one of them is that we would like to see as few duplicate signals between the two sub-strategies.  Otherwise we will simply be replicating trades, rather than reducing the overall level of strategy risk through temporal diversification.  The best way to minimize the overlap in signals generated by multiple sub-strategies is to use prime number bar frequencies (5 minute, 7 minute, 11 minute, etc).

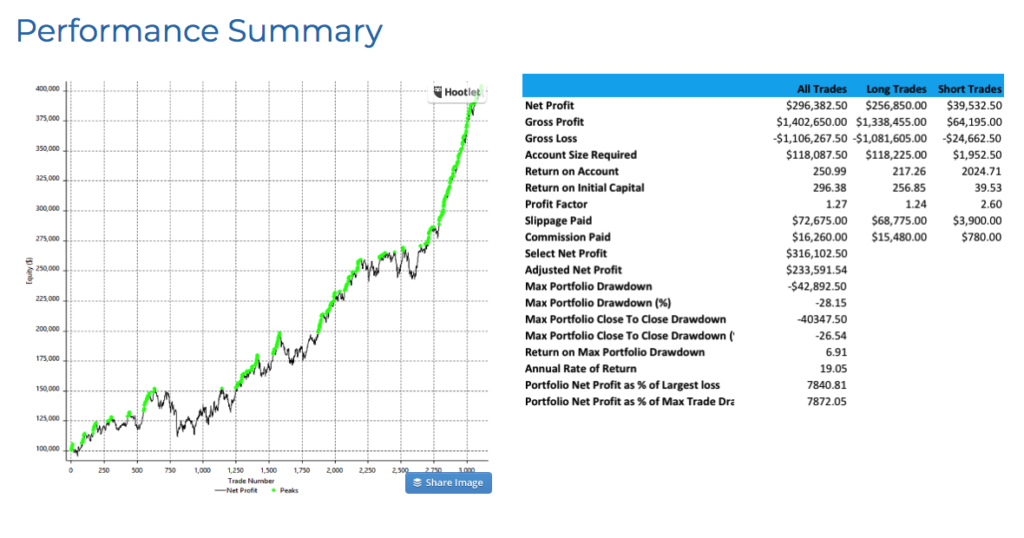
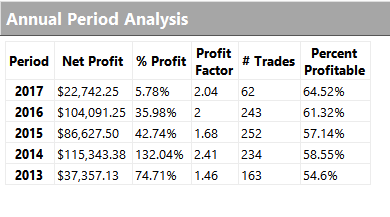
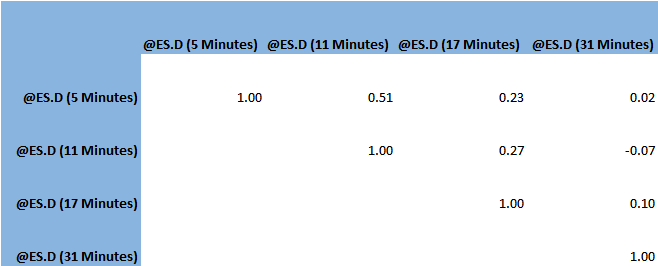
S&P500 Swing Trading Strategy

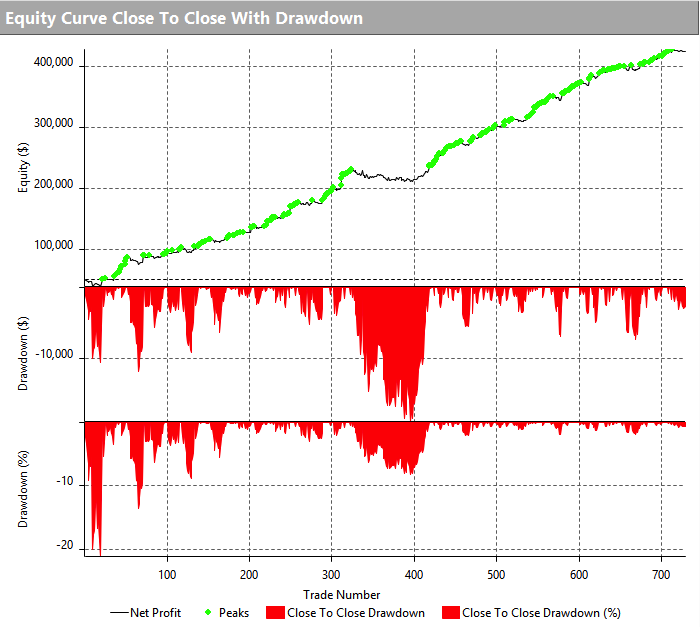
An example of this approach is our EMini Swing Trading strategy which we operate on our Systematic Algotrading Platform.  This strategy is actually a combination of several different sub-strategies that operate on 5-minute, 11-minute, 17-minute and 31-minute bars.  Each strategy focuses on a different set of characteristics of the S&P 500 futures market, but the key point here is that the trading signals very rarely overlap and indeed several of the sub-strategies have a low correlation.

correl


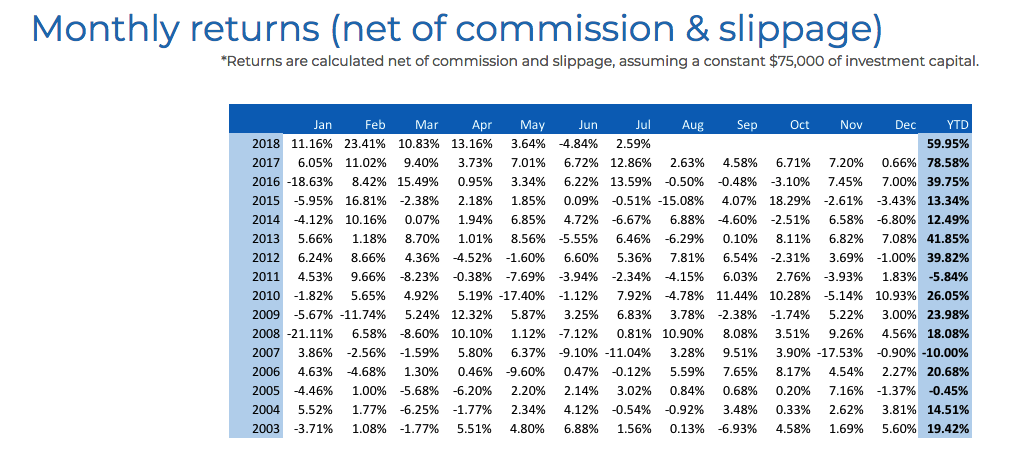
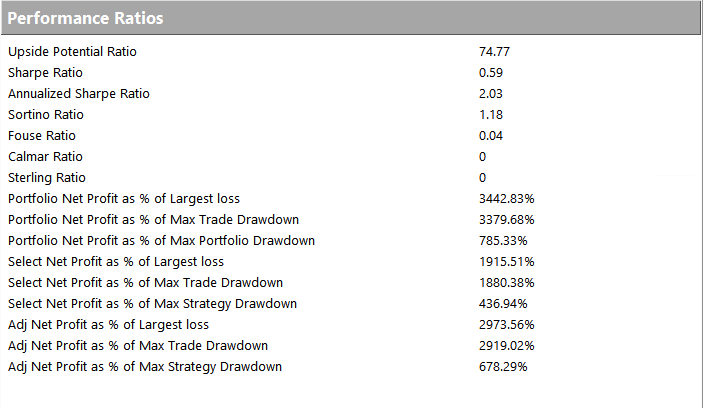
The resulting increase in trade frequency and temporal diversification produces very attractive risk-adjusted performance: after an exceptional year in 2017 which saw a 78.58% net return, the strategy is already at  +60% YTD in 2018 and showing no sign of slowing down.

Investors can auto-trade the E-Mini Swing Trading strategy and many other strategies in their own account – see the Leaderboard for more details.

Perf1Monthly returns

Futures WealthBuilder

We are launching a new product, the Futures WealthBuilder,  a CTA system that trades futures contracts in several highly liquid financial and commodity markets, including SP500 EMinis, Euros, VIX, Gold, US Bonds, 10-year and five-year notes, Corn, Natural Gas and Crude Oil.  Each  component strategy uses a variety of machine learning algorithms to detect trends, seasonal effects and mean-reversion.  We develop several different types of model for each market, and deploy them according to their suitability for current market conditions.

Performance of the strategy (net of fees) since 2013 is detailed in the charts and tables below.  Notable features include a Sharpe Ratio of just over 2, an annual rate of return of 190% on an account size of $50,000, and a maximum drawdown of around 8% over the last three years.  It is worth mentioning, too, that the strategy produces approximately equal rates of return on both long and short trades, with an overall profit factor above 2.


Fig1


Fig2


Fig3

Fig4


Fig5

Low Correlation

Despite a high level of correlation between several of the underlying markets, the correlation between the component strategies of Futures WealthBuilder are, in the majority of cases, negligibly small (with a few exceptions, such as the high correlation between the 10-year and 5-year note strategies).  This accounts for the relative high level of return in relation to portfolio risk, as measured by the Sharpe Ratio.   We offer strategies in both products chiefly as a mean of providing additional liquidity, rather than for their diversification benefit.

Fig 6

Strategy Robustness

Strategy robustness is a key consideration in the design stage.  We use Monte Carlo simulation to evaluate scenarios not seen in historical price data in order to ensure consistent performance across the widest possible range of market conditions.  Our methodology introduces random fluctuations to historical prices, increasing or decreasing them by as much as 30%.  We allow similar random fluctuations in that value strategy parameters, to ensure that our models perform consistently without being overly-sensitive to the specific parameter values we have specified.  Finally, we allow the start date of each sub-system to vary randomly by up to a year.

The effect of these variations is to produce a wide range of outcomes in terms of strategy performance.  We focus on the 5% worst outcomes, ranked by profitability, and select only those strategies whose performance is acceptable under these adverse scenarios.  In this way we reduce the risk of overfitting the models while providing more realistic expectations of model performance going forward.  This procedure also has the effect of reducing portfolio tail risk, and the maximum peak-to-valley drawdown likely to be produced by the strategy in future.

GC Daily Stress Test

Futures WealthBuilder on Collective 2

We will be running a variant of the Futures WealthBuilder strategy on the Collective 2 site, using a subset of the strategy models in several futures markets(see this page for details).  Subscribers will be able to link and auto-trade the strategy in their own account, assuming they make use of one of the approved brokerages which include Interactive Brokers, MB Trading and several others.

Obviously the performance is unlikely to be as good as the complete strategy, since several component sub-strategies will not be traded on Collective 2.  However, this does give the subscriber the option to trial the strategy in simulation before plunging in with real money.

Fig7