Optimal Mean-Reversion Strategies

Consider a financial asset whose price, Xt​, follows a mean-reverting stochastic process. A common model for mean reversion is the Ornstein-Uhlenbeck (OU) process, defined by the stochastic differential equation (SDE):

The trader aims to maximize the expected cumulative profit from trading this asset over a finite horizon, subject to transaction costs. The trader’s control is the rate of buying or selling the asset, denoted by ut​, at time t.

To find the optimal trading strategy, we frame this as a stochastic control problem. The value function,V(t,Xt​), represents the maximum expected profit from time t to the end of the trading horizon, given the current price level Xt​. The HJB equation for this problem is:

where C(ut​) represents the cost of trading, which can depend on the rate of trading ut​. The term ut​(Xt​−C(ut​)) captures the profit from trading, adjusted for transaction costs.

Boundary and Terminal Conditions: Specify terminal conditions for V(T,XT​), where T is the end of the trading horizon, and boundary conditions for V(t,Xt​) based on the problem setup.

Solve the HJB Equation: The solution involves finding the function V(t,Xt​) and the control policy ut∗​ that maximizes the HJB equation. This typically requires numerical methods, especially for complex cost functions or when closed-form solutions are not feasible.

Interpret the Optimal Policy: The optimal control ut∗​ derived from solving the HJB equation indicates the optimal rate of trading (buying or selling) at any time t and price level Xt​, considering the mean-reverting nature of the price and the impact of transaction costs.

No-Trade Zones: The presence of transaction costs often leads to the creation of no-trade zones in the optimal policy, where the expected benefit from trading does not outweigh the costs.

Mean-Reversion Exploitation: The optimal strategy exploits mean reversion by adjusting the trading rate based on the deviation of the current price from the mean level, μ.

The Lipton & Lopez de Marcos Paper

“A Closed-form Solution for Optimal Mean-reverting Trading Strategies” contributes significantly to the literature on optimal trading strategies for mean-reverting instruments. The paper focuses on deriving optimal trading strategies that maximize the Sharpe Ratio by solving the Hamilton-Jacobi-Bellman equation associated with the problem. It outlines a method that relies on solving a Fredholm integral equation to determine the optimal trading levels, taking into account transaction costs.

The paper begins by discussing the relevance of mean-reverting trading strategies across various markets, particularly emphasizing the energy market’s suitability for such strategies. It acknowledges the practical challenges and limitations of previous analytical results, mainly asymptotic and applicable to perpetual trading strategies, and highlights the novelty of addressing finite maturity strategies.

A key contribution of the paper is the development of an explicit formula for the Sharpe ratio in terms of stop-loss and take-profit levels, which allows traders to deploy tactical execution algorithms for optimal strategy performance under different market regimes. The methodology involves calibrating the Ornstein-Uhlenbeck process to market prices and optimizing the Sharpe ratio with respect to the defined levels. The authors present numerical results that illustrate the Sharpe ratio as a function of these levels for various parameters and discuss the implications of their findings for liquidity providers and statistical arbitrage traders.

The paper also reviews traditional approaches to similar problems, including the use of renewal theory and linear transaction costs, and compares these with its analytical framework. It concludes that its method provides a valuable tool for liquidity providers and traders to optimally execute their strategies, with practical applications beyond theoretical interest.

The authors use the path integral method to understand the behavior of their solutions, providing an alternative treatment to linear transaction costs that results in a determination of critical boundaries for trading. This approach is distinct in its use of direct solving methods for the Fredholm equation and adjusting the trading thresholds through a numerical method until a matching condition is met.

This research not only advances the understanding of optimal trading rules for mean-reverting strategies but also offers practical guidance for traders and liquidity providers in implementing these strategies effectively.


Is Your Trading Strategy Still Working?

The Challenge of Validating Strategy Performance

One of the challenges faced by investment strategists is to assess whether a strategy is continuing to perform as it should.  This applies whether it is a new strategy that has been backtested and is now being traded in production, or a strategy that has been live for a while.
All strategies have a limited lifespan.  Markets change, and a trading strategy that can’t accommodate that change will get out of sync with the market and start to lose money. Unless you have a way to identify when a strategy is no longer in sync with the market, months of profitable trading can be undone very quickly.

The issue is particularly important for quantitative strategies.  Firstly, quantitative strategies are susceptible to the risk of over-fitting.  Secondly, unlike a strategy based on fundamental factors, it may be difficult for the analyst to verify that the drivers of strategy profitability remain intact.

Savvy investors are well aware of the risk of quantitative strategies breaking down and are likely to require reassurance that a period of underperformance is a purely temporary phenomenon.

It might be tempting to believe that you will simply stop trading when the strategy stops working.  But given the stochastic nature of investment returns, how do you distinguish a losing streak from a system breakdown?

SSALGOTRADING AD

Stochastic Process Control

One approach to the problem derives from the field of Monte Carlo simulation and stochastic process control.  Here we random draw samples from the distribution of strategy returns and use these to construct a prediction envelope to forecast the range of future returns.  If the equity curve of the strategy over the forecast period  falls outside of the envelope, it would raise serious concerns that the strategy may have broken down.  In those circumstances you would almost certainly want to trade the strategy in smaller size for a while to see if it recovers, or even exit the strategy altogether it it does not.

I will illustrate the procedure for the long/short ETF strategy that I described in an earlier post, making use of Michael Bryant’s excellent Market System Analyzer software.

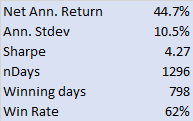
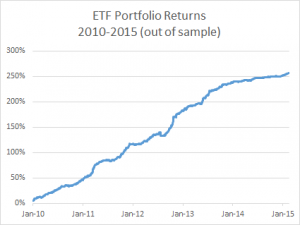
To briefly refresh, the strategy is built using cointegration theory to construct long/short portfolios is a selection of ETFs that provide exposure to US and international equity, currency, real estate and fixed income markets.  The out of sample back-test performance of the strategy is very encouraging:

Fig 2


Fig 1

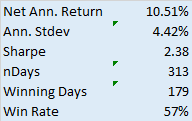
There was evidently a significant slowdown during 2014, with a reduction in the risk-adjusted returns and win rate for the strategy:

Fig 1

This period might itself have raised questions about the continuing effectiveness of the strategy.  However, we have the benefit of hindsight in seeing that, during the first two months of 2015, performance appeared to be recovering.

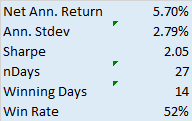
Consequently we put the strategy into production testing at the beginning of March 2015 and we now wish to evaluate whether the strategy is continuing on track.   The results indicate that strategy performance has been somewhat weaker than we might have hoped, although this is compensated for by a significant reduction in strategy volatility, so that the net risk-adjusted returns remain somewhat in line with recent back-test history.

Fig 3

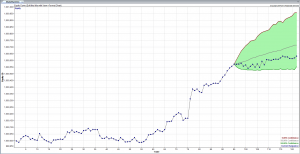
Using the MSA software we sample the most recent back-test returns for the period to the end of Feb 2015, and create a 95% prediction envelope for the returns since the beginning of March, as follows:

Fig 2

As we surmised, during the production period the strategy has slightly underperformed the projected median of the forecast range, but overall the equity curve still falls within the prediction envelope.  As this stage we would tentatively conclude that the strategy is continuing to perform within expected tolerance.

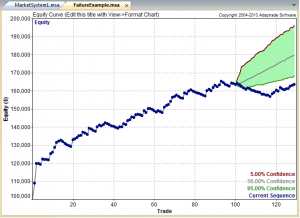
Had we seen a pattern like the one shown in the chart below, our conclusion would have been very different.

Fig 4

As shown in the illustration, the equity curve lies below the lower boundary of the prediction envelope, suggesting that the strategy has failed. In statistical terms, the trades in the validation segment appear not to belong to the same statistical distribution of trades that preceded the validation segment.

This strategy failure can also be explained as follows: The equity curve prior to the validation segment displays relatively little volatility. The drawdowns are modest, and the equity curve follows a fairly straight trajectory. As a result, the prediction envelope is fairly narrow, and the drawdown at the start of the validation segment is so large that the equity curve is unable to rise back above the lower boundary of the envelope. If the history prior to the validation period had been more volatile, it’s possible that the envelope would have been large enough to encompass the equity curve in the validation period.

 CONCLUSION

Systematic trading has the advantage of reducing emotion from trading because the trading system tells you when to buy or sell, eliminating the difficult decision of when to “pull the trigger.” However, when a trading system starts to fail a conflict arises between the need to follow the system without question and the need to stop following the system when it’s no longer working.

Stochastic process control provides a technical, objective method to determine when a trading strategy is no longer working and should be modified or taken offline. The prediction envelope method extrapolates the past trade history using Monte Carlo analysis and compares the actual equity curve to the range of probable equity curves based on the extrapolation.

Next we will look at nonparametric distributions tests  as an alternative method for assessing strategy performance.