Why Technical Analysis Doesn’t Work

Single Stock Analytics

Generally speaking, one of the major attractions of working in the equities space is that the large number of available securities opens up a much wider range of opportunities for the quantitative researcher than for, say, futures markets.  The focus in equities tends to be on portfolio strategies since the scope of the universe permits an unparalleled degree of diversification.  Single stock strategies forego such benefit, but they are of interest to the analyst and investor nonetheless: “stock picking” is almost a national pastime, at least for US investors.

Rather than seeking to mitigate stock specific risk through diversification,  the stock picker is actively seeking to identify  risk opportunities that are unique  to a specific stock, and he hopes will yield abnormal returns.  These can arise for any number of reasons – mergers and acquisitions, new product development, change in index membership, to name just a few.  The hope is that such opportunities may be uncovered by one of several possible means:

  • Identification of latent, intrinsic value in neglected stocks that has been overlooked by other analysts
  • The use of alternative types of data that permits new insight in the potential of a specific stock or group of stocks
  • A novel method of analysis that reveals hitherto hidden potential in a particular stock or group of stocks

One can think of examples of each of these possibilities, but at the same time it has to be admitted that the challenge is very considerable.  Firstly, your discovery or methodology would have to be one that has eluded some of the brightest minds in the investment industry.  That has happened in the past and will no doubt occur again in future;  but the analyst has to have a fairly high regard for his own intellect – or good fortune – to believe that the golden apple will fall into his lap, rather than another’s. Secondly there is the question of the efficient market hypothesis.  These days it is fashionable to pour scorn  on the EMH, with examples of well-known anomalies often used to justify the opprobrium. But the EMH doesn’t say that markets are 100% efficient, 100% of the time.  It says that markets are efficient, on average.  This  means that there will be times or circumstances in which the market will be efficient and other times and circumstances when it will be relatively inefficient – but you won’t be able to discern which condition the market is in currently.  Finally, even if one is successful in identifying such an opportunity, the benefit has to be realizable and economically significant.  I can think of several examples of equity strategies that appear to offer the potential to generate  alpha, but which turn out to be either unrealizable or economically insignificant after applying transaction costs.

All this is to say that stock picking is one of the most difficult challenges the analyst can undertake.  It is also one of the most interesting challenges – and best paid occupations – on Wall Street.  So it is unsurprising that for analysts it remains the focus of their research and ambition.  In this chapter we will look at some of the ways in which the Equities Entity Store can be used for such purposes and some of the more interesting analytical methods.

Why Technical Analysis Doesn’t Work

Technical Analysis is a very popular approach to analysing stocks.  Unfortunately, it is also largely useless, at least if the intention is to uncover potential sources of alpha.  The reason is not hard to understand: it relies on applying  analytical methods that have been known for decades to widely available public information (price data).  There  isn’t any source of competitive advantage that might reliably produce abnormal returns.  Even the possibility  of uncovering a gem amongst the stocks overlooked by other analysts appears increasingly remote these days, as the advent of computerized trading systems has facilitated the application of standard technical analysis tools on an industrial scale.  You don’t even need to understand how the indicators work – much less how to program them – in order to apply them to tens of thousands of stocks.  

And yet Technical Analysis remains very popular.  Why so?  The answer, I believe, is because it’s easy to do and can often look very pretty.  I will go further and admit that some of the indicators that analysts have devised are extraordinarily creative.  But they just don’t work.  In fact, I can’t think of another field of human industry that engages so many inventive minds in such a fruitless endeavor.  

All this has been clear for some time and yet every year legions of newly minted analysts fling themselves into the task of learning how to apply Technical Analysis to everything from cattle futures to cryptocurrencies.  Realistically, the chances of my making any kind of impression on this torrent of pointless hyperactivity are close to zero, but I will give it a go.

A Demonstration

Let’ s begin by picking a stock at random, one I haven’ t look at previously :

waterUtilities=Select[allListedStocks,#["Sector Information"]["GICS Industry"]== "Water Utilities"&]

We’ll extract a daily price series from 2017 to 2022 and plot an interactive trading chart, to which we can add moving averages, or any number of other technical indicators, as we wish:

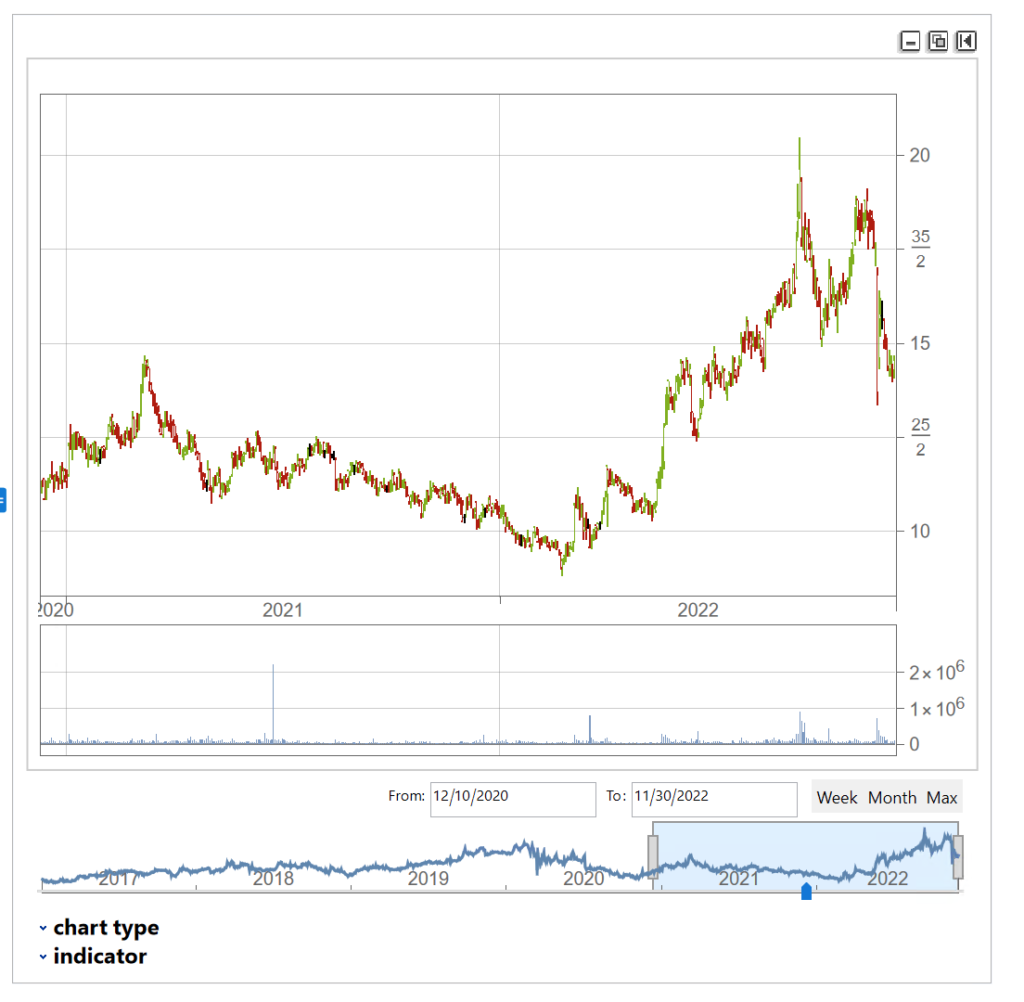
The chart shows several different types of pattern that are well-known to technical analysis, including trends, continuation patterns, gaps, double tops, etc

Let’ s look at the pattern of daily returns:

returns=Differences@Log[tsCWCO["PathComponent",4]["Values"]];
Histogram[returns]
stats=ReturnStatistics[returns]
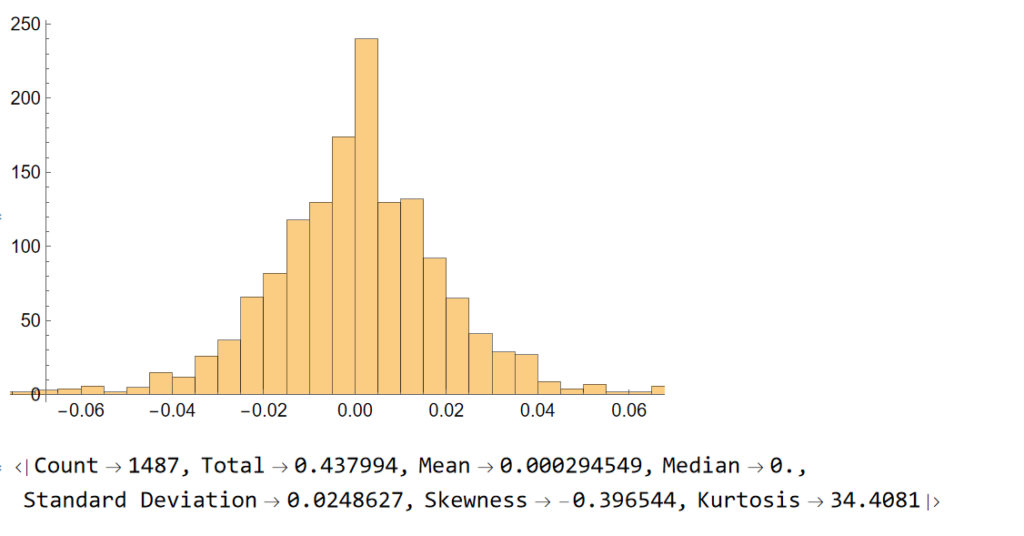
Next, we will generate a series of random returns, drawn from a Gaussian distribution with the same mean and standard deviation as the empirical returns series:

randomreturns=RandomVariate[NormalDistribution[stats["Mean"],stats["Standard Deviation"]],Length[returns]];
Histogram[randomreturns]
ReturnStatistics[randomreturns]
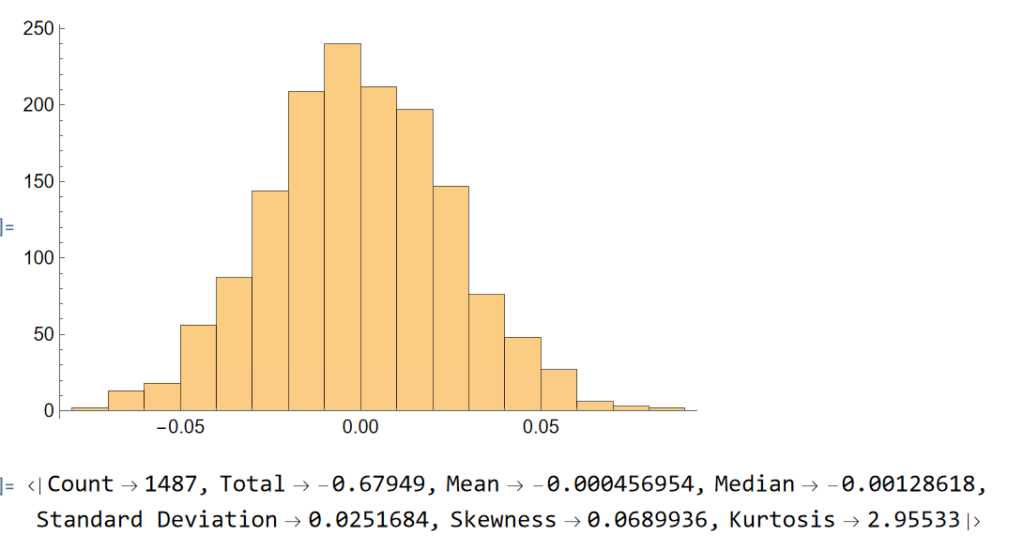
Clearly, the distribution of the generated returns differs from the distribution of empirical returns, but that doesn’t matter:  all that counts is that we can agree that the generated returns, which represent the changes in (log) prices from one day to the next, are completely random. Consequently, knowing the random returns, or prices,  at time t  = 1, 2, . . . , (t-1) in no way enables you to forecast the return , or price, at time t.

Now let’ s generate a series of synthetic prices  and time series, using the synthetic returns to calculate the prices for each period:

syntheticPrices=Exp[FoldList[Plus,Log[First[tsCWCO["FirstValues"]][[1;;4]]],Transpose[ConstantArray[returns,4]]]];

tsSynthetic=TimeSeries[ArrayFlatten@{{syntheticPrices,List/@tsCWCO["PathComponent",5]["Values"]}},{tsCWCO["Dates"]}]

InteractiveTradingChart[tsSynthetic]
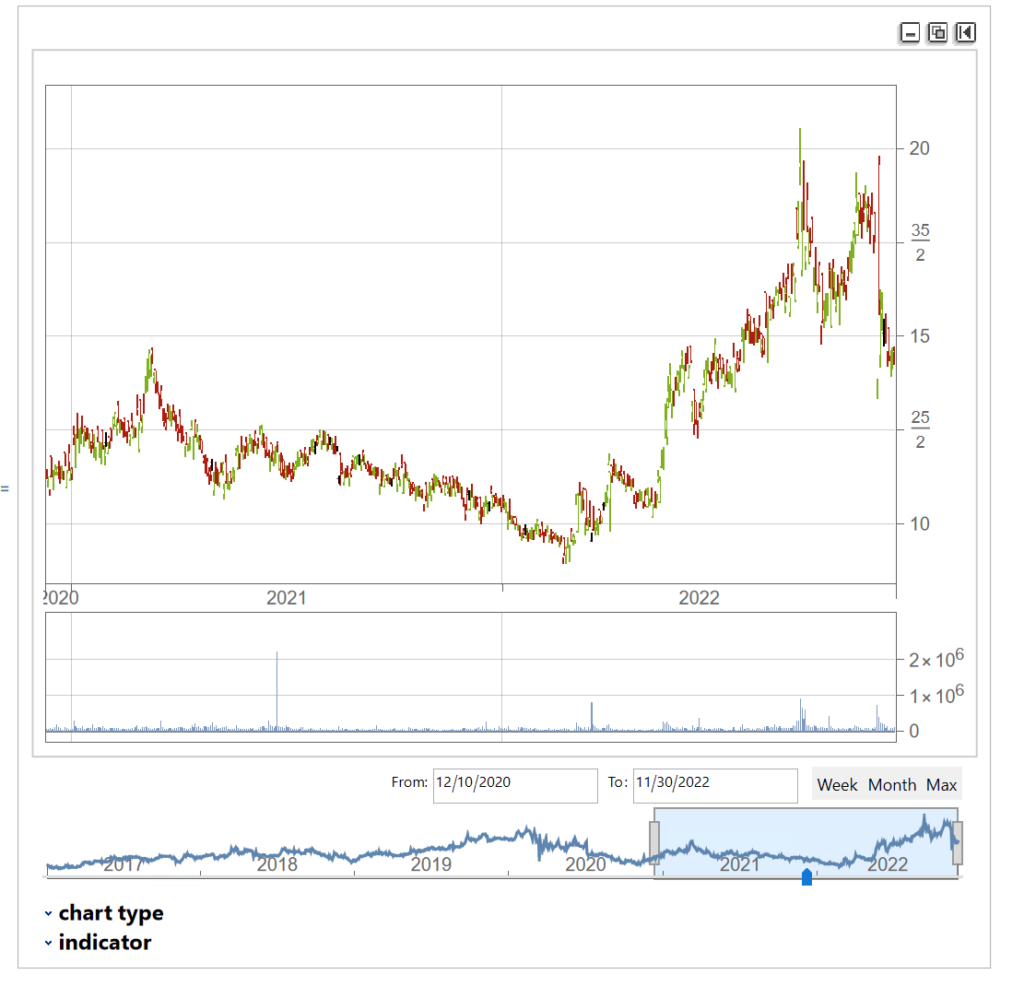
The synthetic time series is very similar to the original and displays many of the same characteristics, including classical patterns that are immediately comprehensible to a technical analyst, such as gaps, reversals , double tops, etc.

But the two time series, although similar,  are not identical:

tsCWCO===tsSynthetic

False

We knew this already, of course, because we used randomly generated returns to create the synthetic price series.  What this means is that, unlike for the real price series, in the case of the synthetic price series we know for certain that the movement in prices from one period to the next is entirely random.  So if prices continue in an upward trend after a gap, or decline after a double top formation appears on the chart of the synthetic series, that happens entirely by random chance, not in response to a pattern flagged by the technical indicator.  If we had generated a different set of random returns, we could just as easily have produced a synthetic price series in which prices reversed after a gap up, or continued higher after a double-top formation.  Critics of Technical Analysis do not claim that patterns such as gaps, head and shoulders , etc., do not exist – they clearly do.  Rather, we say that such patterns are naturally occurring phenomena that will arise even in a series known to be completely random and hence can have no economic significance.

The point is not to say that technical signals never work: sometimes they do and sometimes they don’t.  Rather, the point is that, in any given situation, you will be unable to tell whether the signal is going to work this time, or not – because price changes are  dominated by random variation.  

You can make money in the markets using technical analysis, just as you can by picking stocks at random, throwing darts at a dartboard, or tossing a coin to decide which to buy or sell – i.e. by dumb luck.  But you can’t reliably make money this way.

  • More on the efficient market hypothesis
  • More from the Society of Technical Analysts

Yes, You Can Time the Market. How it Works, And Why

One of the most commonly cited maxims is that market timing is impossible.  In fact, empirical evidence makes a compelling case that market timing is feasible and can yield substantial economic benefits.  What’s more, we even understand why it works.  For the typical portfolio investor, applying simple techniques to adjust their market exposure can prevent substantial losses during market downturns.

The Background From Empirical and Theoretical Research

For the last fifty years, since the work of Paul Samuelson, the prevailing view amongst economists has been that markets are (mostly) efficient and follow a random walk. Empirical evidence to the contrary was mostly regarded as anomalous and/or unimportant economically.  Over time, however, evidence has accumulated that market effects may persist that are exploitable. The famous 1992 paper published by Fama and French, for example, identified important economic effects in stock returns due to size and value factors, while Cahart (1997) demonstrated the important incremental effect of momentum.  The combined four-factor Cahart model explains around 50% of the variation in stock returns, but leaves a large proportion that cannot be accounted for.

Other empirical studies have provided evidence that stock returns are predictable at various frequencies.  Important examples include work by Brock, Lakonishok and LeBaron (1992), Pesaran and Timmermann (1995) and Lo, Mamaysky and Wang (2000), who provide further evidence using a range of technical indicators with wide popularity among traders showing that this adds value even at the individual stock level over and above the performance of a stock index.  The research in these and other papers tends to be exceptional in term of both quality and comprehensiveness, as one might expect from academics risking their reputations in taking on established theory.  The appendix of test results to the Pesaran and Timmermann study, for example, is so lengthy that is available only in CD-ROM format.

A more recent example is the work of Paskalis Glabadanidis, in a 2012 paper entitled Market Timing with Moving Averages.  Glabadanidis examines a simple moving average strategy that, he finds, produces economically and statistically significant alphas of 10% to 15% per year, after transaction costs, and which are largely insensitive to the four Cahart factors. 

Glabadanidis reports evidence regarding the profitability of the MA strategy in seven international stock markets. The performance of the MA strategies also holds for more than 18,000 individual stocks. He finds that:

“The substantial market timing ability of the MA strategy appears to be the main driver of the abnormal returns.”

An Illustration of a Simple Marketing Timing Strategy in SPY

It is impossible to do justice to Glabadanidis’s research in a brief article and the interested reader is recommended to review the paper in full.  However, we can illustrate the essence of the idea using the SPY ETF as an example.   

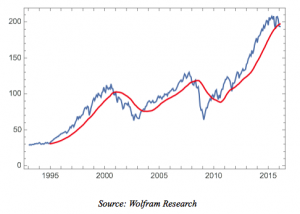
A 24-period moving average of the monthly price series over the period from 1993 to 2016 is plotted in red in the chart below.

Fig1

The moving average indicator is used to time the market using the following simple rule:

if Pt >= MAt  invest in SPY in month t+1

if Pt < MAt  invest in T-bills in month t+1

In other words, we invest or remain invested in SPY when the monthly closing price of the ETF lies at or above the 24-month moving average, otherwise we switch our investment to T-Bills.

The process of switching our investment will naturally incur transaction costs and these are included in the net monthly returns.

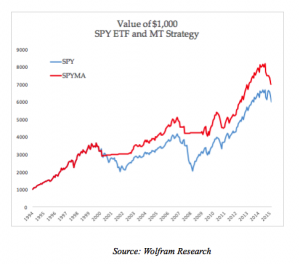
The outcome of the strategy in terms of compound growth is compared to the original long-only SPY investment in the following chart.

Fig2

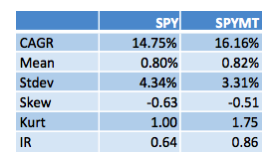
The marketing timing strategy outperforms the long-only ETF,  with a CAGR of 16.16% vs. 14.75% (net of transaction costs), largely due to its avoidance of the major market sell-offs in 2000-2003 and 2008-2009.

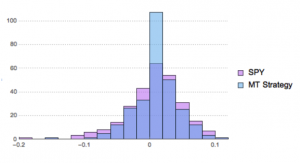
But the improvement isn’t limited to a 141bp improvement in annual compound returns.  The chart below compares the distributions of monthly returns in the SPY ETF and market timing strategy.

Fig3

It is clear that, in addition to a higher average monthly return, the market timing strategy has lower dispersion in the distribution in returns.  This leads to a significantly higher information ratio for the strategy compared to the long-only ETF.  Nor is that all:  the market timing strategy has both higher skewness and kurtosis, both desirable features.

Fig4

These results are entirely consistent with Glabadanidis’s research.  He finds that the performance of the market timing strategy is robust to different lags of the moving average and in subperiods, while investor sentiment, liquidity risks, business cycles, up and down markets, and the default spread cannot fully account for its performance. The strategy works just as well with randomly generated returns and bootstrapped returns as it does for the more than 18,000 stocks in the study.

A follow-up study by the author applying the same methodology to a universe of 20 REIT indices and 274 individual REITs reaches largely similar conclusions.

Why Marketing Timing Works

For many investors, empirical evidence – compelling though it may be – is not enough to make market timing a credible strategy, absent some kind of “fundamental” explanation of why it works.  Unusually, in the case of the simple moving average strategy, such explanation is possible.

It was Cox, Ross and Rubinstein who in 1979 developed the binomial model as a numerical method for pricing options.  The methodology relies on the concept of option replication, in which one constructs a portfolio comprising holdings of the underlying stock and bonds to produce the same cash flows as the option at every point in time (the proportion of stock to hold is given by the option delta).  Since the replicating portfolio produces the same cash flows as the option, it must have the same value and since once knows the price of the stock and bond at each point in time one can therefore price the option.  For those interested in the detail, Wikipedia gives a detailed explanation of the technique.

We can apply the concept of option replication to construct something very close the MA market timing strategy, as follows.  Consider what happens when the ETF falls below the moving average level.  In that case we convert the ETF portfolio to cash and use the proceeds to acquire T-Bills.  An equivalent outcome would be achieved by continuing to hold our long ETF position and acquiring a put option to hedge it.  The combination of a long ETF position, and a 1-month put option with delta of -1, would provide the same riskless payoff as the market timing strategy, i.e. the return on 30-day T-Bills.  An option in which the strike price is based on the average price of the underlying is known as an Arithmetic Asian option.    Hence when we apply the MA timing strategy we are effectively constructing a dynamic portfolio that replicates the payoff of an Arithmetic Asian protective put option struck as (just above) the moving average level.

Market Timing Alpha and The Cost of Hedging

None of this explanation is particularly contentious – the theory behind option replication through dynamic hedging is well understood – and it provides a largely complete understanding of the way the MA market timing strategy works, one that should satisfy those who are otherwise unpersuaded by arguments purely from empirical research.

There is one aspect of the foregoing description that remains a puzzle, however.  An option is a valuable financial instrument and the owner of a protective put of the kind described can expect to pay a price amounting to tens or perhaps hundreds of basis points.  Of course, in the market timing strategy we are not purchasing a put option per se, but creating one synthetically through dynamic replication.  The cost of creating this synthetic equivalent comprises the transaction costs incurred as we liquidate and re-assemble our portfolio from month to month, in the form of bid/ask spread and commissions.  According to efficient market theory, one should be indifferent as to whether one purchases the option at a fair market price or constructs it synthetically through replication – the cost should be equivalent in either case.  And yet in empirical tests the cost of the synthetic protective put falls far short of what one would expect to pay for an equivalent option instrument.  This is, in fact, the source of the alpha in the market timing strategy.

According to efficient market theory one might expect to pay something of the order of 140 basis points a year in transaction costs – the difference between the CAGR of the market timing strategy and the SPY ETF – in order to construct the protective put.  Yet, we find that no such costs are incurred.

Now, it might be argued that there is a hidden cost not revealed in our simple study of a market timing strategy applied to a single underlying ETF, which is the potential costs that could be incurred if the ETF should repeatedly cross and re-cross the level of the moving average, month after month.  In those circumstances the transaction costs would be much higher than indicated here.  The fact that, in a single example, such costs do not arise does not detract in any way from the potential for such a scenario to play out. Therefore, the argument goes, the actual costs from the strategy are likely to prove much higher over time, or when implemented for a large number of stocks.

All well and good, but this is precisely the scenario that Glabadanidis’s research addresses, by examining the outcomes, not only for tens of thousands of stocks, but also using a large number of scenarios generated from random and/or bootstrapped returns.  If the explanation offered did indeed account for the hidden costs of hedging, it would have been evident in the research findings.

Instead, Glabadanidis concludes:

“This switching strategy does not involve any heavy trading when implemented with break-even transaction costs, suggesting that it will be actionable even for small investors.”

Implications For Current Market Conditions

As at the time of writing, in mid-February 2016, the price of the SPY ETF remains just above the 24-month moving average level.  Consequently the market timing strategy implies one should continue to hold the market portfolio for the time being, although that could change very shortly, given recent market action.

Conclusion

The empirical evidence that market timing strategies produce significant alphas is difficult to challenge.  Furthermore, we have reached an understanding of why they work, from an application of widely accepted option replication theory. It appears that using a simple moving average to time market entries and exits is approximately equivalent to hedging a portfolio with a protective Arithmetic Asian put option.

What remains to be answered is why the cost of constructing put protection synthetically is so low.  At the current time, research indicates that market timing strategies consequently are able to generate alphas of 10% to 15% per annum.

References

  1. Brock, W., Lakonishok, J., LeBaron, B., 1992, “Simple Technical Trading Rules and the Stochastic Properties of Stock Returns,” Journal of Finance 47, pp. 1731-1764.
  2. Carhart, M. M., 1997, “On Persistence in Mutual Fund Performance,” Journal of Finance 52, pp. 57–82.

  3. Fama, E. F., French, K. R., 1992, “The Cross-Section of Expected Stock Returns,” Journal of Finance 47(2), 427–465
  4. Glabadanidis, P., 2012, “Market Timing with Moving Averages”, 25th Australasian Finance and Banking Conference.
  5. Glabadanidis, P., 2012, “The Market Timing Power of Moving Averages: Evidence from US REITs and REIT Indexes”, University of Adelaide Business School.
  6. Lo, A., Mamaysky, H., Wang, J., 2000, “Foundations of Technical Analysis: Computational Algorithms, Statistical Inference, and Empirical Implementation,” Journal of Finance 55, 1705–1765.
  7. Pesaran, M.H., Timmermann, A.G., 1995, “Predictability of Stock Returns: Robustness and Economic Significance”, Journal of Finance, Vol. 50 No. 4