A High Frequency Scalping Strategy on Collective2

Scalping vs. Market Making

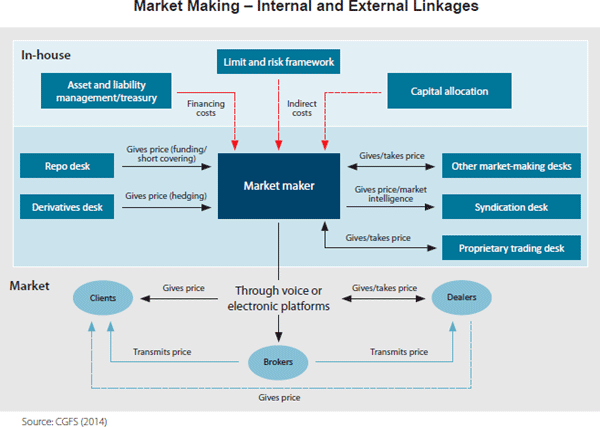
A market-making strategy is one in which the system continually quotes on the bid and offer and looks to make money from the bid-offer spread (and also, in the case of equities, rebates).  During a typical trading day, inventories will build up on the long or short side of the book as the market trades up and down.  There is no intent to take a market view as such, but most sophisticated market making strategies will use microstructure models to help decide whether to “lean” on the bid or offer at any given moment. Market makers may also shade their quotes to reduce the buildup of inventory, or even pull quotes altogether if they suspect that informed traders are trading against them (a situation referred to as “toxic flow”).  They can cover short positions through the repo desk and use derivatives to hedge out the risk of an accumulated inventory position.

marketmaking

A scalping strategy shares some of the characteristics of  a market making strategy:  it will typically be mean reverting, seeking to enter passively on the bid or offer and the average PL per trade is often in the region of a single tick.  But where a scalping strategy differs from market making is that it does take a view as to when to get long or short the market, although that view may change many times over the course of a trading session.  Consequently, a scalping strategy will only ever operate on one side of the market at a time, working the bid or offer; and it will typically never build inventory, since will it usually reverse and later try to sell for a profit the inventory it has previously purchased, hopefully at a lower price.

In terms of performance characteristics, a market making strategy will often have a double-digit Sharpe Ratio, which means that it may go for many days, weeks, or months, without taking a loss.  Scalping is inherently riskier, since it is taking directional bets, albeit over short time horizons.  With a Sharpe Ratio in the region of 3 to 5, a scalping strategy will often experience losing days and even losing months.

So why prefer scalping to market making?  It’s really a question of capability.  Competitive advantage in scalping derives from the successful exploitation of identified sources of alpha, whereas  market making depends primarily on speed and execution capability. Market making requires HFT infrastructure with latency measured in microseconds, the ability to layer orders up and down the book and manage order priority.  Scalping algos are generally much less demanding in terms of trading platform requirements: depending on the specifics of the system, they can be implemented successfully on many third party networks.

Developing HFT Futures Strategies

Some time ago my firm Systematic Strategies began research and development on a number of HFT strategies in futures markets.  Our primary focus has always been HFT equity strategies, so this was something of a departure for us, one that has entailed a significant technological obstacles (more on this in due course). Amongst the strategies we developed were several very profitable scalping algorithms in fixed income futures.  The majority trade at high frequency, with short holding periods measured in seconds or minutes, trading tens or even hundreds of times a day.
xtraderThe next challenge we faced was what to do with our research product.  As a proprietary trading firm our first instinct was to trade the strategies ourselves; but the original intent had been to develop strategies that could provide the basis of a hedge fund or CTA offering.  Many HFT strategies are unsuitable for that purpose, since the technical requirements exceed the capabilities of the great majority of standard trading platforms typically used by managed account investors. Besides, HFT strategies typically offer too limited capacity to be interesting to larger, institutional investors.

In the end we arrived at a compromise solution, keeping the highest frequency strategies in-house, while offering the lower frequency strategies to outside investors. This enabled us to keep the limited capacity of the highest frequency strategies for our own trading, while offering investors significant capacity in strategies that trade at lower frequencies, but still with very high performance characteristics.

HFT Bond Scalping

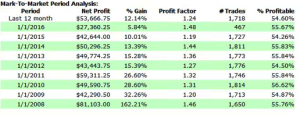
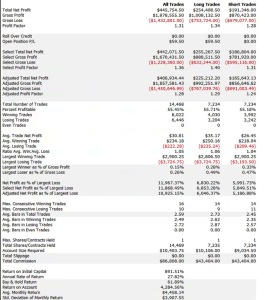
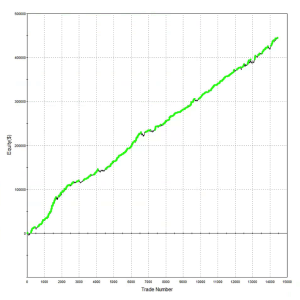
A typical example is the following scalping strategy in US Bond Futures.  The strategy combines two of the lower frequency algorithms we developed for bond futures that scalp around 10 times per session.  The strategy attempts to take around 8 ticks out of the market on each trade and averages around 1 tick per trade.   With a Sharpe Ratio of over 3, the strategy has produced net profits of approximately $50,000 per contract per year, since 2008.    A pleasing characteristic of this and other scalping strategies is their consistency:  There have been only 10 losing months since January 2008, the last being a loss of $7,100 in Dec 2015 (the prior loss being $472 in July 2013!)

Annual P&L

Fig2

Strategy Performance

fig4Fig3


Offering The Strategy to Investors on Collective2

The next challenge for us to solve was how best to introduce the program to potential investors.  Systematic Strategies is not a CTA and our investors are typically interested in equity strategies.  It takes a great deal of hard work to persuade investors that we are able to transfer our expertise in equity markets to the very different world of futures trading. While those efforts are continuing with my colleagues in Chicago, I decided to conduct an experiment:  what if we were to offer a scalping strategy through an online service like Collective2?  For those who are unfamiliar, Collective2 is an automated trading-system platform that allowed the tracking, verification, and auto-trading of multiple systems.  The platform keeps track of the system profit and loss, margin requirements, and performance statistics.  It then allows investors to follow the system in live trading, entering the system’s trading signals either manually or automatically.

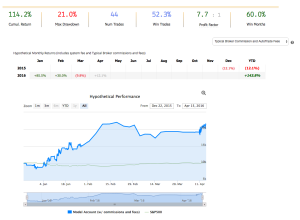
Offering a scalping strategy on a platform like this certainly creates visibility (and a credible track record) with investors; but it also poses new challenges.  For example, the platform assumes trading cost of around $14 per round turn, which is at least 2x more expensive than most retail platforms and perhaps 3x-5x more expensive than the cost a HFT firm might pay.  For most scalping strategies that are designed to take a tick out of the market such high fees would eviscerate the returns.  This motivated our choice of US Bond Futures, since the tick size and average trade are sufficiently large to overcome even this level of trading friction.  After a couple of false starts, during which we played around with the algorithms and boosted strategy profitability with a couple of low frequency trades, the system is now happily humming along and demonstrating the kind of performance it should (see below).

For those who are interested in following the strategy’s performance, the link on collective2 is here.


Collective2Perf

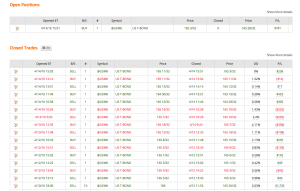
trades

Disclaimer

About the results you see on this Web site

Past results are not necessarily indicative of future results.

These results are based on simulated or hypothetical performance results that have certain inherent limitations. Unlike the results shown in an actual performance record, these results do not represent actual trading. Also, because these trades have not actually been executed, these results may have under-or over-compensated for the impact, if any, of certain market factors, such as lack of liquidity. Simulated or hypothetical trading programs in general are also subject to the fact that they are designed with the benefit of hindsight. No representation is being made that any account will or is likely to achieve profits or losses similar to these being shown.

In addition, hypothetical trading does not involve financial risk, and no hypothetical trading record can completely account for the impact of financial risk in actual trading. For example, the ability to withstand losses or to adhere to a particular trading program in spite of trading losses are material points which can also adversely affect actual trading results. There are numerous other factors related to the markets in general or to the implementation of any specific trading program, which cannot be fully accounted for in the preparation of hypothetical performance results and all of which can adversely affect actual trading results.

Material assumptions and methods used when calculating results

The following are material assumptions used when calculating any hypothetical monthly results that appear on our web site.

  • Profits are reinvested. We assume profits (when there are profits) are reinvested in the trading strategy.
  • Starting investment size. For any trading strategy on our site, hypothetical results are based on the assumption that you invested the starting amount shown on the strategy’s performance chart. In some cases, nominal dollar amounts on the equity chart have been re-scaled downward to make current go-forward trading sizes more manageable. In these cases, it may not have been possible to trade the strategy historically at the equity levels shown on the chart, and a higher minimum capital was required in the past.
  • All fees are included. When calculating cumulative returns, we try to estimate and include all the fees a typical trader incurs when AutoTrading using AutoTrade technology. This includes the subscription cost of the strategy, plus any per-trade AutoTrade fees, plus estimated broker commissions if any.
  • “Max Drawdown” Calculation Method. We calculate the Max Drawdown statistic as follows. Our computer software looks at the equity chart of the system in question and finds the largest percentage amount that the equity chart ever declines from a local “peak” to a subsequent point in time (thus this is formally called “Maximum Peak to Valley Drawdown.”) While this is useful information when evaluating trading systems, you should keep in mind that past performance does not guarantee future results. Therefore, future drawdowns may be larger than the historical maximum drawdowns you see here.

Trading is risky

There is a substantial risk of loss in futures and forex trading. Online trading of stocks and options is extremely risky. Assume you will lose money. Don’t trade with money you cannot afford to lose.

Signal Processing and Sample Frequency

The Importance of Sample Frequency

Too often we apply a default time horizon for our trading, whether it below (daily, weekly) or higher (hourly, 5 minute) frequency.  Sometimes the choice is dictated by practical considerations, such as a desire to avoid overnight risk, or the (lack of0 availability of low-latency execution platform.

But there is an alternative approach to the trade frequency decision that often yields superior results in terms of trading performance.    The methodology derives from signal processing and the idea essentially is to use Fourier transforms to help identify the cyclical behavior of the strategy alpha and hence determine the best time-frames for sampling and trading.  I wrote about this is a previous blog post, in which I described how to use principal components analysis to investigate the factors driving the returns in various pairs trading strategies.  Here I want to take a simpler approach, in which we use Fourier analysis to select suitable sample frequencies.  The idea is simply to select sample frequencies where the signal strength appears strongest, in the hope that it will lead to superior performance characteristics in what strategy we are trying to develop.

Signal Decomposition for S&P500 eMini Futures

Let’s take as an example the S&P 500 emini futures contract. The chart below shows the continuous ES futures contract plotted at 1-minute intervals from 1998. At the bottom of the chart I have represented the signal analysis as a bar chart (in blue), with each bar representing the amplitude at each frequency. The white dots on the chart identify frequencies that are spaced 10 minutes apart.  It is immediately evident that local maxima in the spectrum occur around 40 mins, 60 mins and 120 mins.  So a starting point for our strategy research might be to look at emini data sampled at these frequencies.  Incidentally, it is worth pointing out that I have restricted the session times to 7AM – 4PM EST, which is where the bulk of the daily volume and liquidity tend to occur.  You may get different results if you include data from the Globex session.

Emini Signal

This is all very intuitive and unsurprising: the clearest signals occur at frequencies that most traders typically tend to trade, using hourly data, for example. Any strategy developer is already quite likely to consider these and other common frequencies as part of their regular research process.  There are many instances of successful trading strategies built on emini data sampled at 60 minute intervals.

SSALGOTRADING AD

Signal Decomposition for US Bond Futures

Let’s look at a rather more interesting example:  US (30 year) Bond futures. Unlike the emini contract, the spectral analysis of the US futures contract indicates that the strongest signal by far occurs at a frequency of around 47 minutes.  This is decidedly an unintuitive outcome – I can’t think of any reason why such a strong signal should appear at this cycle length, but, statistically it does. 

US Bond futures

Does it work?  Readers can judge for themselves:  below is an example of an equity curve for a strategy on US futures sampled at 47 minute frequency over the period from 2002.  The strategy has performed very consistently, producing around $25,000 per contract per year, after commissions and slippage.

US futures EC

Conclusion

While I have had similar success with products as diverse as Corn and VIX futures, the frequency domain approach is by no means a panacea:  there are plenty of examples where I have been unable to construct profitable strategies for data sampled at the frequencies with very strong signals. Conversely, I have developed successful strategies using data at frequencies that hardly registered at all on the spectrum, but which I selected for other reasons.  Nonetheless, spectral analysis (and signal processing in general) can be recommended as a useful tool in the arsenal of any quantitative analyst.

Developing High Performing Trading Strategies with Genetic Programming

One of the frustrating aspects of research and development of trading systems is that there is never enough time to investigate all of the interesting trading ideas one would like to explore. In the early 1970’s, when a moving average crossover system was considered state of the art, it was relatively easy to develop profitable strategies using simple technical indicators. Indeed, research has shown that the profitability of simple trading rules persisted in foreign exchange and other markets for a period of decades. But, coincident with the advent of the PC in the late 1980’s, such simple strategies began to fail. The widespread availability of data, analytical tools and computing power has, arguably, contributed to the increased efficiency of financial markets and complicated the search for profitable trading ideas. We are now at a stage where is can take a team of 5-6 researchers/developers, using advanced research techniques and computing technologies, as long as 12-18 months, and hundreds of thousands of dollars, to develop a prototype strategy. And there is no guarantee that the end result will produce the required investment returns.

The lengthening lead times and rising cost and risk of strategy research has obliged trading firms to explore possibilities for accelerating the R&D process. One such approach is Genetic Programming.

Early Experiences with Genetic Programming
I first came across the GP approach to investment strategy in the late 1990s, when I began to work with Haftan Eckholdt, then head of neuroscience at Yeshiva University in New York. Haftan had proposed creating trading strategies by applying the kind of techniques widely used to analyze voluminous and highly complex data sets in genetic research. I was extremely skeptical of the idea and spent the next 18 months kicking the tires very hard indeed, of behalf of an interested investor. Although Haftan’s results seemed promising, I was fairly sure that they were the product of random chance and set about devising tests that would demonstrate that.

SSALGOTRADING AD

One of the challenges I devised was to create data sets in which real and synthetic stock series were mixed together and given to the system evaluate. To the human eye (or analyst’s spreadsheet), the synthetic series were indistinguishable from the real thing. But, in fact, I had “planted” some patterns within the processes of the synthetic stocks that made them perform differently from their real-life counterparts. Some of the patterns I created were quite simple, such as introducing a drift component. But other patterns were more nuanced, for example, using a fractal Brownian motion generator to induce long memory in the stock volatility process.

It was when I saw the system detect and exploit the patterns buried deep within the synthetic series to create sensible, profitable strategies that I began to pay attention. A short time thereafter Haftan and I joined forces to create what became the Proteom Fund.

That Proteom succeeded at all was a testament not only to Haftan’s ingenuity as a researcher, but also to his abilities as a programmer and technician. Processing such large volumes of data was a tremendous challenge at that time and required a cluster of 50 cpu’s networked together and maintained with a fair amount of patch cable and glue. We housed the cluster in a rat-infested warehouse in Brooklyn that had a very pleasant view of Manhattan, but no a/c. The heat thrown off from the cluster was immense, and when combined with very loud rap music blasted through the walls by the neighboring music studios, the effect was debilitating. As you might imagine, meetings with investors were a highly unpredictable experience. Fortunately, Haftan’s intellect was matched by his immense reserves of fortitude and patience and we were able to attract investments from several leading institutional investors.

The Genetic Programming Approach to Building Trading Models

Genetic programming is an evolutionary-based algorithmic methodology which can be used in a very general way to identify patterns or rules within data structures. The GP system is given a set of instructions (typically simple operators like addition and subtraction), some data observations and a fitness function to assess how well the system is able to combine the functions and data to achieve a specified goal.

In the trading strategy context the data observations might include not only price data, but also price volatility, moving averages and a variety of other technical indicators. The fitness function could be something as simple as net profit, but might represent alternative measures of profitability or risk, with factors such as PL per trade, win rate, or maximum drawdown. In order to reduce the danger of over-fitting, it is customary to limit the types of functions that the system can use to simple operators (+,-,/,*), exponents, and trig functions. The length of the program might also be constrained in terms of the maximum permitted lines of code.

We can represent what is going on using a tree graph:

Tree

In this example the GP system is combining several simple operators with the Sin and Cos trig functions to create a signal comprising an expression in two variables, X and Y, which may be, for example, stock prices, moving averages, or technical indicators of momentum or mean reversion.
The “evolutionary” aspect of the GP process derives from the idea that an existing signal or model can be mutated by replacing nodes in a branch of a tree, or even an entire branch by another. System performance is re-evaluated using the fitness function and the most profitable mutations are retained for further generation.
The resulting models are often highly non-linear and can be very general in form.

A GP Daytrading Strategy
The last fifteen years has seen tremendous advances in the field of genetic programming, in terms of the theory as well as practice. Using a single hyper-threaded CPU, it is now possible for a GP system to generate signals at a far faster rate than was possible on Proteom’s cluster of 50 networked CPUs. A researcher can develop and evaluate tens of millions of possible trading algorithms with the space of a few hours. Implementing a thoroughly researched and tested strategy is now feasible in a matter of weeks. There can be no doubt of GP’s potential to produce dramatic reductions in R&D lead times and costs. But does it work?

To address that question I have summarized below the performance results from a GP-developed daytrading system that trades nine different futures markets: Crude Oil (CL), Euro (EC), E-Mini (ES), Gold (GC), Heating Oil (HO), Coffee (KC), Natural gas (NG), Ten Year Notes (TY) and Bonds (US). The system trades a single contract in each market individually, going long and short several times a day. Only the most liquid period in each market is traded, which typically coincides with the open-outcry session, with any open positions being exited at the end of the session using market orders. With the exception of the NG and HO markets, which are entered using stop orders, all of the markets are entered and exited using standard limit orders, at prices determined by the system

The system was constructed using 15-minute bar data from Jan 2006 to Dec 2011 and tested out-of-sample of data from Jan 2012 to May 2014. The in-sample span of data was chosen to cover periods of extreme market stress, as well as less volatile market conditions. A lengthy out-of-sample period, almost half the span of the in-sample period, was chosen in order to evaluate the robustness of the system.
Out-of-sample testing was “double-blind”, meaning that the data was not used in the construction of the models, nor was out-of-sample performance evaluated by the system before any model was selected.

Performance results are net of trading commissions of $6 per round turn and, in the case of HO and NG, additional slippage of 2 ticks per round turn.

Ann Returns Risk

Value 1000 Sharpe

Performance

(click on the table for a higher definition view)

The most striking feature of the strategy is the high rate of risk-adjusted returns, as measured by the Sharpe ratio, which exceeds 5 in both in-sample and out-of-sample periods. This consistency is a reflection of the fact that, while net returns fall from an annual average of over 29% in sample to around 20% in the period from 2012, so, too, does the strategy volatility decline from 5.35% to 3.86% in the respective periods. The reduction in risk in the out-of-sample period is also reflected in lower Value-at-Risk and Drawdown levels.

A decline in the average PL per trade from $25 to $16 in offset to some degree by a slight increase in the rate of trading, from 42 to 44 trades per day, on average, while daily win rate and percentage profitable trades remain consistent at around 65% and 56%, respectively.

Overall, the system appears to be not only highly profitable, but also extremely robust. This is impressive, given that the models were not updated with data after 2011, remaining static over a period almost half as long as the span of data used in their construction. It is reasonable to expect that out-of-sample performance might be improved by allowing the models to be updated with more recent data.

Benefits and Risks of the GP Approach to Trading System Development
The potential benefits of the GP approach to trading system development include speed of development, flexibility of design, generality of application across markets and rapid testing and deployment.

What about the downside? The most obvious concern is the risk of over-fitting. By allowing the system to develop and test millions of models, there is a distinct risk that the resulting systems may be too closely conditioned on the in-sample data, and will fail to maintain performance when faced with new market conditions. That is why, of course, we retain a substantial span of out-of-sample data, in order to evaluate the robustness of the trading system. Even so, given the enormous number of models evaluated, there remains a significant risk of over-fitting.

Another drawback is that, due to the nature of the modelling process, it can be very difficult to understand, or explain to potential investors, the “market hypothesis” underpinning any specific model. “We tested it and it works” is not a particularly enlightening explanation for investors, who are accustomed to being presented with a more articulate theoretical framework, or investment thesis. Not being able to explain precisely how a system makes money is troubling enough in good times; but in bad times, during an extended drawdown, investors are likely to become agitated very quickly indeed if no explanation is forthcoming. Unfortunately, evaluating the question of whether a period of poor performance is temporary, or the result of a breakdown in the model, can be a complicated process.

Finally, in comparison with other modeling techniques, GP models suffer from an inability to easily update the model parameters based on new data as it become available. Typically, as GP model will be to rebuilt from scratch, often producing very different results each time.

Conclusion
Despite the many limitations of the GP approach, the advantages in terms of the speed and cost of researching and developing original trading signals and strategies have become increasingly compelling.

Given the several well-documented successes of the GP approach in fields as diverse as genetics and physics, I think an appropriate position to take with respect to applications within financial market research would be one of cautious optimism.