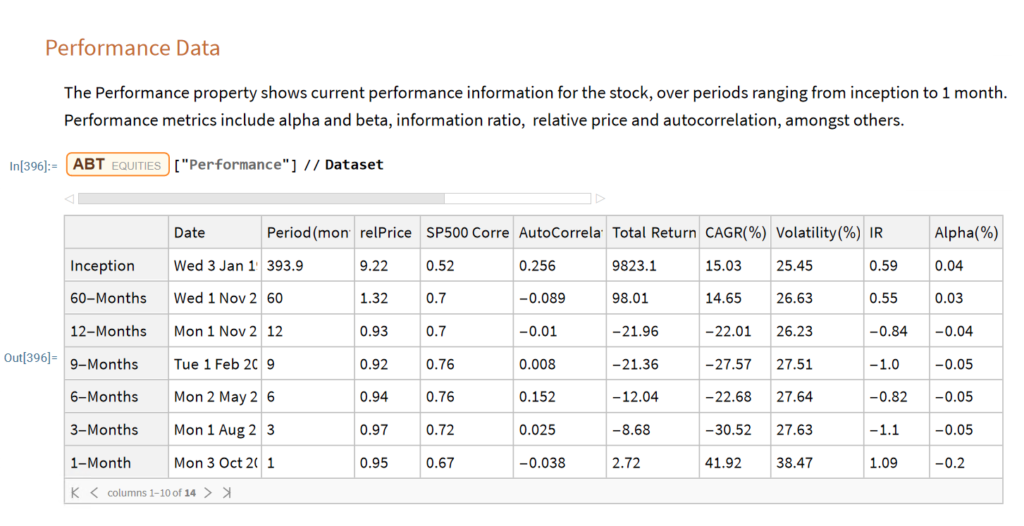
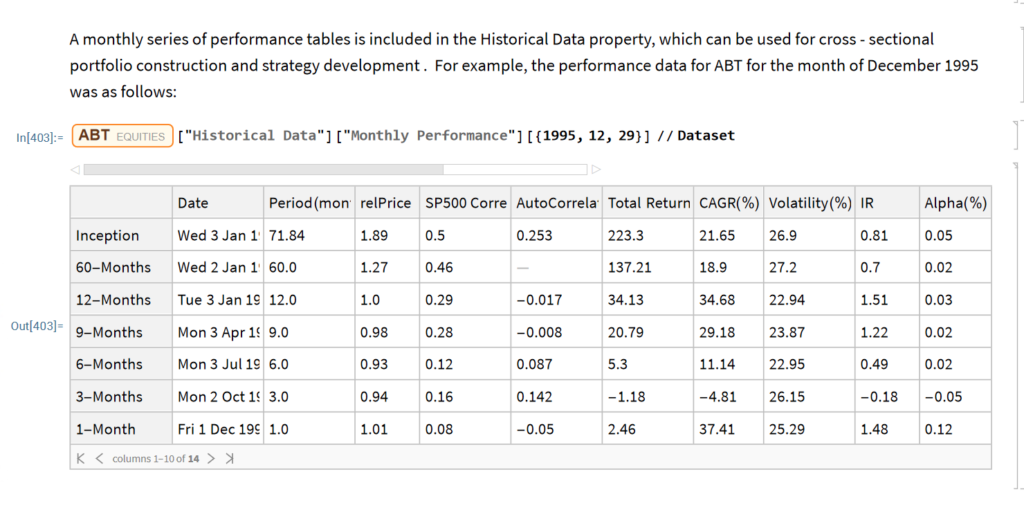
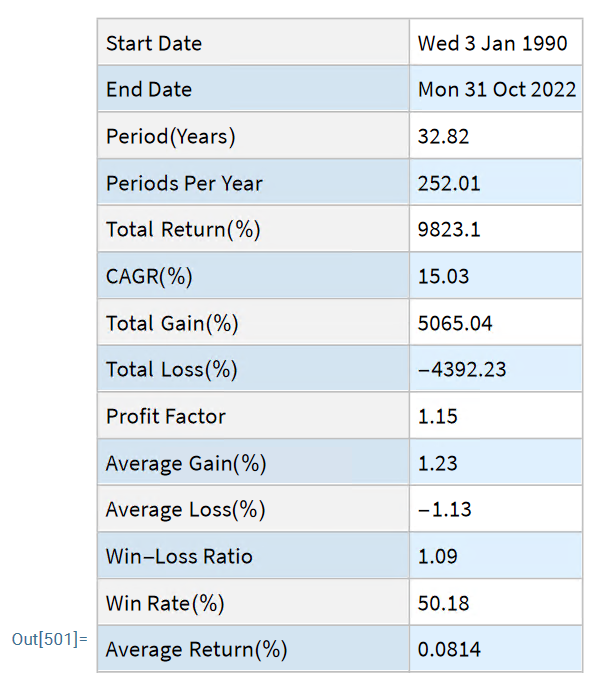
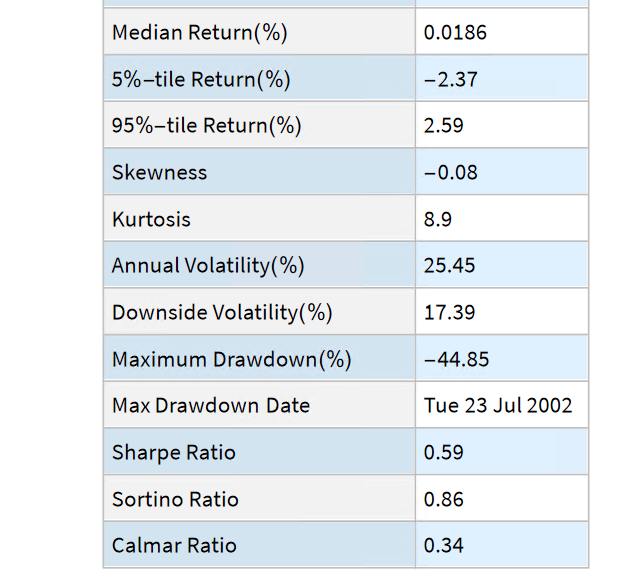
Equity Analytics in the Equities Data Store

Equities Entity Store  – A Brief Review

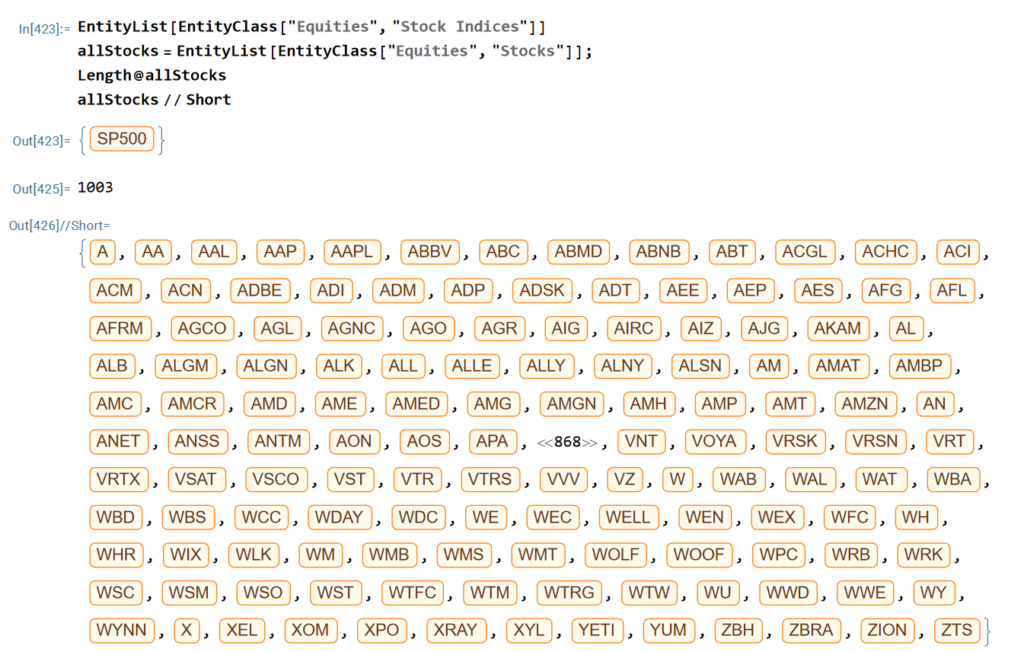
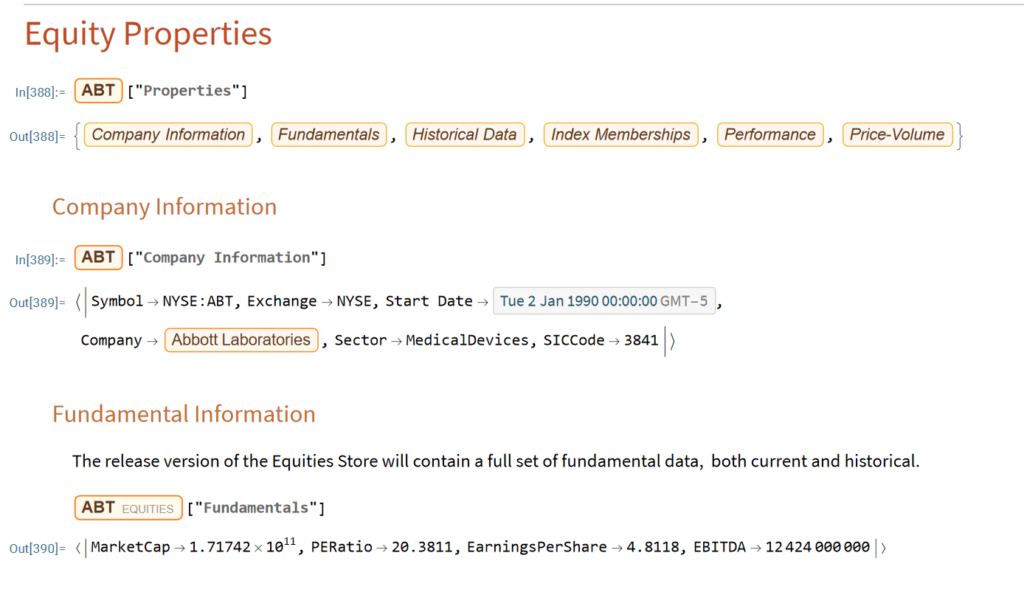
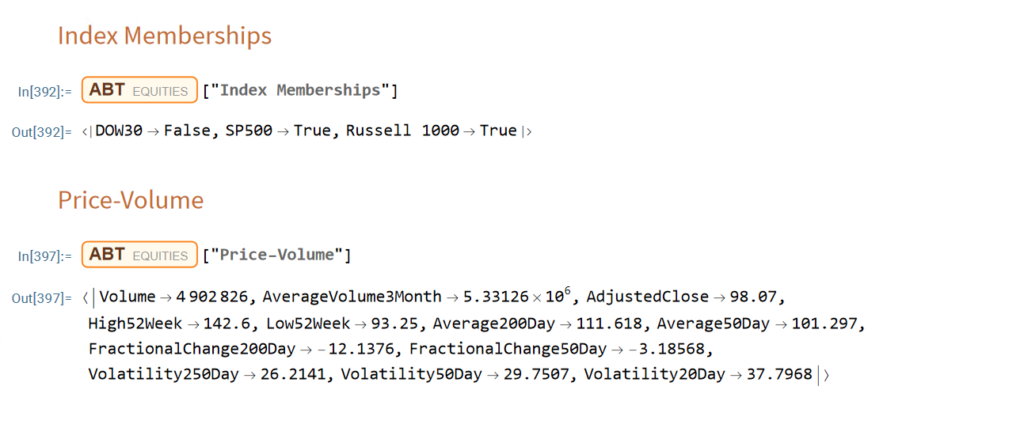
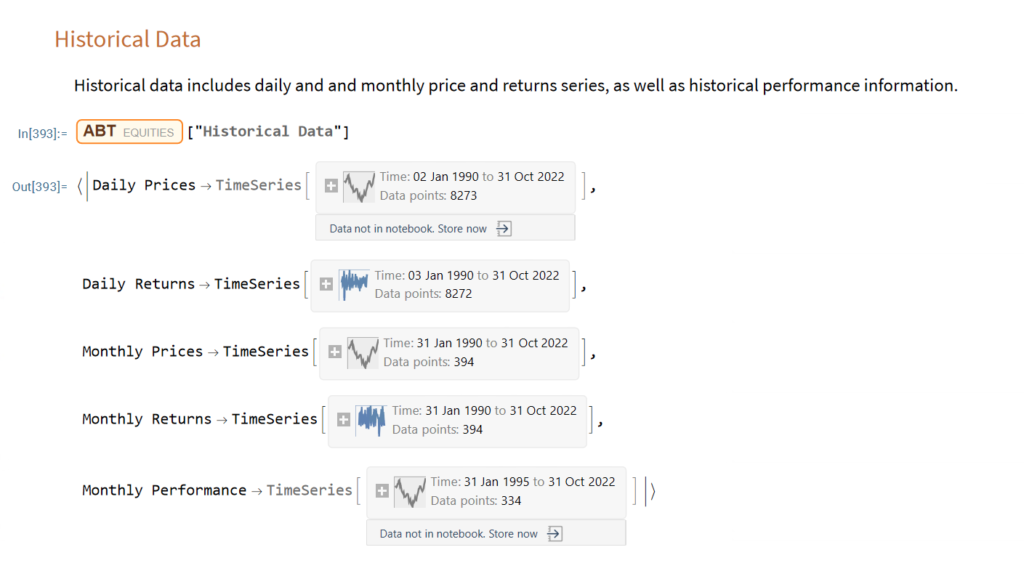
The Equities Entity Store applies the object-oriented concept of Entity Stores in the Wolfram Language to create a collection of equity objects, both stocks and stock indices, containing current and historical fundamental, technical and performance-related data. Also included in the release version of the product will be a collection of utility functions (a.k.a. “Methods”) that will facilitate equity analysis,  the formation and evaluation of equity portfolios and the development and back-testing of equities strategies, including cross-sectional strategies.

In the pre-release version of the store there are just over 1,000 equities, but this will rise to over 2,000 in the first release, as delisted securities are added to the store. This is important in order to eliminate survivor bias from the data set.

First Release of the Equities Entity Store – January 2023

The first release of the equities entity store product will contain around 2,000-2,500 equities, including at least 1,000 active stocks listed on the NYSE and NASDAQ exchanges and a further 1,000-1,500 delisted securities. All of the above information will be available for each equity and, in addition, the historical data will include quarterly fundamental data.

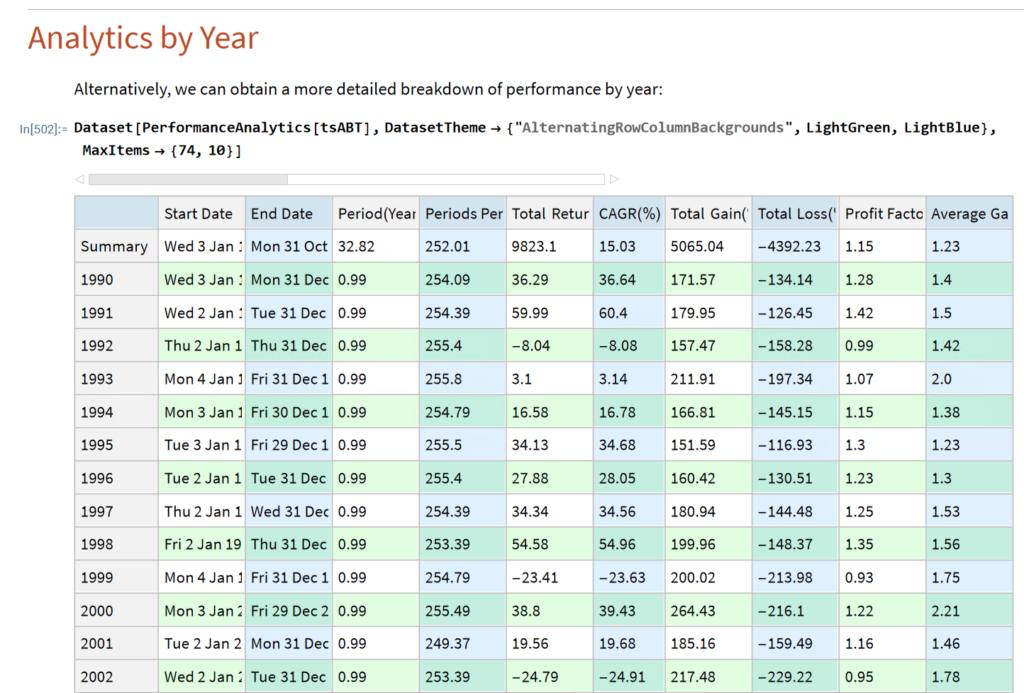
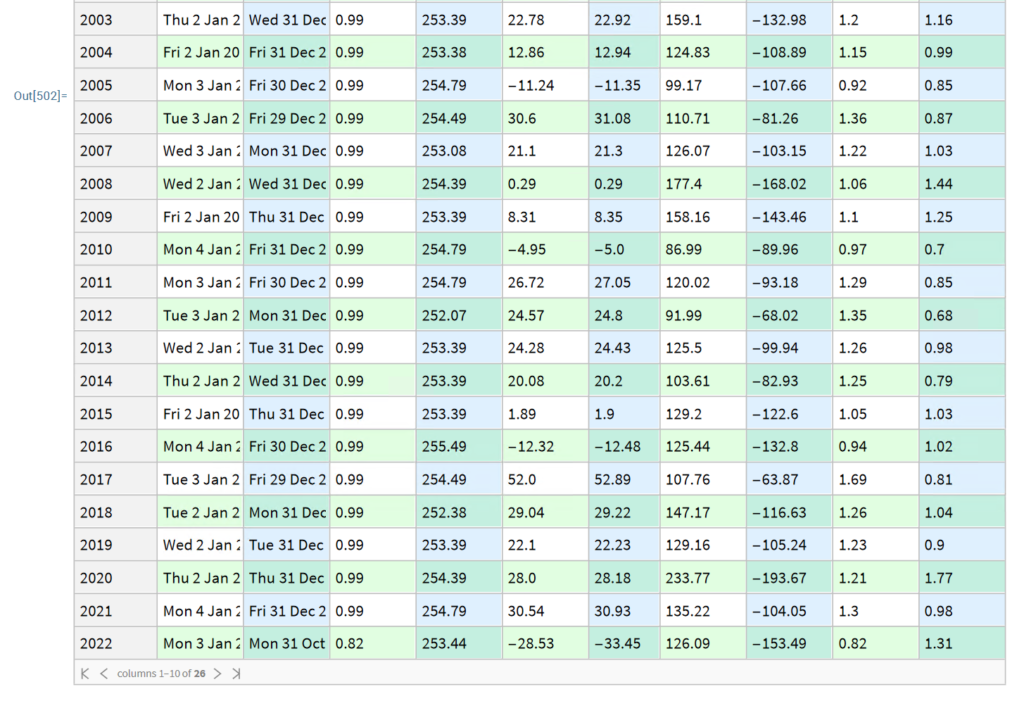
The other major component of the store will be analytics tools, including single-stock analytics functions such as those illustrated here. More important, however, is that the store will contain advanced analytics tools designed to assist the analyst in the construction of optimized equity portfolios and in the development and backtesting of long and long/short equity strategies.

Readers wishing to receive more information should contact me at algosciences (at) gmail.com

Tactical Mutual Fund Strategies

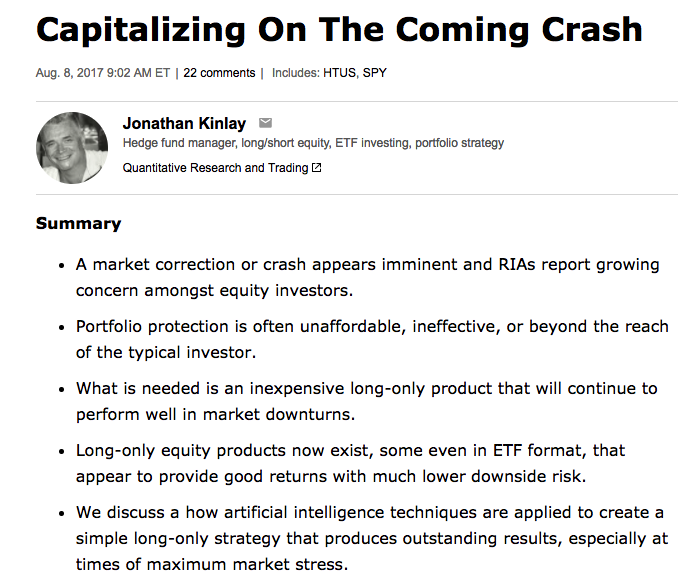
A recent blog post of mine was posted on Seeking Alpha (see summary below if you missed it).

Capital

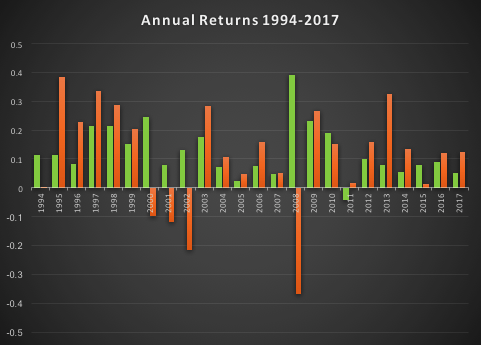
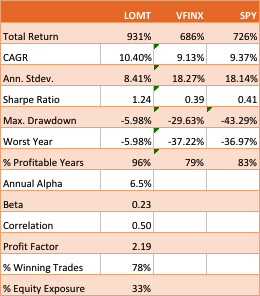
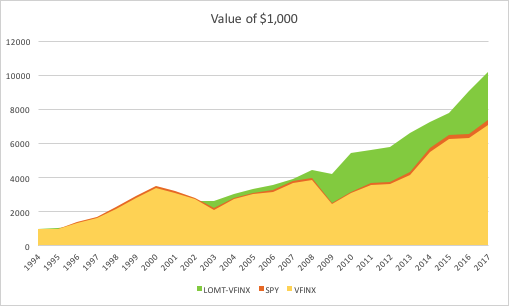
The essence of the idea is simply that one can design long-only, tactical market timing strategies that perform robustly during market downturns, or which may even be positively correlated with volatility.  I used the example of a LOMT (“Long-Only Market-Timing”) strategy that switches between the SPY ETF and 91-Day T-Bills, depending on the current outlook for the market as characterized by machine learning algorithms.  As I indicated in the article, the LOMT handily outperforms the buy-and-hold strategy over the period from 1994 -2017 by several hundred basis points:

Fig6


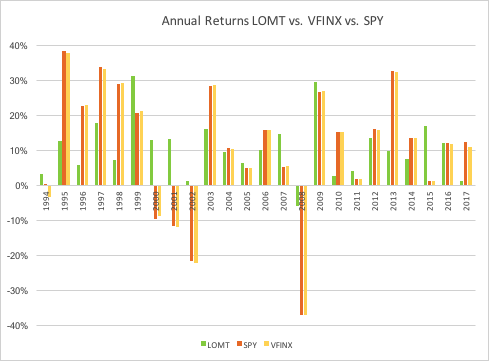
Of particular note is the robustness of the LOMT strategy performance during the market crashes in 2000/01 and 2008, as well as the correction in 2015:


Fig7


The Pros and Cons of Market Timing (aka “Tactical”) Strategies

One of the popular choices the investor concerned about downsize risk is to use put options (or put spreads) to hedge some of the market exposure.  The problem, of course, is that the cost of the hedge acts as a drag on performance, which may be reduced by several hundred basis points annually, depending on market volatility.    Trying to decide when to use option insurance and when to maintain full market exposure is just another variation on the market timing problem.

The point of tactical strategies is that, unlike an option hedge, they will continue to produce positive returns – albeit at a lower rate than the market portfolio – during periods when markets are benign, while at the same time offering much superior returns during market declines, or crashes.   If the investor is concerned about the lower rate of return he is likely to achieve during normal years, the answer is to make use of leverage.

SSALGOTRADING AD

Market timing strategies like Hull Tactical or the LOMT have higher risk-adjusted rates of return (Sharpe Ratios) than the market portfolio.  So the investor can make use of margin money to scale up his investment to about the same level of risk as the market index.  In doing so he will expect to earn a much higher rate of return than the market.

This is easy to do with products like LOMT or Hull Tactical, because they make use of marginable securities such as ETFs.   As I point out in the sections following, one of the shortcomings of applying the market timing approach to mutual funds, however, is that they are not marginable (not initially, at least), so the possibilities for using leverage are severely restricted.

Market Timing with Mutual Funds

An interesting suggestion from one Seeking Alpha reader was to apply the LOMT approach to the Vanguard 500 Index Investor fund (VFINX), which has a rather longer history than the SPY ETF.  Unfortunately, I only have ready access to data from 1994, but nonetheless applied the LOMT model over that time period.  This is an interesting challenge, since none of the VFINX data was used in the actual construction of the LOMT model.  The fact that the VFINX series is highly correlated with SPY is not the issue – it is typically the case that strategies developed for one asset will fail when applied to a second, correlated asset.  So, while it is perhaps hard to argue that the entire VFIX is out-of-sample, the performance of the strategy when applied to that series will serve to confirm (or otherwise) the robustness and general applicability of the algorithm.

The results turn out as follows:


Fig21


Fig22


Fig23


The performance of the LOMT strategy implemented for VFINX handily outperforms the buy-and-hold portfolios in the SPY ETF and VFINX mutual fund, both in terms of return (CAGR) and well as risk, since strategy volatility is less than half that of buy-and-hold.  Consequently the risk adjusted return (Sharpe Ratio) is around 3x higher.

That said, the VFINX variation of LOMT is distinctly inferior to the original version implemented in the SPY ETF, for which the trading algorithm was originally designed.   Of particular significance in this context is that the SPY version of the LOMT strategy produces substantial gains during the market crash of 2008, whereas the VFINX version of the market timing strategy results in a small loss for that year.  More generally, the SPY-LOMT strategy has a higher Sortino Ratio than the mutual fund timing strategy, a further indication of its superior ability to manage  downside risk.

Given that the objective is to design long-only strategies that perform well in market downturns, one need not pursue this particular example much further , since it is already clear that the LOMT strategy using SPY is superior in terms of risk and return characteristics to the mutual fund alternative.

Practical Limitations

There are other, practical issues with apply an algorithmic trading strategy a mutual fund product like VFINX. To begin with, the mutual fund prices series contains no open/high/low prices, or volume data, which are often used by trading algorithms.  Then there are the execution issues:  funds can only be purchased or sold at market prices, whereas many algorithmic trading systems use other order types to enter and exit positions (stop and limit orders being common alternatives). You can’t sell short and  there are restrictions on the frequency of trading of mutual funds and penalties for early redemption.  And sales loads are often substantial (3% to 5% is not uncommon), so investors have to find a broker that lists the selected funds as no-load for the strategy to make economic sense.  Finally, mutual funds are often treated by the broker as ineligible for margin for an initial period (30 days, typically), which prevents the investor from leveraging his investment in the way that he do can quite easily using ETFs.

For these reasons one typically does not expect a trading strategy formulated using a stock or ETF product to transfer easily to another asset class.  The fact that the SPY-LOMT strategy appears to work successfully on the VFINX mutual fund product  (on paper, at least) is highly unusual and speaks to the robustness of the methodology.  But one would be ill-advised to seek to implement the strategy in that way.  In almost all cases a better result will be produced by developing a strategy designed for the specific asset (class) one has in mind.

A Tactical Trading Strategy for the VFINX Mutual Fund

A better outcome can possibly be achieved by developing a market timing strategy designed specifically for the VFINX mutual fund.  This strategy uses only market orders to enter and exit positions and attempts to address the issue of frequent trading by applying a trading cost to simulate the fees that typically apply in such situations.  The results, net of imputed fees, for the period from 1994-2017 are summarized as follows:


Fig24


Fig18

Overall, the CAGR of the tactical strategy is around 88 basis points higher, per annum.  The risk-adjusted rate of return (Sharpe Ratio) is not as high as for the LOMT-SPY strategy, since the annual volatility is almost double.  But, as I have already pointed out, there are unanswered questions about the practicality of implementing the latter for the VFINX, given that it seeks to enter trades using limit orders, which do not exist in the mutual fund world.

The performance of the tactical-VFINX strategy relative to the VFINX fund falls into three distinct periods: under-performance in the period from 1994-2002, about equal performance in the period 2003-2008, and superior relative performance in the period from 2008-2017.

Only the data from 1/19934 to 3/2008 were used in the construction of the model.  Data in the period from 3/2008 to 11/2012 were used for testing, while the results for 12/2012 to 8/2017 are entirely out-of-sample. In other words, the great majority of the period of superior performance for the tactical strategy was out-of-sample.  The chief reason for the improved performance of the tactical-VFINX strategy is the lower drawdown suffered during the financial crisis of 2008, compared to the benchmark VFINX fund.  Using market-timing algorithms, the tactical strategy was able identify the downturn as it occurred and exit the market.  This is quite impressive since, as perviously indicated, none of the data from that 2008 financial crisis was used in the construction of the model.

In his Seeking Alpha article “Alpha-Winning Stars of the Bull Market“, Brad Zigler identifies the handful of funds that have outperformed the VFINX benchmark since 2009, generating positive alpha:

Fig20


What is notable is that the annual alpha of the tactical-VINFX strategy, at 1.69%, is higher than any of those identified by Zigler as being “exceptional”. Furthermore, the annual R-squared of the tactical strategy is higher than four of the seven funds on Zigler’s All-Star list.   Based on Zigler’s performance metrics, the tactical VFINX strategy would be one of the top performing active funds.

But there is another element missing from the assessment. In the analysis so far we have assumed that in periods when the tactical strategy disinvests from the VFINX fund the proceeds are simply held in cash, at zero interest.  In practice, of course, we would invest any proceeds in risk-free assets such as Treasury Bills.   This would further boost the performance of the strategy, by several tens of basis points per annum, without any increase in volatility.  In other words, the annual CAGR and annual Alpha, are likely to be greater than indicated here.

Robustness Testing

One of the concerns with any backtest – even one with a lengthy out-of-sample period, as here – is that one is evaluating only a single sample path from the price process.  Different evolutions could have produced radically different outcomes in the past, or in future. To assess the robustness of the strategy we apply Monte Carlo simulation techniques to generate a large number of different sample paths for the price process and evaluate the performance of the strategy in each scenario.

Three different types of random variation are factored into this assessment:

  1. We allow the observed prices to fluctuate by +/- 30% with a probability of about 1/3 (so, roughly, every three days the fund price will be adjusted up or down by that up to that percentage).
  2. Strategy parameters are permitted to fluctuate by the same amount and with the same probability.  This ensures that we haven’t over-optimized the strategy with the selected parameters.
  3. Finally, we randomize the start date of the strategy by up to a year.  This reduces the risk of basing the assessment on the outcome from encountering a lucky (or unlucky) period, during which the market may be in a strong trend, for example.

In the chart below we illustrate the outcome from around 1,000 such randomized sample paths, from which it can be seen that the strategy performance is robust and consistent.

Fig 19


Limitations to the Testing Procedure

We have identified one way in which this assessment understates the performance of the tactical-VFINX strategy:  by failing to take into account the uplift in returns from investing in interest-bearing Treasury securities, rather than cash, at times when the strategy is out of the market.  So it is only reasonable to point out other limitations to the test procedure that may paint a too-optimistic picture.

The key consideration here is the frequency of trading.  On average, the tactical-VFINX strategy trades around twice a month, which is more than normally permitted for mutual funds.  Certainly, we have factored in additional trading costs to account for early redemptions charges. But the question is whether or not the strategy would be permitted to trade at such frequency, even with the payment of additional fees.  If not, then the strategy would have to be re-tooled to work on long average holding periods, no doubt adversely affecting its performance.

Conclusion

The purpose of this analysis was to assess whether, in principle, it is possible to construct a market timing strategy that is capable of outperforming a VFINX fund benchmark.  The answer appears to be in the affirmative.  However, several practical issues remain to be addressed before such a strategy could be put into production successfully.  In general, mutual funds are not ideal vehicles for expressing trading strategies, including tactical market timing strategies.  There are latent inefficiencies in mutual fund markets – the restrictions on trading and penalties for early redemption, to name but two – that create difficulties for active approaches to investing in such products – ETFs are much superior in this regard.  Nonetheless, this study suggest that, in principle, tactical approaches to mutual fund investing may deliver worthwhile benefits to investors, despite the practical challenges.

Portfolio Improvement for the Equity Investor

Portfolio

Equity investors and long-only portfolio managers are constantly on the lookout for ways to improve their portfolios, either by yield enhancement, or risk reduction.  In the case of yield enhancement, the principal focus is on adding alpha to the portfolio through stock selection and active management, while risk reduction tends to be accomplished through diversification.

Another approach is to seek improvement by adding investments outside the chosen universe of stocks, while remaining within the scope of the investment mandate (which, for instance, may include equity-related products, but not futures or options).  The advent of volatility products in the mid-2000’s offered new opportunities for risk reduction; but this benefit was typically achieved at the cost of several hundred basis points in yield.  Over the last decade, however, a significant evolution has taken place in volatility strategies, such that they can now not only provide insurance for the equity portfolio, but, in addition, serve as an orthogonal source of alpha to enhance portfolio yields.

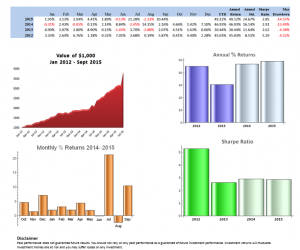
An example of one such product is our volatility strategy, a quantitative approach to trading VIX-related ETF products traded on ARCA. A summary of the performance of the strategy is given below.

Vol Strategy perf Sept 2015

The mechanics of the strategy are unlikely to be of great interest to the typical equity investor and so need not detain us here.  Rather, I want to focus on how an investor can use such products to enhance their equity portfolio.

Performance of the Equity Market and Individual Sectors

The last five years have been extremely benign for the equity market, not only for the broad market, as evidenced by the performance of the SPDR S&P 500 Trust ETF (SPY), and also by almost every individual sector, with the notable exception of energy.

Sector ETF Performance 2012-2015

The risk-adjusted returns have been exceptional over this period, with information ratios reaching 1.4 or higher for several of the sectors, including Financials, Consumer Staples, Healthcare and Consumer Discretionary.  If the equity investor has been in a position to diversify his portfolio as fully as the SPY ETF, it might reasonably been assumed that he has accomplished the maximum possible level of risk reduction; at the same time, no-one is going to argue with a CAGR of 16.35%.  Yet, even here, portfolio improvement is possible.

Yield Enhancement

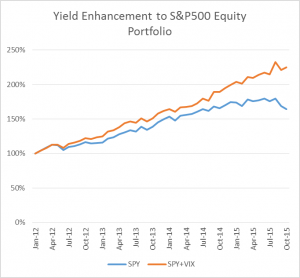
The key to improving the portfolio yield lies in the superior risk-adjusted performance of the volatility portfolio compared to the equity portfolio and also due the fact that, while the correlation between the two is significant (at 0.44), it is considerably lower than 1.  Hence there is potential for generating higher rates of return on a risk-adjusted basis by combining the pair of portfolios in some proportion.

SSALGOTRADING AD

To illustrate this we assume, firstly, that the investor is comfortable with the currently level of risk in his broadly diversified equity portfolio, as measured by the annual standard deviation of returns, currently 10.65%.   Holding this level of risk constant, we now introduce an overlay strategy, namely the volatility portfolio, to which we seek to allocate some proportion of the available investment capital.  With this constraint it turns out that we can achieve a substantial improvement in the overall yield by reducing our holding in the equity portfolio to just over 2/3 of the current level (67.2%) and allocating 32.8% of the capital to the volatility portfolio.  Over the period from 2012, the combined equity and volatility portfolio produced a CAGR of 26.83%, but with the same annual standard deviation – a yield enhancement of 10.48% annually.  The portfolio Information Ratio improves from 1.53 to a 2.52, reflecting the much higher returns produced by the combined portfolio, for the same level of risk as before.

Chart

Risk Reduction

The given example may appear impressive, but it isn’t really a practical proposition.  Firstly, no equity investor or portfolio manager is likely to want to allocate 1/3 of their total capital to a strategy operated by a third party, no matter how impressive the returns. Secondly, the capacity in the volatility strategy is, realistically, of the order of $100 million.  A 32.8% allocation of capital from a sizeable equity portfolio would absorb a large proportion of the available capacity in the volatility ETF strategy, or even all of it.

A much more realistic approach would be to cap the allocation to the volatility component at a reasonable level – say, 5%.  Then the allocation from a $100M capital budget would be $5M, well within the capacity constraints of the volatility product.  In fact, operating at this capped allocation percentage, the volatility strategy provides capacity for equity portfolios of up to $2Bn in total capital.

Let’s look at an example of what can be achieved under a 5% allocation constraint.  In this scenario I am going to move along the second axis of portfolio improvement – risk reduction.  Here, we assume that we wish to maintain the current level of performance of the equity portfolio (CAGR 16.35%), while reducing the risk as much as possible.

A legitimate question at this stage would be to ask how it might be possible to reduce risk by introducing a new investment that has a higher annual standard deviation than the existing portfolio?  The answer is simply that we move some of our existing investment into cash (or, rather, Treasury securities).  In fact, by allocating the maximum allowed to the volatility portfolio (5%) and reducing our holding in the equity portfolio to 85.8% of the original level (with the remaining 9.2% in cash), we are able to create a portfolio with the same CAGR but with an annual volatility in single digits: 9.53%, a reduction in risk of  112 basis points annually.  At the same time, the risk adjusted performance of the portfolio improves from 1.53 to 1.71 over the period from 2012.

Of course, the level of portfolio improvement is highly dependent on the performance characteristics of both the equity portfolio and overlay strategy, as well as the correlation between them. To take a further example, if we consider an equity portfolio mirroring the characteristics of the Materials Select Sector SPDR ETF (XLB), we can achieve a reduction of as much as 3.31% in the annual standard deviation, without any loss in expected yield, through an allocation of 5% to the volatility overlay strategy and a much higher allocation of 18% to cash.

Other Considerations

Investors and money managers being what they are, it goes against the grain to consider allocating money to a third party – after all, a professional money manager earns his living from his own investment expertise, rather than relying on others.  Yet no investor can reasonably expect to achieve the same level of success in every field of investment.  If you have built your reputation on your abilities as a fundamental analyst and stock picker, it is unreasonable to expect that you will be able accomplish as much in the arena of quantitative investment strategies.  Secondly, by capping the allocation to an external manager at the level of 5% to 10%, your primary investment approach remains unaltered –  you are maintaining the fidelity of your principal investment thesis and investment mandate.  Thirdly, there is no reason why overlay strategies such as the one discussed here should not provide easy liquidity terms – after all, the underlying investments are liquid, exchange traded products. Finally, if you allocate capital in the form of a managed account you can maintain control over the allocated capital and make adjustments rapidly, as your investment needs change.

Conclusion

Quantitative strategies have a useful role to play for equity investors and portfolio managers as a means to improve existing portfolios, whether by yield enhancement, risk reduction, or a combination of the two.  While the level of improvement is highly dependent on the performance characteristics of the equity portfolio and the overlay strategy, the indications are that yield enhancement, or risk reduction, of the order of hundreds of basis points may be achievable even through very modest allocations of capital.

Is Your Trading Strategy Still Working?

The Challenge of Validating Strategy Performance

One of the challenges faced by investment strategists is to assess whether a strategy is continuing to perform as it should.  This applies whether it is a new strategy that has been backtested and is now being traded in production, or a strategy that has been live for a while.
All strategies have a limited lifespan.  Markets change, and a trading strategy that can’t accommodate that change will get out of sync with the market and start to lose money. Unless you have a way to identify when a strategy is no longer in sync with the market, months of profitable trading can be undone very quickly.

The issue is particularly important for quantitative strategies.  Firstly, quantitative strategies are susceptible to the risk of over-fitting.  Secondly, unlike a strategy based on fundamental factors, it may be difficult for the analyst to verify that the drivers of strategy profitability remain intact.

Savvy investors are well aware of the risk of quantitative strategies breaking down and are likely to require reassurance that a period of underperformance is a purely temporary phenomenon.

It might be tempting to believe that you will simply stop trading when the strategy stops working.  But given the stochastic nature of investment returns, how do you distinguish a losing streak from a system breakdown?

SSALGOTRADING AD

Stochastic Process Control

One approach to the problem derives from the field of Monte Carlo simulation and stochastic process control.  Here we random draw samples from the distribution of strategy returns and use these to construct a prediction envelope to forecast the range of future returns.  If the equity curve of the strategy over the forecast period  falls outside of the envelope, it would raise serious concerns that the strategy may have broken down.  In those circumstances you would almost certainly want to trade the strategy in smaller size for a while to see if it recovers, or even exit the strategy altogether it it does not.

I will illustrate the procedure for the long/short ETF strategy that I described in an earlier post, making use of Michael Bryant’s excellent Market System Analyzer software.

To briefly refresh, the strategy is built using cointegration theory to construct long/short portfolios is a selection of ETFs that provide exposure to US and international equity, currency, real estate and fixed income markets.  The out of sample back-test performance of the strategy is very encouraging:

Fig 2


Fig 1

There was evidently a significant slowdown during 2014, with a reduction in the risk-adjusted returns and win rate for the strategy:

Fig 1

This period might itself have raised questions about the continuing effectiveness of the strategy.  However, we have the benefit of hindsight in seeing that, during the first two months of 2015, performance appeared to be recovering.

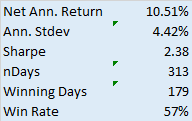
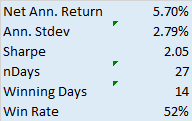
Consequently we put the strategy into production testing at the beginning of March 2015 and we now wish to evaluate whether the strategy is continuing on track.   The results indicate that strategy performance has been somewhat weaker than we might have hoped, although this is compensated for by a significant reduction in strategy volatility, so that the net risk-adjusted returns remain somewhat in line with recent back-test history.

Fig 3

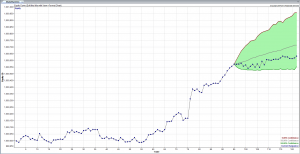
Using the MSA software we sample the most recent back-test returns for the period to the end of Feb 2015, and create a 95% prediction envelope for the returns since the beginning of March, as follows:

Fig 2

As we surmised, during the production period the strategy has slightly underperformed the projected median of the forecast range, but overall the equity curve still falls within the prediction envelope.  As this stage we would tentatively conclude that the strategy is continuing to perform within expected tolerance.

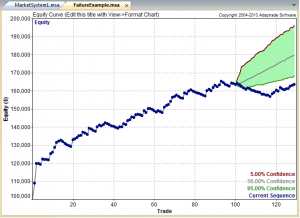
Had we seen a pattern like the one shown in the chart below, our conclusion would have been very different.

Fig 4

As shown in the illustration, the equity curve lies below the lower boundary of the prediction envelope, suggesting that the strategy has failed. In statistical terms, the trades in the validation segment appear not to belong to the same statistical distribution of trades that preceded the validation segment.

This strategy failure can also be explained as follows: The equity curve prior to the validation segment displays relatively little volatility. The drawdowns are modest, and the equity curve follows a fairly straight trajectory. As a result, the prediction envelope is fairly narrow, and the drawdown at the start of the validation segment is so large that the equity curve is unable to rise back above the lower boundary of the envelope. If the history prior to the validation period had been more volatile, it’s possible that the envelope would have been large enough to encompass the equity curve in the validation period.

 CONCLUSION

Systematic trading has the advantage of reducing emotion from trading because the trading system tells you when to buy or sell, eliminating the difficult decision of when to “pull the trigger.” However, when a trading system starts to fail a conflict arises between the need to follow the system without question and the need to stop following the system when it’s no longer working.

Stochastic process control provides a technical, objective method to determine when a trading strategy is no longer working and should be modified or taken offline. The prediction envelope method extrapolates the past trade history using Monte Carlo analysis and compares the actual equity curve to the range of probable equity curves based on the extrapolation.

Next we will look at nonparametric distributions tests  as an alternative method for assessing strategy performance.

Developing Long/Short ETF Strategies

Recently I have been working on the problem of how to construct large portfolios of cointegrated securities.  My focus has been on ETFs rather that stocks, although in principle the methodology applies equally well to either, of course.

My preference for ETFs is due primarily to the fact that  it is easier to achieve a wide diversification in the portfolio with a more limited number of securities: trading just a handful of ETFs one can easily gain exposure, not only to the US equity market, but also international equity markets, currencies, real estate, metals and commodities. Survivorship bias, shorting restrictions  and security-specific risk are also less of an issue with ETFs than with stocks (although these problems are not too difficult to handle).

On the downside, with few exceptions ETFs tend to have much shorter histories than equities or commodities.  One also has to pay close attention to the issue of liquidity. That said, I managed to assemble a universe of 85 ETF products with histories from 2006 that have sufficient liquidity collectively to easily absorb an investment of several hundreds of  millions of dollars, at minimum.

The Cardinality Problem

The basic methodology for constructing a long/short portfolio using cointegration is covered in an earlier post.   But problems arise when trying to extend the universe of underlying securities.  There are two challenges that need to be overcome.

Magic Cube.112

The first issue is that, other than the simple regression approach, more advanced techniques such as the Johansen test are unable to handle data sets comprising more than about a dozen securities. The second issue is that the number of possible combinations of cointegrated securities quickly becomes unmanageable as the size of the universe grows.  In this case, even taking a subset of just six securities from the ETF universe gives rise to a total of over 437 million possible combinations (85! / (79! * 6!).  An exhaustive test of all the possible combinations of a larger portfolio of, say, 20 ETFs, would entail examining around 1.4E+19 possibilities.

Given the scale of the computational problem, how to proceed? One approach to addressing the cardinality issue is sparse canonical correlation analysis, as described in Identifying Small Mean Reverting Portfolios,  d’Aspremont (2008). The essence of the idea is something like this. Suppose you find that, in a smaller, computable universe consisting of just two securities, a portfolio comprising, say, SPY and QQQ was  found to be cointegrated.  Then, when extending consideration to portfolios of three securities, instead of examining every possible combination, you might instead restrict your search to only those portfolios which contain SPY and QQQ. Having fixed the first two selections, you are left with only 83 possible combinations of three securities to consider.  This process is repeated as you move from portfolios comprising 3 securities to 4, 5, 6, … etc.

Other approaches to the cardinality problem are  possible.  In their 2014 paper Sparse, mean reverting portfolio selection using simulated annealing,  the Hungarian researchers Norbert Fogarasi and Janos Levendovszky consider a new optimization approach based on simulated annealing.  I have developed my own, hybrid approach to portfolio construction that makes use of similar analytical methodologies. Does it work?

A Cointegrated Long/Short ETF Basket

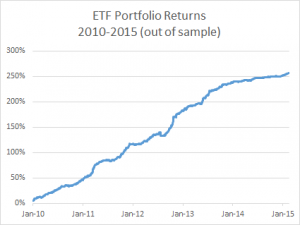
Below are summarized the out-of-sample results for a portfolio comprising 21 cointegrated ETFs over the period from 2010 to 2015.  The basket has broad exposure (long and short) to US and international equities, real estate, currencies and interest rates, as well as exposure in banking, oil and gas and other  specific sectors.

The portfolio was constructed using daily data from 2006 – 2009, and cointegration vectors were re-computed annually using data up to the end of the prior year.  I followed my usual practice of using daily data comprising “closing” prices around 12pm, i.e. in the middle of the trading session, in preference to prices at the 4pm market close.  Although liquidity at that time is often lower than at the close, volatility also tends to be muted and one has a period of perhaps as much at two hours to try to achieve the arrival price. I find this to be a more reliable assumption that the usual alternative.

Fig 2   Fig 1 The risk-adjusted performance of the strategy is consistently outstanding throughout the out-of-sample period from 2010.  After a slowdown in 2014, strategy performance in the first quarter of 2015 has again accelerated to the level achieved in earlier years (i.e. with a Sharpe ratio above 4).

Another useful test procedure is to compare the strategy performance with that of a portfolio constructed using standard mean-variance optimization (using the same ETF universe, of course).  The test indicates that a portfolio constructed using the traditional Markowitz approach produces a similar annual return, but with 2.5x the annual volatility (i.e. a Sharpe ratio of only 1.6).  What is impressive about this result is that the comparison one is making is between the out-of-sample performance of the strategy vs. the in-sample performance of a portfolio constructed using all of the available data.

Having demonstrated the validity of the methodology,  at least to my own satisfaction, the next step is to deploy the strategy and test it in a live environment.  This is now under way, using execution algos that are designed to minimize the implementation shortfall (i.e to minimize any difference between the theoretical and live performance of the strategy).  So far the implementation appears to be working very well.

Once a track record has been built and audited, the really hard work begins:  raising investment capital!

Quant Strategies in 2018

Quant Strategies – Performance Summary Sept. 2018

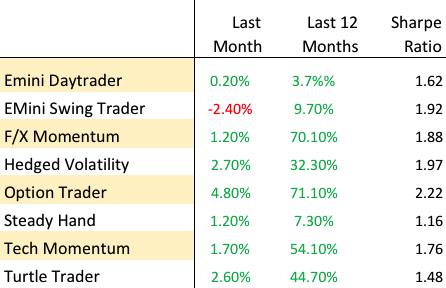
The end of Q3 seems like an appropriate time for an across-the-piste review of how systematic strategies are performing in 2018.  I’m using the dozen or more strategies running on the Systematic Algotrading Platform as the basis for the performance review, although results will obviously vary according to the specifics of the strategy.  All of the strategies are traded live and performance results are net of subscription fees, as well as slippage and brokerage commissions.
Volatility Strategies

Those waiting for the hammer to fall on option premium collecting strategies will have been disappointed with the way things have turned out so far in 2018.  Yes, February saw a long-awaited and rather spectacular explosion in volatility which completely destroyed several major volatility funds, including the VelocityShares Daily Inverse VIX Short-Term ETN (XIV) as well as Chicago-based hedged fund LJM Partners (“our goal is to preserve as much capital as possible”), that got caught on the wrong side of the popular VIX carry trade.  But the lack of follow-through has given many volatility strategies time to recover. Indeed, some are positively thriving now that elevated levels in the VIX have finally lifted option premiums from the bargain basement levels they were languishing at prior to February’s carnage.  The Option Trader strategy is a stand-out in this regard:  not only did the strategy produce exceptional returns during the February melt-down (+27.1%), the strategy has continued to outperform as the year has progressed and YTD returns now total a little over 69%.  Nor is the strategy itself exceptionally volatility: the Sharpe ratio has remained consistently above 2 over several years.

Hedged Volatility Trading

Investors’ chief concern with strategies that rely on collecting option premiums is that eventually they may blow up.  For those looking for a more nuanced approach to managing tail risk the Hedged Volatility strategy may be the way to go.  Like many strategies in the volatility space the strategy looks to generate alpha by trading VIX ETF products;  but unlike the great majority of competitor offerings, this strategy also uses ETF options to hedge tail risk exposure.  While hedging costs certainly acts as a performance drag, the results over the last few years have been compelling:  a CAGR of 52% with a Sharpe Ratio close to 2.

F/X Strategies

One of the common concerns for investors is how to diversify their investment portfolios, especially since the great majority of assets (and strategies) tend to exhibit significant positive correlation to equity indices these days. One of the characteristics we most appreciate about F/X strategies in general and the F/X Momentum strategy in particular is that its correlation to the equity markets over the last several years has been negligible.    Other attractive features of the strategy include the exceptionally high win rate – over 90% – and the profit factor of 5.4, which makes life very comfortable for investors.  After a moderate performance in 2017, the strategy has rebounded this year and is up 56% YTD, with a CAGR of 64.5% and Sharpe Ratio of 1.89.

Equity Long/Short

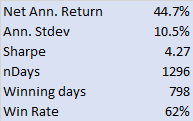
Thanks to the Fed’s accommodative stance, equity markets have been generally benign over the last decade to the benefit of most equity long-only and long-short strategies, including our equity long/short Turtle Trader strategy , which is up 31% YTD.  This follows a spectacular 2017 (+66%) , and is in line with the 5-year CAGR of 39%.   Notably, the correlation with the benchmark S&P500 Index is relatively low (0.16), while the Sharpe Ratio is a respectable 1.47.

Equity ETFs – Market Timing/Swing Trading

One alternative to the traditional equity long/short products is the Tech Momentum strategy.  This is a swing trading strategy that exploits short term momentum signals to trade the ProShares UltraPro QQQ (TQQQ) and ProShares UltraPro Short QQQ (SQQQ) leveraged ETFs.  The strategy is enjoying a banner year, up 57% YTD, with a four-year CAGR of 47.7% and Sharpe Ratio of 1.77.  A standout feature of this equity strategy is its almost zero correlation with the S&P 500 Index.  It is worth noting that this strategy also performed very well during the market decline in Feb, recording a gain of over 11% for the month.

Futures Strategies

It’s a little early to assess the performance of the various futures strategies in the Systematic Strategies portfolio, which were launched on the platform only a few months ago (despite being traded live for far longer).    For what it is worth, both of the S&P 500 E-Mini strategies, the Daytrader and the Swing Trader, are now firmly in positive territory for 2018.   Obviously we are keeping a watchful eye to see if the performance going forward remains in line with past results, but our experience of trading these strategies gives us cause for optimism.

Conclusion:  Quant Strategies in 2018

There appear to be ample opportunities for investors in the quant sector across a wide range of asset classes.  For investors with equity market exposure, we particularly like strategies with low market correlation that offer significant diversification benefits, such as the F/X Momentum and F/X Momentum strategies.  For those investors seeking the highest risk adjusted return, option selling strategies like the Option Trader strategy are the best choice, while for more cautious investors concerned about tail risk the Hedged Volatility strategy offers the security of downside protection.  Finally, there are several new strategies in equities and futures coming down the pike, several of which are already showing considerable promise.  We will review the performance of these newer strategies at the end of the year.

Go here for more information about the Systematic Algotrading Platform.

The Correlation Signal

The use of correlations is widespread in investment management theory and practice, from the construction of portfolios to the design of hedge trades to statistical arbitrage strategies.

A common difficulty encountered in all of these applications is the variation in correlation: assets that at one time appear to be suitably uncorrelated for hedging purposes, may become much more highly correlated at other times, such as periods of market stress. Conversely, stocks that appear suitable for pairs trading due to the high correlation in their prices or returns, may de-couple at a later time, causing significant losses.

The instability in the level of correlation is further aggravated by the empirical finding that the volatility in correlation is itself time-dependent:  at times the correlations between assets may appear to fluctuate smoothly within a tight range; at other times we might see several fluctuations in the sign of the correlation  coefficient over the course of a few days.

One tool I have found useful in this context is a concept I refer to as the correlation signal, defined at the average correlation divided by the standard deviation of the correlation coefficient.  The chart below illustrates a typical pattern for a pair of Oil and Gas industry stocks.  The blue line is the average daily correlation between the stocks, measured at 5-minute intervals.  The red line is the correlation signal – the average daily correlation divided by the standard deviation in the intra-day correlation.  The stochastic nature of both the correlation coefficient and the correlation signal is quite evident.  Note that the correlation signal, unlike the coefficient, is not constrained within the limits of +/- 1.  At times when the variation in correlation is low the signal an easily exceed those limits by as much as an order of magnitude.

CorrSig Plot

In later posts I will illustrate the usefulness of the correlation signal in portfolio construction and statistical arbitrage.  For now, let me just say that it is a measure of the strength of the correlation as a signal, relative to the noise of random variation in the correlation process.   It can be used to identify situations in which a relationship – whether a positive or negative correlation – appears to be stable or unstable, and therefore viable as a basis for inference, or not.


Creating Robust, High-Performance Stock Portfolios

Summary

In this article, I am going to look at how stock portfolios should be constructed that best meet investment objectives.

The theoretical and practical difficulties of the widely adopted Modern Portfolio Theory approach limits its usefulness as a tool for portfolio construction.

MPT portfolios typically produce disappointing out-of-sample results, and will often underperform a naïve, equally-weighted stock portfolio.

The article introduces the concept of robust portfolio construction, which leads to portfolios that have more stable performance characteristics, including during periods of high volatility or market corrections.
The benefits of this approach include risk-adjusted returns that substantially exceed those of traditional portfolios, together with much lower drawdowns and correlations.
Market Timing

In an earlier article, I discussed how investors can enhance returns through the strategic use of market timing techniques to step out of the market during difficult conditions.
To emphasize the impact of market timing on investment returns, I have summarized in the chart below how a $1,000 investment would have grown over the 25-year period from July 1990 to June 2014. In the baseline scenario, we assume that the investment is made in a fund that tracks the S&P 500 Index and held for the full term. In the second scenario, we look at the outcome if the investor had stepped out of the market during the market downturns from March 2000 to Feb 2003 and from Jan 2007 to Feb 2009.

Fig. 1: Value of $1,000 Jul 1990-Jun 2014 – S&P 500 Index with and without Market Timing

Source: Yahoo Finance, 2014

After 25 years, the investment under the second scenario would have been worth approximately 5x as much as in the baseline scenario. Of course, perfect market timing is unlikely to be achievable. The best an investor can do is employ some kind of market timing indicator, such as the CBOE VIX index, as described in the previous article.

Equity Long Short

For those who mistrust the concept of market timing or who wish to remain invested in the market over the long term regardless of short-term market conditions, an alternative exists that bears consideration.

The equity long/short strategy, in which the investor buys certain stocks while shorting others, is a concept that reputedly originated with Alfred Jones in the 1940s. A long/short equity portfolio seeks to reduce overall market exposure, while profiting from stock gains in the long positions and price declines in the short positions. The idea is that the investor’s equity investments in the long positions are hedged to some degree against a general market decline by the offsetting short positions, from which the concept of a hedge fund is derived.
SSALGOTRADING AD

There are many variations on the long/short theme. Where the long and short positions are individually matched, the strategy is referred to as pairs trading. When the portfolio composition is structured in a way that the overall market exposure on the short side equates to that of the long side, leaving zero net market exposure, the strategy is typically referred to as market-neutral. Variations include dollar-neutral, where the dollar value of aggregate long and short positions is equalized, and beta-neutral, where the portfolio is structured in a way to yield a net zero overall market beta. But in the great majority of cases, such as, for example, in 130/30 strategies, there is a residual net long exposure to the market. Consequently, for the most part, long/short strategies are correlated with the overall market, but they will tend to outperform long-only strategies during market declines, while underperforming during strong market rallies.

Modern Portfolio Theory

Theories abound as to the best way to construct equity portfolios. The most commonly used approach is mean-variance optimization, a concept developed in the 1950s by Harry Markovitz (other more modern approaches include, for example, factor models or CVAR – conditional value at risk).

If we plot the risk and expected return of the assets under consideration, in what is referred to as the investment opportunity set, we see a characteristic “bullet” shape, the upper edge of which is called the efficient frontier (See Fig. 2). Assets on the efficient frontier produce the highest level of expected return for a given level of risk. Equivalently, a portfolio lying on the efficient frontier represents the combination offering the best possible expected return for a given risk level. It transpires that for efficient portfolios, the weights to be assigned to individual assets depend only on the volatilities of the individual assets and the correlation between them, and can be determined by simple linear programming. The inclusion of a riskless asset (such as US T-bills) allows us to construct the Capital Market Line, shown in the figure, which is tangent to the efficient frontier at the portfolio with the highest Sharpe Ratio, which is consequently referred to as the Tangency or Optimal Portfolio.

Fig. 2: Investment Opportunity Set and Efficient Frontier

Source: Wikipedia

Paradise Lost

Elegant as it is, MPT is open to challenge as a suitable basis for constructing investment portfolios. The Sharpe Ratio is often an inadequate representation of the investor’s utility function – for example, a strategy may have a high Sharpe Ratio but suffer from large drawdowns, behavior unlikely to be appealing to many investors. Of greater concern is the assumption of constant correlation between the assets in the investment universe. In fact, expected returns, volatilities and correlations fluctuate all the time, inducing changes in the shape of the efficient frontier and the composition of the optimal portfolio, which may be substantial. Not only is the composition of the optimal portfolio unstable, during times of financial crisis, all assets tend to become positively correlated and move down together. The supposed diversification benefit of MPT breaks down when it is needed the most.

I want to spend a little time on these critical issues before introducing a new methodology for portfolio construction. I will illustrate the procedure using a limited investment universe consisting of the dozen stocks listed below. This is, of course, a much more restricted universe than would typically apply in practice, but it does provide a span of different sectors and industries sufficient for our purpose.

Adobe Systems Inc. (NASDAQ:ADBE)
E. I. du Pont de Nemours and Company (NYSE:DD)
The Dow Chemical Company (NYSE:DOW)
Emerson Electric Co. (NYSE:EMR)
Honeywell International Inc. (NYSE:HON)
International Business Machines Corporation (NYSE:IBM)
McDonald’s Corp. (NYSE:MCD)
Oracle Corporation (NYSE:ORCL)
The Procter & Gamble Company (NYSE:PG)
Texas Instruments Inc. (NASDAQ:TXN)
Wells Fargo & Company (NYSE:WFC)
Williams Companies, Inc. (NYSE:WMB)

If we follow the procedure outlined in the preceding section, we arrive at the following depiction of the investment opportunity set and efficient frontier. Note that in the following, the S&P 500 index is used as a proxy for the market portfolio, while the equal portfolio designates a portfolio comprising identical dollar amounts invested in each stock.

Fig. 3: Investment Opportunity Set and Efficient Frontiers for the 12-Stock Portfolio

Source: MathWorks Inc.

As you can see, we have derived not one, but two, efficient frontiers. The first is the frontier for standard portfolios that are constrained to be long-only and without use of leverage. The second represents the frontier for 130/30 long-short portfolios, in which we permit leverage of 30%, so that long positions are overweight by a total of 30%, offset by a 30% short allocation. It turns out that in either case, the optimal portfolio yields an average annual return of around 13%, with annual volatility of around 17%, producing a Sharpe ratio of 0.75.

So far so good, but here, of course, we are estimating the optimal portfolio using the entire data set. In practice, we will need to estimate the optimal portfolio with available historical data and rebalance on a regular basis over time. Let’s assume that, starting in July 1995 and rolling forward month by month, we use the latest 60 months of available data to construct the efficient frontier and optimal portfolio.

Fig. 4 below illustrates the enormous variation in the shape of the efficient frontier over time, and in the risk/return profile of the optimal long-only portfolio, shown as the white line traversing the frontier surface.

Fig. 4: Time Evolution of the Efficient Frontier and Optimal Portfolio

Source: MathWorks Inc.

We see in Fig. 5 that the outcome of using the MPT approach is hardly very encouraging: the optimal long-only portfolio underperforms the market both in aggregate, over the entire back-test period, and consistently during the period from 2000-2011. The results for a 130/30 portfolio (not shown) are hardly an improvement, as the use of leverage, if anything, has a tendency to exacerbate portfolio turnover and other undesirable performance characteristics.

Fig. 5: Value of $1,000: Optimal Portfolio vs. S&P 500 Index, Jul 1995-Jun 2014

Source: MathWorks Inc.

Part of the reason for the poor performance of the optimal portfolio lies with the assumption of constant correlation. In fact, as illustrated in Fig 6, the average correlation between the monthly returns in the twelve stocks in our universe has fluctuated very substantially over the last twenty years, ranging from a low of just over 20% to a high in excess of 50%, with an annual volatility of 38%. Clearly, the assumption of constant correlation is unsafe.

Fig. 6: Average Correlation, Jul 1995-Jun 2014

Source: Yahoo Finance, 2014

To add to the difficulties, researchers have found that the out of sample performance of the naïve portfolio, in which equal dollar value is invested in each stock, is typically no worse than that of portfolios constructed using techniques such as mean-variance optimization or factor models1. Due to the difficulty of accurately estimating asset correlations, it would require an estimation window of 3,000 months of historical data for a portfolio of only 25 assets to produce a mean-variance strategy that would outperform an equally-weighted portfolio!

Without piling on the agony with additional concerns about the MPT methodology, such as the assumption of Normality in asset returns, it is already clear that there are significant shortcomings to the approach.

Robust Portfolios

Many attempts have been made by its supporters to address the practical limitations of MPT, while other researchers have focused attention on alternative methodologies. In practice, however, it remains a challenge for any of the common techniques in use today to produce portfolios that will consistently outperform a naïve, equally-weighted portfolio. The approach discussed here represents a radical departure from standard methods, both in its objectives and in its methodology. I will discuss the general procedure without getting into all of the details, some of which are proprietary.

Let us revert for a moment to the initial discussion of market timing at the start of this article. We showed that if only we could time the market and step aside during major market declines, the outcome for the market portfolio would be a five-fold improvement in performance over the period from Aug 1990 to Jun 2014. In one sense, it would not take “much” to produce a substantial uplift in performance: what is needed is simply the ability to avoid the most extreme market drawdowns. We can identify this as a feature of what might be described as a “robust” portfolio, i.e. one with a limited tendency to participate in major market corrections. Focusing now on the general concept of “robustness”, what other characteristics might we want our ideal portfolio to have? We might consider, for example, some or all of the following:

  1. Ratio of total returns to max drawdown
  2. Percentage of profitable days
  3. Number of drawdowns and average length of drawdowns
  4. Sortino ratio
  5. Correlation to perfect equity curve
  6. Profit factor (ratio of gross profit to gross loss)
  7. Variability in average correlation

The list is by no means exhaustive or prescriptive. But these factors relate to a common theme, which we may characterize as robustness. A portfolio or strategy constructed with these criteria in mind is likely to have a very different composition and set of performance characteristics when compared to an optimal portfolio in the mean-variance sense. Furthermore, it is by no means the case that the robustness of such a portfolio must come at the expense of lower expected returns. As we have seen, a portfolio which only produces a zero return during major market declines has far higher overall returns than one that is correlated with the market. If the portfolio can be constructed in a way that will tend to produce positive returns during market downturns, so much the better. In other words, what we are describing is a long/short portfolio whose correlation to the market adapts to market conditions, having a tendency to become negative when markets are in decline and positive when they are rising.

The first insight of this approach, then, is that we use different criteria, often multi-dimensional, to define optimality. These criteria have a tendency to produce portfolios that behave robustly, performing well during market declines or periods of high volatility, as well as during market rallies.

The second insight from the robust portfolio approach arises from the observation that, ideally, we would want to see much greater consistency in the correlations between assets in the investment universe than is typically the case for stock portfolios. Now, stock correlations are what they are and fluctuate as they will – there is not much one can do about that, at least directly. One solution might be to include other assets, such as commodities, into the mix, in an attempt to reduce and stabilize average asset correlations. But not only is this often undesirable, it is unnecessary – one can, in fact, reduce average correlation levels, while remaining entirely with the equity universe.

The solution to this apparent paradox is simple, albeit entirely at odds with the MPT approach. Instead of creating our portfolio on the basis of combining a group of stocks in some weighting scheme, we are first going to develop investment strategies for each of the stocks individually, before combining them into a portfolio. The strategies for each stock are designed according to several of the criteria of robustness we identified earlier. When combined together, these individual strategies will merge to become a portfolio, with allocations to each stock, just as in any other weighting scheme. And as with any other portfolio, we can set limits on allocations, turnover, or leverage. In this case, however, the resulting portfolio will, like its constituent strategies, display many of the desired characteristics of robustness.

Let’s take a look at how this works out for our sample universe of twelve stocks. I will begin by focusing on the results from the two critical periods from March 2000 to Feb 2003 and from Jan 2007 to Feb 2009.

Fig. 7: Robust Equity Long/Short vs. S&P 500 index, Mar 2000-Feb 2003

Source: Yahoo Finance, 2014

Fig. 8: Robust Equity Long/Short vs. S&P 500 index, Jan 2007-Feb 2009

Source: Yahoo Finance, 2014

As might be imagined, given its performance during these critical periods, the overall performance of the robust portfolio dominates the market portfolio over the entire period from 1990:

Fig. 9: Robust Equity Long/Short vs. S&P 500 index, Aug 1990-Jun 2014

Source: Yahoo Finance, 2014

It is worth pointing out that even during benign market conditions, such as those prevailing from, say, the end of 2012, the robust portfolio outperforms the market portfolio on a risk-adjusted basis: while the returns are comparable for both, around 36% in total, the annual volatility of the robust portfolio is only 4.8%, compared to 8.4% for the S&P 500 index.

A significant benefit to the robust portfolio derives from the much lower and more stable average correlation between its constituent strategies, compared to the average correlation between the individual equities, which we considered before. As can be seen from Fig. 10, average correlation levels remained under 10% for the robust portfolio, compared to around 25% for the mean-variance optimal portfolio until 2008, rising only to a maximum value of around 15% in 2009. Thereafter, average correlation levels have drifted consistently in the downward direction, and are now very close to zero. Overall, average correlations are much more stable for the constituents in the robust portfolio than for those in the traditional portfolio: annual volatility at 12.2% is less than one-third of the annual volatility of the latter, 38.1%.

Fig. 10: Average Correlations Robust Equity Long/Short vs. S&P 500 index, Aug 1990-Jun 2014

Source: Yahoo Finance, 2014

The much lower average correlation levels mean that it is possible to construct fully diversified portfolios in the robust portfolio framework with fewer assets than in the traditional MPT framework. Put another way, a robust portfolio with a small number of assets will typically produce higher returns with lower volatility than a traditional, optimal portfolio (in the MPT sense) constructed using the same underlying assets.

In terms of correlation of the portfolio itself, we find that over the period from Aug 1990 to June 2014, the robust portfolio exhibits close to zero net correlation with the market. However, the summary result disguises yet another important advantage of the robust portfolio. From the scatterplot shown in Fig. 11, we can see that, in fact, the robust portfolio has a tendency to adjust its correlation according to market conditions. When the market is moving positively, the robust portfolio tends to have a positive correlation, while during periods when the market is in decline, the robust portfolio tends to have a negative correlation.

Fig. 11: Correlation between Robust Equity Long/Short vs. S&P 500 index, Aug 1990-Jun 2014

Source: Yahoo Finance, 2014

Optimal Robust Portfolios

The robust portfolio referenced in our discussion hitherto is a naïve portfolio with equal dollar allocations to each individual equity strategy. What happens if we apply MPT to the equity strategy constituents and construct an “optimal” (in the mean-variance sense) robust portfolio?

The results from this procedure are summarized in Fig. 12, which shows the evolution of the efficient frontier, traversed by the risk/return path of the optimal robust portfolio. Both show considerable variability. In fact, however, both the frontier and optimal portfolio are far more stable than their equivalents for the traditional MPT strategy.

Fig. 12: Time Evolution of the Efficient Frontier and Optimal Robust Portfolio

Source: MathWorks Inc.

Fig. 13 compares the performance of the naïve robust portfolio and optimal robust portfolio. The optimal portfolio does demonstrate a small, material improvement in risk-adjusted returns, but at the cost of an increase in the maximum drawdown. It is an open question as to whether the modest improvement in performance is sufficient to justify the additional portfolio turnover and commensurate trading cost and operational risk. The incremental benefits are relatively minor, because the equally weighted portfolio is already well-diversified due to the low average correlation in its constituent strategies.

Fig. 13: Naïve vs. Optimal Robust Portfolio Performance Aug 1990-Jun 2014

Source: Yahoo Finance, 2014

Conclusion

The limitations of MPT in terms of its underlying assumptions and implementation challenges limits its usefulness as a practical tool for investors looking to construct equity portfolios that will enable them to achieve their investment objectives. Rather than seeking to optimize risk-adjusted returns in the traditional way, investors may be better served by identifying important characteristics of strategy robustness and using these to create strategies for individual equities that perform robustly across a wide range of market conditions. By constructing portfolios composed of such strategies, rather than using the underlying equities, investors may achieve higher, more stable returns under a broad range of market conditions, including periods of high volatility or market drawdown.

1 Optimal Versus Naive Diversification: How Inefficient is the 1/N Portfolio Strategy?, Victor DeMiguel, Lorenzo Garlappi and Raman Uppal, The Review of Financial Studies, Vol. 22, Issue 5, 2007.