Kris Sidial, whose Twitter posts are often interesting, recently posted about the reality of trading profitability vs backtest performance, as follows:

While I certainly agree that the latter example is more representative of a typical trader’s P&L, I don’t concur that the first P&L curve is necessarily “99.9% garbage”. There are many strategies that have equity curves that are smoother and more monotonic than those of Kris’s Skeleton Case V2 strategy. Admittedly, most of these lie in the area of high frequency, which is not Kris’s domain expertise. But there are also lower frequency strategies that produce results which are not dissimilar to those shown the first chart.
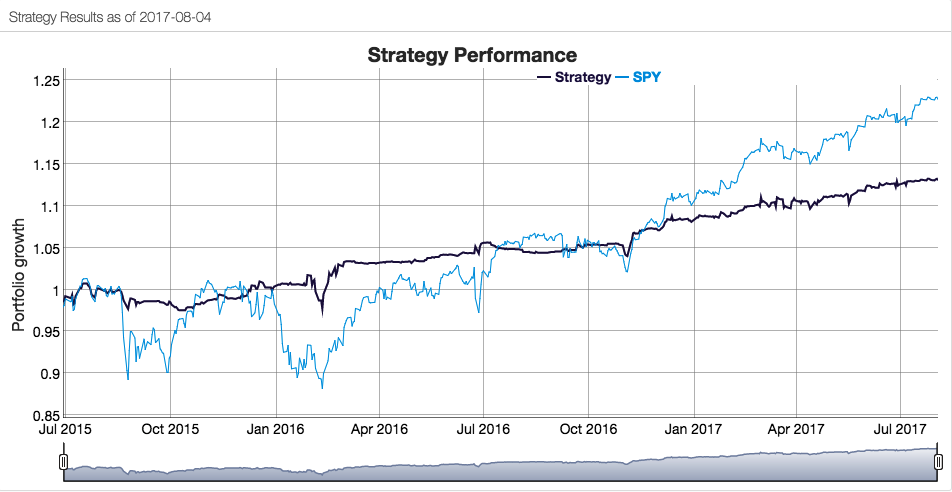
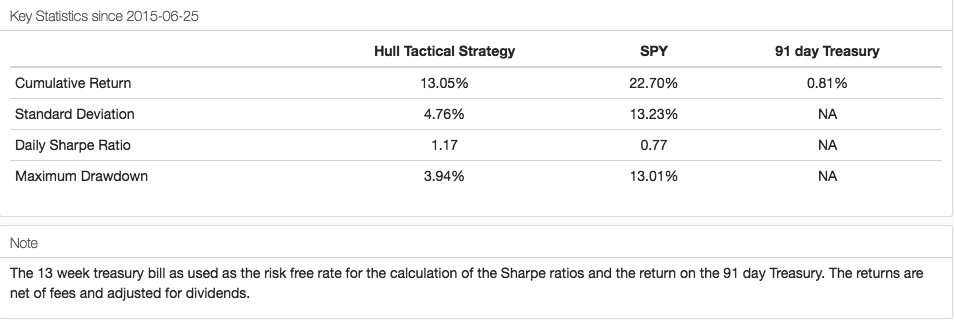
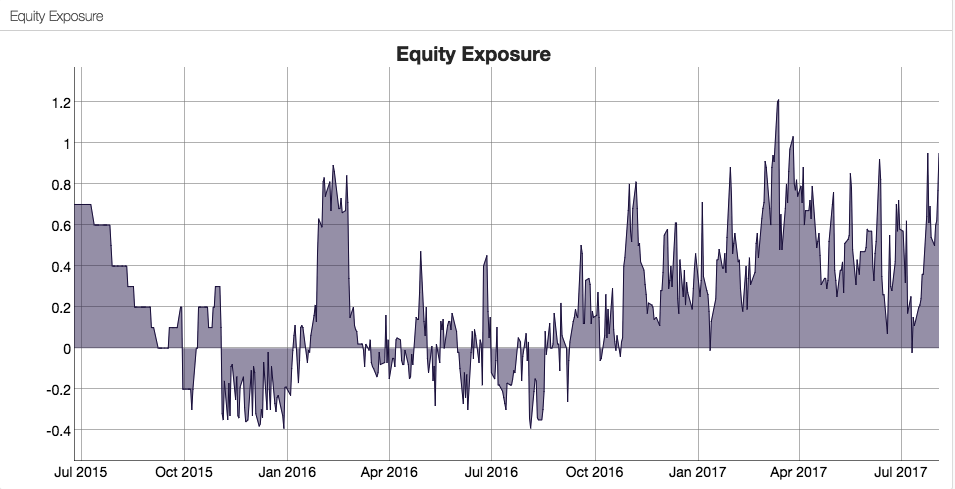
As a case in point, consider the following strategy for the S&P 500 E-Mini futures contract, described in more detail below. The strategy was developed using 15-minute bar data from 1999 to 2012, and traded live thereafter. The live and backtest performance characteristics are almost indistinguishable, not only in terms of rate of profit, but also in regard to strategy characteristics such as the no. of trades, % win rate and profit factor.


Just in case you think the picture is a little too rosy, I would point out that the average profit factor is 1.25, which means that the strategy is generating only 25% more in profits than losses. There will be big losing trades from time to time and long sequences of losses during which the strategy appears to have broken down. It takes discipline to resist the temptation to “fix” the strategy during extended drawdowns and instead rely on reversion to the mean rate of performance over the long haul. One source of comfort to the trader through such periods is that the 60% win rate means that the majority of trades are profitable.
As you read through the replies to Kris’s post, you will see that several of his readers make the point that strategies with highly attractive equity curves and performance characteristics are typically capital constrained. This is true in the case of this strategy, which I trade with a very modest amount of (my own) capital. Even trading one-lots in the E-Mini futures I occasionally experience missed trades, either on entry or exit, due to limit orders not being filled at the high or low of a bar. In scaling the strategy up to something more meaningful such as a 10-lot, there would be multiple partial fills to deal with. But I think it would be a mistake to abandon a high performing strategy such as this just because of an apparent capacity constraint. There are several approaches one can explore to address the issue, which may be enough to make the strategy scalable.
Where (as here) the issue of scalability relates to the strategy fill rate on limit orders, a good starting point is to compute the extreme hit rate, which is the proportion of trades that take place at the high or low of the bar. As a rule of thumb, for strategies running on typical low frequency infrastructure an extreme hit rate of 10% or less is manageable; anything above that level quickly becomes problematic. If the extreme hit rate is very high, e.g. 25% or more, then you are going to have to pay a great deal of attention to the issues of latency and order priority to make the strategy viable in practise. Ultimately, for a high frequency market making strategy, most orders are filled at the extreme of each “bar”, so almost all of the focus in on minimizing latency and maintaining a high queue priority, with all of the attendant concerns regarding trading hardware, software and infrastructure.
Next, you need a strategy for handling missed trades. You could, for example, decide to skip any entry trades that are missed, while manually entering unfilled exit trades at the market. Or you could post market orders for both entry and exit trades if they are not filled. An extreme solution would be to substitute market-if-touched orders for limit orders in your strategy code. But this would affect all orders generated by the system, not just the 10% at the high or low of the bar and is likely to have a very adverse affect on overall profitability, especially if the average trade is low (because you are paying an extra tick on entry and exit of every trade).
The above suggests that you are monitoring the strategy manually, running simulation and live versions side by side, so that you can pick up any trades that the strategy should have taken, but which have been missed. This may be practical for a strategy that trades during regular market hours, but not for one that also trades the overnight session.
An alternative approach, one that is commonly applied by systematic traders, is to automate the handling of missed trades. Typically the trader will set a parameter that converts a limit order to a market order X seconds after a limit price has been traded but not filled. Of course, this will result in paying up an extra tick (or more) to enter trades that perhaps would have been filled if one had waited longer than X seconds. It will have some negative impact on strategy profitability, but not too much if the extreme hit rate is low. I tend to use this method for exit trades, preferring to skip any entry trades that don’t get filled at the limit price.
Beyond these simple measures, there are several other ways to extend the capacity of the strategy. An obvious place to start is by evaluating strategy performance on different session times and bar lengths. So, in this case, we might look at deploying the strategy on both the day and night sessions. We can also evaluate performance on bars of different length. This will give different entry and exit points for individual trades and trades that are at the extreme of a bar on one timeframe may not be at the high or low of a bar on the other timescale. For example, here is the (simulated) performance of the strategy on 13 minute bars:

There is a reason for choosing a bar interval such as 13 minutes, rather than the more commonplace 5- or 10 minutes, as explained in this post:
Finally, it is worth exploring whether the strategy can be applied to other related markets such as NQ futures, for example. Typically this will entail some change to the strategy code to reflect the difference in price levels, but the thrust of the strategy logic will be similar. Another approach is to use the signals from the current strategy as inputs – i.e. alpha generators – for a derivative strategy, such as trading the SPY ETF based on signals from the ES strategy. The performance of the derived strategy may not be as good, but in a product like SPY the capacity might be larger.


