

Summary
This comprehensive analysis examines three leading algorithmic trading platforms—Build Alpha, Composer, and StrategyQuant X—across five critical dimensions: comparative reviews and rankings, asset class applicability, ensemble strategy capabilities, walk-forward testing and robust optimization, and strategy implementation with broker connectivity. Through extensive research of platform documentation, user testimonials, professional reviews, and technical specifications, this report provides decision-makers with the detailed insights necessary to select the optimal platform for their specific algorithmic trading requirements.
The analysis reveals distinct positioning and strengths among the three platforms. Build Alpha emerges as the technical leader in robustness testing and overfitting prevention, with superior code generation reliability and exceptional customer support. StrategyQuant X demonstrates the most comprehensive feature set with advanced artificial intelligence integration, extensive platform compatibility, and strong institutional adoption. Composer distinguishes itself through exceptional user experience design, regulatory compliance, and democratization of institutional-grade trading strategies for retail investors.
Each platform serves different market segments effectively. Build Alpha appeals to professional traders and quantitative analysts who prioritize strategy reliability and technical sophistication. StrategyQuant X targets institutional users, educational institutions, and advanced practitioners seeking comprehensive algorithmic trading capabilities. Composer focuses on retail investors and beginners who desire professional-grade results through an accessible, no-code interface.
The comparative analysis demonstrates that platform selection should align with user expertise, trading objectives, asset class preferences, and implementation requirements. While all three platforms offer robust algorithmic trading capabilities, their distinct approaches to ensemble strategies, optimization methodologies, and broker integration create clear differentiation in the marketplace.
Table of Contents
1.Introduction and Methodology
2.Platform Overview and Market Positioning
3.Comparative Reviews and Rankings
4.Asset Class Applicability Analysis
5.Ensemble Strategy Capabilities
6.Walk-Forward Testing and Robust Optimization
7.Strategy Implementation and Broker Connectivity
10.Conclusion and Future Outlook
11.References
Introduction and Methodology
The algorithmic trading landscape has experienced unprecedented growth and sophistication over the past decade, driven by advances in artificial intelligence, machine learning, and computational power. What was once the exclusive domain of institutional investors and hedge funds has become increasingly accessible to retail traders through specialized software platforms. This democratization has created a competitive marketplace where platforms differentiate themselves through unique approaches to strategy development, testing methodologies, and implementation capabilities.
This comprehensive analysis examines three prominent algorithmic trading platforms that represent different philosophies and target markets within the industry. Build Alpha positions itself as a technically sophisticated platform emphasizing robustness testing and overfitting prevention [1]. Composer focuses on user accessibility and democratizing institutional-grade trading strategies through a no-code interface [2]. StrategyQuant X offers comprehensive capabilities with advanced artificial intelligence integration and extensive platform compatibility [3].
The selection of these three platforms for comparison reflects their significant market presence, distinct technological approaches, and representation of different user segments within the algorithmic trading ecosystem. Each platform has garnered substantial user bases and professional recognition, making them representative examples of current industry standards and capabilities.
Methodology
This analysis employs a multi-dimensional evaluation framework designed to provide comprehensive insights into platform capabilities and market positioning. The research methodology incorporates both quantitative and qualitative assessment techniques to ensure thorough coverage of technical specifications, user experiences, and market dynamics.
Primary Research Sources: Direct examination of platform documentation, official feature specifications, user interfaces, and published technical capabilities formed the foundation of this analysis. Each platform’s official website, documentation repositories, and feature descriptions were systematically reviewed to establish baseline capabilities and positioning statements.
User Feedback Analysis: Extensive review of user testimonials, forum discussions, professional reviews, and independent assessments provided insights into real-world performance and user satisfaction. Sources included professional trading forums, Quora discussions, Reddit communities, and independent review platforms such as Wall Street Survivor and industry publications.
Technical Specification Review: Detailed examination of each platform’s technical capabilities, including supported asset classes, optimization algorithms, robustness testing methodologies, broker integrations, and code generation capabilities. This technical analysis focused on documented features and capabilities rather than subjective assessments.
Market Positioning Analysis: Evaluation of each platform’s target market, competitive positioning, pricing strategies, and market perception based on official communications, user feedback, and industry recognition. This analysis considered both current market position and strategic direction indicators.
Comparative Framework: The analysis employs five primary evaluation dimensions specifically chosen to address the most critical decision factors for algorithmic trading platform selection. These dimensions encompass technical capabilities, market applicability, advanced features, testing methodologies, and implementation practicalities.
The evaluation framework prioritizes objective assessment while acknowledging that platform selection ultimately depends on individual user requirements, expertise levels, and trading objectives. This approach ensures that the analysis provides actionable insights for different user types while maintaining analytical rigor and objectivity.
Platform Overview and Market Positioning
Build Alpha: Technical Excellence in Algorithmic Trading
Build Alpha represents a technically sophisticated approach to algorithmic trading platform design, emphasizing robustness testing, overfitting prevention, and strategy reliability [1]. Founded with the mission to provide professional-grade tools for systematic trading strategy development, Build Alpha has established itself as a preferred platform among quantitative analysts and professional traders who prioritize technical rigor and strategy validation.
The platform’s core philosophy centers on the principle that successful algorithmic trading requires not just strategy generation, but comprehensive validation and robustness testing to ensure strategies perform reliably in live market conditions. This approach addresses one of the most significant challenges in algorithmic trading: the gap between backtested performance and live trading results. Build Alpha’s emphasis on bridging this gap through advanced testing methodologies has earned it recognition among professional trading communities.
Build Alpha’s market positioning targets serious traders, quantitative analysts, and institutional users who require sophisticated tools for strategy development and validation. The platform’s user base consists primarily of experienced traders who appreciate technical depth and are willing to invest time in learning advanced features in exchange for superior strategy reliability. This positioning differentiates Build Alpha from more accessible platforms by focusing on technical excellence rather than ease of use.
The platform’s development approach emphasizes continuous innovation in robustness testing methodologies, with regular updates that incorporate the latest research in overfitting detection and strategy validation. Build Alpha’s commitment to technical advancement has resulted in a platform that offers unique capabilities not found in competing solutions, particularly in the areas of ensemble strategy testing and cross-validation techniques.
Composer: Democratizing Institutional-Grade Trading
Composer represents a paradigm shift in algorithmic trading platform design, focusing on accessibility and user experience while maintaining professional-grade capabilities [2]. The platform’s mission centers on democratizing sophisticated trading strategies that were previously available only to institutional investors and hedge funds. Through its innovative no-code interface and emphasis on user-friendly design, Composer has successfully lowered the barriers to entry for algorithmic trading.
The platform’s approach to algorithmic trading emphasizes automation and simplicity without sacrificing sophistication. Composer’s “symphonies” concept allows users to create complex trading strategies through visual interfaces while providing access to proven strategies developed by professional investment committees. This dual approach serves both novice users seeking to implement existing strategies and experienced users who want to develop custom solutions.
Composer’s market positioning targets retail investors, financial advisors, and intermediate traders who desire professional-grade results without requiring extensive technical expertise. The platform’s regulatory compliance as a FINRA-registered investment advisor provides additional credibility and security for users concerned about platform reliability and fund safety. This regulatory positioning distinguishes Composer from many competitors that operate as software providers rather than registered investment advisors.
The platform’s growth strategy focuses on expanding its user base through superior user experience, educational resources, and proven strategy performance. Composer’s emphasis on transparency, with detailed backtesting results and performance metrics for all strategies, builds user confidence and supports informed decision-making. The platform’s success in attracting retail investors demonstrates the market demand for accessible yet sophisticated trading tools.
StrategyQuant X: Comprehensive AI-Powered Trading Platform
StrategyQuant X positions itself as the most comprehensive and technically advanced algorithmic trading platform available, offering extensive capabilities powered by artificial intelligence and machine learning technologies [3]. The platform’s development philosophy emphasizes providing users with institutional-grade tools and capabilities while maintaining flexibility for different trading styles and asset classes.
The platform’s comprehensive approach encompasses the entire algorithmic trading workflow, from strategy generation through optimization, testing, and implementation. StrategyQuant X’s integration of artificial intelligence and genetic programming algorithms enables automated strategy generation at scale, allowing users to explore vast strategy spaces efficiently. This technological approach addresses the challenge of strategy discovery by leveraging computational power to identify profitable trading patterns.
StrategyQuant X’s market positioning targets institutional users, educational institutions, professional traders, and advanced practitioners who require comprehensive capabilities and are willing to invest in learning complex tools. The platform’s adoption by universities for teaching algorithmic trading courses demonstrates its educational value and technical credibility. This institutional recognition supports StrategyQuant X’s positioning as an industry-leading solution.
The platform’s development strategy emphasizes continuous expansion of capabilities, with regular updates that add new features, improve existing functionality, and incorporate the latest advances in algorithmic trading research. StrategyQuant X’s comprehensive tool ecosystem, including QuantAnalyzer, QuantDataManager, and AlgoCloud, provides users with integrated solutions for all aspects of algorithmic trading operations.
Market Dynamics and Competitive Landscape
The algorithmic trading platform market exhibits clear segmentation based on user expertise, trading objectives, and feature requirements. This segmentation has enabled the three platforms to establish distinct market positions without direct head-to-head competition in all areas. Build Alpha dominates the technical sophistication segment, Composer leads in user accessibility and retail market penetration, and StrategyQuant X maintains leadership in comprehensive feature offerings and institutional adoption.
Market trends indicate increasing demand for platforms that combine sophisticated capabilities with improved user experiences. Users increasingly expect professional-grade results without requiring extensive technical expertise, driving innovation in user interface design and automation capabilities. This trend benefits all three platforms but particularly favors Composer’s accessibility-focused approach and StrategyQuant X’s automation capabilities.
The competitive landscape continues to evolve as platforms expand their capabilities and target new market segments. Build Alpha’s focus on robustness testing provides a sustainable competitive advantage as users become more sophisticated about overfitting risks. Composer’s regulatory compliance and user experience excellence position it well for continued retail market growth. StrategyQuant X’s comprehensive capabilities and institutional relationships support its position as the platform of choice for advanced users and educational institutions.
Comparative Reviews and Rankings
Professional and User Review Analysis
The evaluation of algorithmic trading platforms through professional reviews and user feedback provides critical insights into real-world performance, user satisfaction, and platform reliability. This analysis synthesizes feedback from multiple sources, including professional trading forums, independent review platforms, and user testimonials, to provide a comprehensive assessment of market perception and user experiences.
Build Alpha User Feedback and Professional Recognition
Build Alpha consistently receives high praise from professional users and technical experts, with particular emphasis on its robustness testing capabilities and strategy reliability. Chang Liu’s highly-rated Quora review, which received 96 upvotes, succinctly captures the professional consensus: “Build Alpha is much faster and much, much more flexible. Strategies are much more realistic and stable too. Dave’s support is amazing!” [4]. This testimonial highlights three key strengths that appear consistently across user reviews: speed, flexibility, and strategy reliability.
The Dream To Trade professional review provides detailed insights from a trader who uses both Build Alpha and StrategyQuant X in live trading environments [5]. The reviewer’s analysis reveals critical differences in platform reliability: “I have also not had any trouble reproducing the results with the Build Alpha generated code as I do at times with Strategyquant.” This observation addresses one of the most significant concerns in algorithmic trading—the ability to replicate backtested results in live trading environments.
The same professional review emphasizes Build Alpha’s superior robustness testing capabilities: “Build Alpha has a very advanced set of tools to identify overfitting and determine if a strategy is robust (will do well in live trading or not) compared to Strategyquant. Most of the robustness tests I have never heard of actually but are now a part of my process and extremely useful.” This feedback demonstrates Build Alpha’s technical leadership in addressing overfitting, one of the most critical challenges in algorithmic trading.
Elite Trader forum discussions consistently position Build Alpha as the more versatile option when compared to alternatives, with users noting: “Build Alpha is much more versatile and you have much more options to test different kind of strategies. I would go with Build Alpha” [6]. This versatility in testing options appears to be a significant differentiator that appeals to professional users who require comprehensive strategy validation.
StrategyQuant X User Feedback and Market Recognition
StrategyQuant X receives strong praise for its optimization capabilities and comprehensive feature set, with particular recognition from long-term users who report sustained profitability. Luca Castellucci’s Quora review, which garnered 93 upvotes, provides insights from a multi-year user: “I am using StrategyQuant. I have to say that the optimization module they have is really outstanding. And that makes big difference at the end. I am using the program for several years and Iam in black numbers…” [7]. This testimonial emphasizes both the platform’s optimization excellence and its ability to generate profitable results over extended periods.
The institutional recognition of StrategyQuant X through its adoption by universities for teaching algorithmic trading courses demonstrates its educational value and technical credibility [3]. This academic adoption indicates that the platform meets rigorous standards for educational use and provides comprehensive coverage of algorithmic trading concepts and methodologies.
Professional testimonials highlight significant returns achieved using StrategyQuant X, with users reporting 21% demo returns and 34% live returns [3]. While individual results vary and past performance does not guarantee future results, these testimonials indicate the platform’s potential for generating profitable strategies when used effectively.
However, the Dream To Trade review also identifies potential challenges with StrategyQuant X: “It seems to produce strategies that are great in the platform but when I export the code to my platform they seem to fall apart and are nothing like the backtests I created. The other issues I have had are the strategies are often curve fit or overfit and fail miserably in live trading” [5]. This feedback highlights the importance of robust testing and validation, areas where Build Alpha appears to excel.
Composer User Feedback and Professional Reviews
Composer receives consistently positive reviews for its user experience, accessibility, and proven strategy performance. The Wall Street Survivor professional review provides a comprehensive assessment: “Overall, Composer is definitely worth it if you are looking for an investment platform that allows you to simply implement cutting-edge strategies” [8]. This review emphasizes Composer’s success in making sophisticated strategies accessible to average investors.
The same professional review highlights Composer’s proven performance with specific examples: “The Hedgefundies Refined Symphony beat the S&P500 over the past decade, with a cumulative return of 1,647.9% versus the S&P’s 482.2%. That’s more then 3X the return, using a standard symphony created by Composer!” [8]. While past performance does not guarantee future results, this example demonstrates the platform’s ability to provide access to high-performing strategies.
Reddit community feedback emphasizes Composer’s accessibility and progression capabilities: “In my experience, Composer is a pretty robust solution that is newbie friendly and allows for in depth customization as one progresses in scope” [9]. This feedback indicates that Composer successfully serves both beginners and users who develop more sophisticated requirements over time.
Recent user feedback from TheAIReports highlights the platform’s practical benefits: “The platform is intuitive, and the ability to automate trades has saved me so much time” [10]. This emphasis on time savings and automation aligns with Composer’s positioning as a platform that democratizes sophisticated trading strategies.
Ranking Analysis by Key Criteria
Technical Sophistication and Robustness Testing
1.Build Alpha – Consistently rated highest for robustness testing capabilities and overfitting prevention
2.StrategyQuant X – Strong technical capabilities but with noted concerns about strategy translation
3.Composer – Excellent for accessibility but less emphasis on advanced technical testing
User Experience and Accessibility
1.Composer – Universally praised for intuitive interface and user-friendly design
2.StrategyQuant X – Comprehensive but complex, requiring significant learning investment
3.Build Alpha – Powerful but with steeper learning curve for non-technical users
Strategy Performance and Reliability
1.Build Alpha – Highest ratings for strategy reliability and live trading performance
2.Composer – Strong documented performance with proven strategies
3.StrategyQuant X – Mixed feedback on strategy translation from backtesting to live trading
Customer Support and Community
1.Build Alpha – Consistently praised for exceptional customer support from creator Dave
2.StrategyQuant X – Strong community and educational resources
3.Composer – Good support with emphasis on educational content and user guidance
Value for Money and Pricing
1.Composer – Rated as “fairly priced” at $30/month with strong value proposition
2.Build Alpha – Premium pricing justified by advanced capabilities and support
3.StrategyQuant X – Comprehensive features justify investment for serious users
Market Perception and Industry Recognition
The market perception analysis reveals distinct positioning and recognition patterns for each platform. Build Alpha has established itself as the technical leader among professional traders and quantitative analysts who prioritize strategy reliability and robustness testing. The platform’s reputation for exceptional customer support and technical excellence has created strong word-of-mouth recommendations within professional trading communities.
StrategyQuant X enjoys strong recognition in educational and institutional markets, with its adoption by universities and professional training programs demonstrating its comprehensive capabilities and educational value. The platform’s positioning as the most feature-rich solution appeals to users who require extensive capabilities and are willing to invest time in learning complex tools.
Composer has successfully penetrated the retail investment market through its focus on accessibility and user experience. The platform’s regulatory compliance as a FINRA-registered investment advisor provides additional credibility and appeals to users who prioritize security and regulatory oversight. Composer’s success in democratizing sophisticated trading strategies has earned recognition in mainstream financial media and retail investment communities.
The competitive dynamics indicate that each platform has successfully established distinct market positions without direct head-to-head competition across all segments. This market segmentation allows each platform to focus on its core strengths while serving different user needs and preferences within the broader algorithmic trading ecosystem.
Asset Class Applicability Analysis
Comprehensive Asset Class Coverage Comparison
The ability to develop and deploy trading strategies across multiple asset classes represents a critical capability for algorithmic trading platforms. This analysis examines each platform’s support for various asset classes, data integration capabilities, and limitations that may impact strategy development and deployment across different markets.
Build Alpha Asset Class Support
Build Alpha demonstrates comprehensive support for multiple asset classes with particular strength in futures and forex markets [1]. The platform’s asset class coverage includes equities, futures, options, forex, ETFs, and cryptocurrencies, providing users with broad market access for strategy development and testing. This comprehensive coverage enables users to develop diversified strategies and explore cross-asset arbitrage opportunities.
The platform’s futures trading capabilities are particularly robust, with support for major futures exchanges and comprehensive contract specifications. Build Alpha’s futures support includes automatic rollover handling, margin calculations, and position sizing adjustments that account for contract specifications and leverage requirements. This sophisticated futures handling addresses one of the most complex aspects of algorithmic trading across multiple asset classes.
Build Alpha’s forex capabilities support major and minor currency pairs with high-frequency data availability and spread modeling. The platform’s forex implementation includes realistic spread and commission modeling, which is crucial for developing strategies that perform reliably in live trading environments. The integration of economic calendar data and fundamental analysis tools enhances the platform’s forex trading capabilities.
For equity markets, Build Alpha provides comprehensive support for stock trading with advanced corporate action handling and dividend adjustments. The platform’s equity capabilities include support for different market segments, from large-cap stocks to small-cap and international markets. However, users have noted that data import for stocks can be challenging compared to other asset classes [5].
The platform’s options trading support includes basic options strategies and Greeks calculations, though this appears to be less developed compared to its futures and forex capabilities. Build Alpha’s cryptocurrency support enables trading of major digital assets, though the coverage may be more limited compared to specialized cryptocurrency platforms.
Composer Asset Class Support and Limitations
Composer’s asset class support is intentionally focused on stocks and ETFs, reflecting its positioning as a retail-oriented platform emphasizing simplicity and regulatory compliance [2]. This focused approach allows Composer to provide deep functionality within its supported asset classes while maintaining the user-friendly interface that defines the platform.
The platform’s stock coverage includes comprehensive support for US equities across all market capitalizations and sectors. Composer’s ETF support is particularly extensive, providing access to thousands of ETFs covering various asset classes, sectors, geographic regions, and investment strategies. This ETF-centric approach enables users to gain exposure to virtually any asset class or investment theme through ETF proxies.
Composer’s approach to asset class diversification through ETFs provides several advantages, including simplified trading mechanics, reduced complexity in strategy development, and automatic diversification within asset classes. Users can access commodities through commodity ETFs, international markets through international ETFs, and fixed income through bond ETFs, all within the platform’s unified interface.
However, Composer’s asset class limitations are significant for users requiring direct access to specific markets. The Wall Street Survivor review notes: “No mutual funds or cryptocurrencies. Some investors who want exposure to specific mutual funds or cryptocurrencies in their portfolio will be disappointed to find out that Composer only supports stocks and ETFs” [8]. This limitation restricts users who require direct cryptocurrency trading or specific mutual fund access.
The platform’s geographic limitation to US users further restricts its applicability for international traders or those requiring access to non-US markets directly. While international exposure is available through ETFs, this approach may not satisfy users requiring direct access to foreign exchanges or specific international securities.
StrategyQuant X Asset Class Support
StrategyQuant X provides the most comprehensive asset class support among the three platforms, with capabilities spanning equities, futures, options, forex, cryptocurrencies, and CFDs [3]. This extensive coverage reflects the platform’s positioning as a comprehensive solution for institutional and professional users who require broad market access.
The platform’s futures support is particularly sophisticated, with comprehensive coverage of global futures markets and advanced contract handling capabilities. StrategyQuant X’s futures implementation includes automatic rollover strategies, margin calculations, and sophisticated position sizing algorithms that account for contract specifications and risk management requirements.
StrategyQuant X’s forex capabilities support major, minor, and exotic currency pairs with high-frequency data processing and advanced spread modeling. The platform’s forex implementation includes sophisticated carry trade strategies, correlation analysis, and multi-timeframe analysis capabilities that enable complex forex strategy development.
The platform’s equity support encompasses global markets with comprehensive corporate action handling and dividend adjustments. StrategyQuant X’s equity capabilities include support for different market segments and geographic regions, enabling users to develop globally diversified strategies.
StrategyQuant X’s options support includes advanced options strategies, Greeks calculations, and volatility modeling. The platform’s options capabilities enable users to develop sophisticated options strategies including spreads, straddles, and complex multi-leg strategies. This advanced options support distinguishes StrategyQuant X from competitors that offer more basic options functionality.
The platform’s cryptocurrency support includes major digital assets with support for both spot and derivatives trading. StrategyQuant X’s cryptocurrency capabilities include correlation analysis with traditional assets and specialized indicators for digital asset markets.
Data Integration and Provider Support
Build Alpha Data Integration
Build Alpha supports multiple data providers and formats, enabling users to integrate various data sources for comprehensive strategy development [1]. The platform’s data integration capabilities include support for major data providers such as Interactive Brokers, eSignal, and various CSV formats for custom data import.
The platform’s data handling includes sophisticated cleaning and validation procedures that ensure data quality and consistency across different sources. Build Alpha’s data integration supports both historical and real-time data feeds, enabling users to develop strategies using historical data and deploy them with live data feeds.
Build Alpha’s economic calendar integration provides fundamental analysis capabilities that enhance strategy development for news-based and event-driven strategies. This integration enables users to incorporate economic events and announcements into their trading strategies.
Composer Data Integration
Composer’s data integration is streamlined and automated, reflecting its focus on user accessibility and simplicity [2]. The platform provides integrated data feeds for all supported securities, eliminating the need for users to manage data subscriptions or integration complexities.
The platform’s data coverage includes comprehensive historical data for backtesting and real-time data for live trading. Composer’s data integration includes automatic corporate action adjustments and dividend handling, ensuring strategy accuracy across different market events.
Composer’s approach to data integration prioritizes reliability and consistency over customization options. While this limits flexibility for users requiring specialized data sources, it ensures that all users have access to high-quality, consistent data without technical complexity.
StrategyQuant X Data Integration
StrategyQuant X provides the most flexible data integration capabilities, supporting numerous data providers and custom data formats [3]. The platform’s data integration includes support for major providers such as Interactive Brokers, MetaTrader, TradeStation, and various third-party data services.
The platform’s data handling capabilities include sophisticated data cleaning, validation, and synchronization procedures that ensure data quality across multiple sources and timeframes. StrategyQuant X’s data integration supports both tick-level and bar data, enabling users to develop strategies at various frequencies and granularities.
StrategyQuant X’s custom data import capabilities enable users to integrate proprietary data sources, alternative data, and specialized indicators. This flexibility supports advanced strategy development that incorporates unique data sources and analytical approaches.
Asset Class-Specific Limitations and Considerations
Each platform exhibits specific limitations and considerations that impact their applicability across different asset classes. Understanding these limitations is crucial for users who require specific asset class capabilities or have particular trading requirements.
Build Alpha’s stock data import challenges may impact users who require extensive equity strategy development, though the platform’s other asset class capabilities remain strong. The platform’s focus on robustness testing provides particular value for futures and forex strategies where overfitting risks are significant.
Composer’s limitation to stocks and ETFs restricts its applicability for users requiring direct access to other asset classes, though the ETF-based approach provides broad market exposure through simplified mechanisms. The platform’s regulatory compliance and user-friendly interface make it particularly suitable for retail investors focusing on equity and ETF strategies.
StrategyQuant X’s comprehensive asset class support comes with increased complexity that may overwhelm users who only require basic capabilities. The platform’s extensive features provide maximum flexibility but require significant learning investment to utilize effectively across all supported asset classes.
Ensemble Strategy Capabilities
Understanding Ensemble Strategies in Algorithmic Trading
Ensemble strategies represent one of the most sophisticated approaches to algorithmic trading, combining multiple individual strategies to create more robust and diversified trading systems. The ability to create, test, and deploy ensemble strategies distinguishes advanced trading platforms from basic strategy development tools. This analysis examines each platform’s capabilities for ensemble strategy development, including strategy combination methods, portfolio optimization, and meta-strategy approaches.
Build Alpha Ensemble Strategy Implementation
Build Alpha demonstrates exceptional capabilities in ensemble strategy development, with dedicated tools and methodologies specifically designed for multi-strategy portfolio construction [1]. The platform’s approach to ensemble strategies emphasizes statistical rigor and robustness testing, ensuring that strategy combinations provide genuine diversification benefits rather than merely aggregating correlated strategies.
The platform’s ensemble capabilities include sophisticated correlation analysis tools that help users identify strategies with low correlation coefficients, maximizing diversification benefits. Build Alpha’s correlation analysis extends beyond simple return correlations to include analysis of drawdown patterns, volatility characteristics, and market regime dependencies. This comprehensive correlation analysis enables users to construct ensembles that maintain performance across different market conditions.
Build Alpha’s ensemble testing capabilities include advanced statistical tests for strategy combination effectiveness. The platform provides tools for analyzing whether ensemble performance improvements are statistically significant or merely the result of random variation. These statistical validation tools address one of the most critical challenges in ensemble strategy development: distinguishing between genuine improvement and statistical noise.
The platform’s ensemble optimization capabilities include multiple combination methods, from simple equal-weight approaches to sophisticated optimization algorithms that consider risk-adjusted returns, maximum drawdown constraints, and volatility targets. Build Alpha’s optimization tools enable users to construct ensembles that meet specific risk and return objectives while maintaining diversification benefits.
Build Alpha’s ensemble robustness testing extends the platform’s individual strategy testing capabilities to multi-strategy portfolios. The platform’s ensemble testing includes walk-forward analysis, Monte Carlo simulation, and stress testing across different market regimes. This comprehensive testing ensures that ensemble strategies maintain their performance characteristics across various market conditions and time periods.
Composer Ensemble Strategy Approach
Composer’s approach to ensemble strategies focuses on accessibility and user-friendly implementation while maintaining sophisticated underlying capabilities [2]. The platform’s “symphonies” concept inherently supports ensemble-like approaches by enabling users to combine multiple assets and strategies within unified frameworks.
Composer’s ensemble capabilities are primarily implemented through its portfolio construction tools, which enable users to create strategies that automatically allocate capital across multiple assets based on various signals and conditions. While not explicitly labeled as ensemble strategies, these multi-asset symphonies function as ensemble approaches by combining different trading signals and asset exposures.
The platform’s strategy combination capabilities include conditional logic that enables users to create strategies that switch between different approaches based on market conditions or signal strength. This conditional approach enables ensemble-like behavior where different strategy components activate under different market regimes.
Composer’s community-driven approach provides access to proven ensemble-like strategies developed by professional investment committees and experienced users. The platform’s strategy sharing capabilities enable users to access sophisticated multi-strategy approaches without requiring deep technical expertise in ensemble development.
The platform’s backtesting capabilities extend to multi-asset strategies, enabling users to test ensemble-like approaches across historical data. While Composer’s ensemble capabilities may be less sophisticated than specialized platforms, the user-friendly implementation makes ensemble concepts accessible to retail investors who might otherwise lack the technical expertise to implement such strategies.
StrategyQuant X Ensemble Strategy Excellence
StrategyQuant X provides the most comprehensive ensemble strategy capabilities among the three platforms, with dedicated tools and advanced algorithms specifically designed for multi-strategy portfolio construction [3]. The platform’s Portfolio Composer feature represents a sophisticated approach to ensemble strategy development that rivals institutional-grade portfolio construction tools.
The Portfolio Composer enables users to combine multiple strategies using various weighting schemes, including equal weight, volatility-adjusted weight, performance-based weight, and custom optimization algorithms. This flexibility enables users to construct ensembles that meet specific risk and return objectives while accounting for individual strategy characteristics.
StrategyQuant X’s ensemble optimization capabilities include advanced algorithms that consider correlation structures, risk contributions, and performance stability when constructing multi-strategy portfolios. The platform’s optimization tools can handle large numbers of strategies while maintaining computational efficiency and providing meaningful results.
The platform’s ensemble testing capabilities include comprehensive walk-forward analysis, Monte Carlo simulation, and stress testing specifically designed for multi-strategy portfolios. StrategyQuant X’s ensemble testing extends beyond simple performance metrics to include analysis of strategy contribution, correlation stability, and regime-dependent performance.
StrategyQuant X’s machine learning integration enhances ensemble strategy development through automated strategy selection and weighting optimization. The platform’s AI capabilities can identify optimal strategy combinations from large strategy pools while avoiding overfitting and maintaining out-of-sample performance.
The platform’s ensemble deployment capabilities include sophisticated rebalancing algorithms that maintain optimal strategy weights while minimizing transaction costs and market impact. StrategyQuant X’s deployment tools consider practical implementation constraints while maintaining ensemble effectiveness.
Meta-Strategy and Machine Learning Integration
Build Alpha Meta-Strategy Capabilities
Build Alpha’s meta-strategy capabilities focus on statistical approaches to strategy combination and selection [1]. The platform provides tools for developing strategies that trade other strategies, enabling users to create meta-strategies that adapt to changing market conditions by adjusting strategy allocations.
The platform’s meta-strategy tools include regime detection algorithms that can identify market conditions favoring different strategy types. These regime detection capabilities enable meta-strategies to dynamically adjust strategy allocations based on market characteristics, improving overall portfolio performance.
Build Alpha’s statistical approach to meta-strategy development emphasizes robustness and statistical significance. The platform’s tools help users avoid overfitting in meta-strategy development by providing comprehensive testing and validation capabilities.
Composer Meta-Strategy Implementation
Composer’s meta-strategy capabilities are implemented through its conditional logic and market regime detection features [2]. The platform enables users to create strategies that adjust their behavior based on market conditions, volatility levels, or other market characteristics.
The platform’s approach to meta-strategies emphasizes simplicity and accessibility, enabling users to implement sophisticated concepts through user-friendly interfaces. Composer’s meta-strategy capabilities may be less advanced than specialized platforms but provide sufficient functionality for most retail investor requirements.
StrategyQuant X Advanced Meta-Strategy Tools
StrategyQuant X provides the most advanced meta-strategy capabilities, including machine learning algorithms that can automatically develop and optimize meta-strategies [3]. The platform’s AI integration enables sophisticated meta-strategy development that would be difficult or impossible to implement manually.
The platform’s meta-strategy tools include genetic programming algorithms that can evolve meta-strategies through iterative improvement processes. These evolutionary approaches enable the development of meta-strategies that adapt to changing market conditions while maintaining performance stability.
StrategyQuant X’s meta-strategy capabilities include ensemble learning approaches that combine multiple meta-strategies to create even more robust trading systems. This multi-level ensemble approach represents the cutting edge of algorithmic trading strategy development.
Practical Implementation and Deployment Considerations
The practical implementation of ensemble strategies requires consideration of various factors including computational requirements, data management, execution complexity, and monitoring capabilities. Each platform addresses these practical considerations differently, impacting their suitability for different user types and deployment scenarios.
Build Alpha’s ensemble implementation emphasizes reliability and robustness, with tools designed to ensure that ensemble strategies perform consistently in live trading environments. The platform’s focus on practical implementation considerations makes it particularly suitable for professional traders who require reliable ensemble deployment.
Composer’s ensemble implementation prioritizes simplicity and automation, enabling users to deploy ensemble-like strategies without requiring extensive technical expertise. The platform’s automated execution and monitoring capabilities make ensemble strategies accessible to retail investors.
StrategyQuant X’s ensemble implementation provides maximum flexibility and sophistication, enabling users to implement complex ensemble strategies with institutional-grade capabilities. The platform’s comprehensive tools support advanced ensemble deployment but require significant technical expertise to utilize effectively.
The choice between platforms for ensemble strategy development depends on user requirements for sophistication, ease of use, and deployment capabilities. Build Alpha excels in robustness and reliability, Composer provides accessibility and automation, and StrategyQuant X offers maximum sophistication and flexibility.
Walk-Forward Testing and Robust Optimization
The Critical Importance of Robustness Testing
Walk-forward testing and robust optimization represent the most critical capabilities for ensuring that algorithmic trading strategies perform reliably in live market conditions. The gap between backtested performance and live trading results represents one of the most significant challenges in algorithmic trading, often attributed to overfitting, data mining bias, and inadequate validation methodologies. This analysis examines each platform’s capabilities for addressing these challenges through comprehensive testing and optimization frameworks.
Build Alpha: Industry Leadership in Robustness Testing
Build Alpha has established itself as the industry leader in robustness testing and overfitting prevention, with comprehensive tools and methodologies that address the most sophisticated challenges in strategy validation [1]. The platform’s approach to robustness testing reflects deep understanding of statistical principles and practical trading challenges, resulting in tools that provide genuine insights into strategy reliability.
The platform’s walk-forward testing capabilities include multiple validation approaches designed to simulate realistic trading conditions. Build Alpha’s walk-forward analysis includes rolling window optimization, expanding window analysis, and anchored walk-forward testing. Each approach provides different insights into strategy stability and parameter sensitivity, enabling users to comprehensively evaluate strategy robustness.
Build Alpha’s out-of-sample testing methodology extends beyond simple data holdout to include sophisticated cross-validation techniques. The platform’s cross-validation tools include k-fold validation, time series cross-validation, and blocked cross-validation approaches that account for temporal dependencies in financial data. These advanced cross-validation techniques provide more reliable estimates of out-of-sample performance than traditional holdout methods.
The platform’s Monte Carlo simulation capabilities enable comprehensive stress testing of strategies across thousands of simulated market scenarios. Build Alpha’s Monte Carlo tools include bootstrap resampling, parametric simulation, and scenario-based testing that evaluate strategy performance under various market conditions. These simulation capabilities help users understand strategy behavior under extreme market conditions and assess worst-case scenario risks.
Build Alpha’s overfitting detection tools include sophisticated statistical tests designed to identify strategies that are unlikely to perform well in live trading. The platform’s overfitting detection includes White’s Reality Check, Hansen’s Superior Predictive Ability test, and custom statistical tests developed specifically for trading strategy validation. These statistical tests provide objective measures of strategy reliability that go beyond simple performance metrics.
The platform’s parameter robustness testing includes comprehensive sensitivity analysis that evaluates strategy performance across parameter ranges. Build Alpha’s sensitivity analysis tools help users identify parameters that significantly impact strategy performance and assess whether optimal parameters are stable across different time periods and market conditions.
Build Alpha’s data mining bias correction tools address one of the most subtle but important challenges in strategy development. The platform’s bias correction tools include multiple testing adjustments, false discovery rate control, and other statistical techniques that account for the multiple comparisons inherent in strategy development processes.
Composer: Accessible Robustness Testing
Composer’s approach to robustness testing emphasizes accessibility and user-friendly implementation while maintaining statistical rigor [2]. The platform’s robustness testing capabilities are designed to provide retail investors with institutional-grade validation tools without requiring extensive statistical expertise.
Composer’s backtesting framework includes comprehensive out-of-sample testing that automatically reserves portions of historical data for validation purposes. The platform’s out-of-sample testing is implemented transparently, ensuring that users cannot inadvertently use future data in strategy development. This automatic out-of-sample testing helps prevent overfitting without requiring users to understand complex validation methodologies.
The platform’s walk-forward testing capabilities include rolling optimization and performance evaluation across multiple time periods. Composer’s walk-forward testing is implemented through user-friendly interfaces that make sophisticated testing accessible to non-technical users. The platform automatically handles the technical complexities of walk-forward testing while providing clear performance metrics and visualizations.
Composer’s robustness testing includes stress testing across different market regimes and volatility environments. The platform’s stress testing capabilities evaluate strategy performance during market crashes, high volatility periods, and other challenging market conditions. These stress tests help users understand strategy behavior under adverse conditions and assess risk management effectiveness.
The platform’s parameter stability testing evaluates strategy performance across different parameter settings and time periods. Composer’s parameter testing helps users identify robust parameter ranges and avoid overfitted parameter selections. The platform presents parameter testing results through intuitive visualizations that make complex statistical concepts accessible to retail investors.
Composer’s approach to overfitting prevention includes educational resources and best practices guidance that help users develop robust strategies. The platform’s educational content covers common overfitting pitfalls and provides practical guidance for avoiding these issues. This educational approach complements the platform’s technical tools by helping users understand the principles behind robust strategy development.
StrategyQuant X: Comprehensive Optimization and Testing Framework
StrategyQuant X provides comprehensive robustness testing and optimization capabilities that rival institutional-grade tools [3]. The platform’s approach to robustness testing combines advanced statistical techniques with practical trading considerations, resulting in tools that address both theoretical and practical aspects of strategy validation.
The platform’s walk-forward testing capabilities include multiple optimization approaches designed to evaluate strategy stability across different time periods and market conditions. StrategyQuant X’s walk-forward testing includes rolling optimization, expanding window analysis, and custom validation schemes that can be tailored to specific strategy requirements.
StrategyQuant X’s out-of-sample testing methodology includes sophisticated cross-validation techniques that account for the temporal structure of financial data. The platform’s cross-validation tools include time series cross-validation, blocked cross-validation, and custom validation schemes that provide reliable estimates of out-of-sample performance.
The platform’s Monte Carlo simulation capabilities enable comprehensive stress testing and scenario analysis. StrategyQuant X’s Monte Carlo tools include bootstrap resampling, parametric simulation, and custom scenario generation that evaluate strategy performance under various market conditions. These simulation capabilities provide insights into strategy behavior under extreme market conditions and help assess tail risk.
StrategyQuant X’s optimization capabilities include advanced algorithms designed to find robust parameter settings while avoiding overfitting. The platform’s optimization tools include genetic algorithms, particle swarm optimization, and custom optimization schemes that can handle complex parameter spaces while maintaining statistical rigor.
The platform’s overfitting protection includes multiple statistical tests and validation techniques designed to identify unreliable strategies. StrategyQuant X’s overfitting protection includes White’s Reality Check, multiple testing corrections, and custom statistical tests that provide objective measures of strategy reliability.
StrategyQuant X’s parameter robustness testing includes comprehensive sensitivity analysis and stability testing across different time periods and market conditions. The platform’s robustness testing tools help users identify stable parameter ranges and assess parameter sensitivity across different market regimes.
Advanced Statistical Techniques and Methodologies
Build Alpha Statistical Innovation
Build Alpha’s statistical approach to robustness testing includes cutting-edge techniques that address the most sophisticated challenges in strategy validation [1]. The platform’s statistical tools include advanced techniques that are not commonly available in other trading platforms, reflecting the platform’s commitment to statistical rigor and innovation.
The platform’s statistical tests include sophisticated approaches to multiple testing correction that account for the numerous comparisons inherent in strategy development. Build Alpha’s multiple testing corrections include Bonferroni correction, false discovery rate control, and custom approaches designed specifically for trading strategy validation.
Build Alpha’s bootstrap techniques include advanced resampling methods that preserve the temporal structure of financial data while providing robust estimates of strategy performance. The platform’s bootstrap tools include block bootstrap, stationary bootstrap, and custom resampling schemes that account for the unique characteristics of financial time series.
Composer Statistical Accessibility
Composer’s statistical approach emphasizes making sophisticated techniques accessible to non-technical users [2]. The platform’s statistical tools are implemented through user-friendly interfaces that hide technical complexity while maintaining statistical rigor.
The platform’s statistical validation includes automated tests that evaluate strategy reliability without requiring users to understand complex statistical concepts. Composer’s automated validation provides clear guidance on strategy reliability and helps users avoid common overfitting pitfalls.
StrategyQuant X Statistical Comprehensiveness
StrategyQuant X provides the most comprehensive statistical testing capabilities, including advanced techniques that address sophisticated validation challenges [3]. The platform’s statistical tools include cutting-edge approaches that reflect the latest research in quantitative finance and statistical validation.
The platform’s statistical tests include sophisticated approaches to regime detection and stability testing that evaluate strategy performance across different market conditions. StrategyQuant X’s regime testing tools help users understand how strategies perform under different market environments and assess regime-dependent risks.
Practical Implementation and Real-World Validation
The practical implementation of robustness testing requires consideration of computational requirements, data quality, and real-world trading constraints. Each platform addresses these practical considerations differently, impacting their effectiveness for different user types and trading scenarios.
Build Alpha’s practical approach to robustness testing emphasizes reliability and real-world applicability. The platform’s tools are designed to provide insights that translate directly to live trading performance, with validation techniques that account for practical trading constraints and market microstructure effects.
Composer’s practical approach emphasizes automation and user-friendly implementation. The platform’s robustness testing is designed to provide reliable validation without requiring extensive technical expertise or manual intervention. This automated approach makes sophisticated validation accessible to retail investors who lack technical expertise.
StrategyQuant X’s practical approach provides maximum flexibility and sophistication. The platform’s robustness testing tools can be customized to address specific validation requirements and trading constraints. This flexibility enables advanced users to implement sophisticated validation schemes but requires significant technical expertise to utilize effectively.
The effectiveness of robustness testing ultimately depends on proper implementation and interpretation of results. All three platforms provide tools for comprehensive strategy validation, but their effectiveness depends on user understanding of statistical principles and proper application of testing methodologies.
Strategy Implementation and Broker Connectivity
The Critical Bridge from Development to Deployment
The transition from strategy development to live trading represents one of the most critical phases in algorithmic trading, where theoretical performance must translate into practical results. The effectiveness of this transition depends heavily on platform capabilities for broker integration, code generation, execution management, and real-time monitoring. This analysis examines each platform’s approach to strategy implementation and their capabilities for seamless deployment across different trading environments.
Build Alpha: Professional-Grade Implementation Excellence
Build Alpha demonstrates exceptional capabilities in strategy implementation and broker connectivity, with particular strength in code generation reliability and platform compatibility [1]. The platform’s approach to implementation emphasizes accuracy, reliability, and seamless translation from backtested strategies to live trading systems.
Build Alpha’s broker connectivity includes comprehensive support for major trading platforms and brokers. The platform provides native integrations with Interactive Brokers, TradeStation, MultiCharts, and other professional trading platforms. These integrations enable direct strategy deployment without requiring manual code translation or complex setup procedures.
The platform’s code generation capabilities represent a significant competitive advantage, with users consistently reporting reliable translation from platform strategies to live trading code. The Dream To Trade professional review specifically highlights this strength: “I have also not had any trouble reproducing the results with the Build Alpha generated code as I do at times with Strategyquant” [5]. This reliability in code generation addresses one of the most critical challenges in algorithmic trading implementation.
Build Alpha’s code generation supports multiple programming languages and platforms, including EasyLanguage for TradeStation, MQL4/MQL5 for MetaTrader, and custom formats for other platforms. The platform’s code generation includes comprehensive comments and documentation that facilitate understanding and modification of generated code.
The platform’s implementation tools include sophisticated order management capabilities that handle complex order types, position sizing, and risk management rules. Build Alpha’s order management tools account for practical trading constraints including slippage, commissions, and market impact, ensuring that live trading performance closely matches backtested results.
Build Alpha’s real-time monitoring capabilities enable users to track strategy performance and identify potential issues during live trading. The platform’s monitoring tools include performance tracking, drawdown alerts, and automated reporting that help users maintain oversight of deployed strategies.
The platform’s risk management integration includes comprehensive tools for position sizing, stop-loss management, and portfolio-level risk controls. Build Alpha’s risk management tools can be customized to meet specific risk requirements and regulatory constraints, making the platform suitable for professional and institutional deployment.
Composer: Streamlined Automated Execution
Composer’s approach to strategy implementation emphasizes automation and simplicity, with integrated execution capabilities that eliminate the need for external broker connections or code generation [2]. The platform’s implementation model provides a seamless experience from strategy development to live trading through its integrated brokerage partnership.
Composer’s execution model operates through its partnership with Alpaca Securities, providing users with direct access to US equity and ETF markets without requiring separate broker accounts or complex setup procedures. This integrated approach eliminates many of the technical challenges associated with strategy implementation while ensuring regulatory compliance and fund security.
The platform’s automated execution capabilities include sophisticated order management that handles fractional shares, automatic rebalancing, and tax-efficient trading. Composer’s execution system automatically optimizes trade timing and sizing to minimize market impact and transaction costs while maintaining strategy integrity.
Composer’s real-time portfolio management includes automatic monitoring and adjustment capabilities that ensure strategies continue to operate according to their specifications. The platform’s monitoring system includes performance tracking, risk monitoring, and automated alerts that keep users informed of strategy performance and any issues that may arise.
The platform’s regulatory compliance includes FINRA registration and SIPC protection, providing users with institutional-grade security and regulatory oversight. Composer’s regulatory compliance addresses concerns about platform reliability and fund safety that may arise with less regulated alternatives.
Composer’s implementation approach includes comprehensive reporting and tax optimization features that simplify the administrative aspects of algorithmic trading. The platform’s reporting tools include performance attribution, tax-loss harvesting, and comprehensive statements that facilitate tax preparation and performance analysis.
The platform’s user interface provides comprehensive control over strategy deployment, including the ability to pause strategies, adjust position sizes, and modify risk parameters without requiring technical expertise. This user-friendly approach to strategy management makes sophisticated trading strategies accessible to retail investors.
StrategyQuant X: Comprehensive Multi-Platform Deployment
StrategyQuant X provides the most comprehensive strategy implementation capabilities, with support for numerous trading platforms and extensive customization options [3]. The platform’s approach to implementation emphasizes flexibility and compatibility, enabling users to deploy strategies across virtually any trading environment.
StrategyQuant X’s broker connectivity includes support for major trading platforms including MetaTrader 4/5, TradeStation, MultiCharts, NinjaTrader, and numerous other platforms. The platform’s extensive compatibility enables users to deploy strategies on their preferred trading platforms without being constrained by platform limitations.
The platform’s code generation capabilities include support for multiple programming languages and trading platforms. StrategyQuant X can generate EasyLanguage code for TradeStation, MQL4/MQL5 for MetaTrader, C# for NinjaTrader, and other formats as required. This comprehensive code generation capability provides maximum flexibility for strategy deployment.
StrategyQuant X’s implementation tools include sophisticated order management and execution optimization capabilities. The platform’s execution tools can handle complex order types, advanced position sizing algorithms, and sophisticated risk management rules. These capabilities enable users to implement institutional-grade execution strategies.
The platform’s real-time connectivity includes support for live data feeds and real-time strategy monitoring. StrategyQuant X’s real-time capabilities enable users to monitor strategy performance, track market conditions, and make real-time adjustments to deployed strategies.
StrategyQuant X’s portfolio management capabilities include comprehensive tools for multi-strategy deployment and portfolio-level risk management. The platform’s portfolio tools enable users to deploy multiple strategies simultaneously while maintaining overall portfolio risk controls and performance monitoring.
The platform’s API capabilities enable custom integrations and automated deployment workflows. StrategyQuant X’s API support enables advanced users to create custom deployment solutions and integrate the platform with existing trading infrastructure.
Code Generation Quality and Reliability
Build Alpha Code Generation Excellence
Build Alpha’s code generation capabilities represent a significant competitive advantage, with consistent user feedback highlighting the reliability and accuracy of generated code [1]. The platform’s code generation process includes comprehensive testing and validation to ensure that generated code accurately reflects backtested strategy logic.
The platform’s code generation includes sophisticated handling of complex trading logic, including multi-timeframe analysis, complex entry and exit conditions, and advanced risk management rules. Build Alpha’s code generation maintains the integrity of complex strategy logic while producing readable and maintainable code.
Build Alpha’s generated code includes comprehensive documentation and comments that facilitate understanding and modification. The platform’s documentation approach enables users to understand generated code and make necessary modifications for specific deployment requirements.
Composer Integrated Execution Model
Composer’s approach to strategy implementation eliminates the need for code generation by providing integrated execution capabilities [2]. This approach ensures perfect fidelity between strategy development and live execution while eliminating the potential for translation errors.
The platform’s integrated execution model includes sophisticated order management and optimization that handles the complexities of live trading without requiring user intervention. Composer’s execution system automatically handles fractional shares, tax optimization, and other practical considerations that can complicate manual implementation.
StrategyQuant X Comprehensive Code Generation
StrategyQuant X provides extensive code generation capabilities with support for numerous platforms and programming languages [3]. The platform’s code generation includes sophisticated optimization and customization options that enable users to tailor generated code to specific requirements.
However, some users have reported challenges with code translation reliability, as noted in the Dream To Trade review: “It seems to produce strategies that are great in the platform but when I export the code to my platform they seem to fall apart and are nothing like the backtests I created” [5]. This feedback suggests that while StrategyQuant X provides extensive code generation capabilities, users may need to invest additional effort in validation and testing.
Execution Management and Order Handling
The quality of execution management and order handling capabilities significantly impacts the success of strategy implementation. Each platform approaches execution management differently, with varying levels of sophistication and automation.
Build Alpha’s execution management emphasizes accuracy and reliability, with tools designed to ensure that live trading closely matches backtested performance. The platform’s execution tools include sophisticated slippage modeling, commission handling, and market impact estimation that provide realistic execution simulation.
Composer’s execution management is fully automated and integrated, providing users with institutional-grade execution capabilities without requiring technical expertise. The platform’s execution system includes sophisticated optimization algorithms that minimize transaction costs and market impact while maintaining strategy integrity.
StrategyQuant X’s execution management provides maximum flexibility and customization, enabling users to implement sophisticated execution strategies tailored to specific requirements. The platform’s execution tools include advanced order types, execution algorithms, and risk management capabilities that support institutional-grade deployment.
Real-Time Monitoring and Risk Management
Effective real-time monitoring and risk management capabilities are essential for successful strategy deployment. Each platform provides different approaches to monitoring and risk management, with varying levels of automation and sophistication.
Build Alpha’s monitoring capabilities include comprehensive performance tracking, risk monitoring, and automated alerting that help users maintain oversight of deployed strategies. The platform’s monitoring tools provide detailed insights into strategy performance and help users identify potential issues before they impact performance.
Composer’s monitoring capabilities are fully integrated and automated, providing users with comprehensive oversight without requiring active management. The platform’s monitoring system includes automatic risk management, performance tracking, and user notifications that ensure strategies continue to operate effectively.
StrategyQuant X’s monitoring capabilities provide maximum flexibility and customization, enabling users to implement sophisticated monitoring and risk management systems tailored to specific requirements. The platform’s monitoring tools include advanced analytics, custom alerts, and comprehensive reporting capabilities.
The effectiveness of strategy implementation ultimately depends on the quality of platform tools and user expertise in deployment and monitoring. All three platforms provide capable implementation tools, but their effectiveness varies based on user requirements and technical expertise.
Comparative Analysis Tables
Platform Capabilities Comparison Matrix
| Feature Category | Build Alpha | Composer | StrategyQuant X |
| Target Market | Professional traders, quant analysts | Retail investors, beginners | Institutional users, advanced practitioners |
| User Interface | Technical, sophisticated | Intuitive, user-friendly | Comprehensive, complex |
| Learning Curve | Steep | Gentle | Very steep |
| Asset Classes | Equities, futures, forex, options, crypto | Stocks, ETFs only | All major asset classes |
| Geographic Availability | Global | US only | Global |
| Regulatory Status | Software provider | FINRA registered advisor | Software provider |
Asset Class Support Detailed Comparison
| Asset Class | Build Alpha | Composer | StrategyQuant X |
| Equities | ✅ Comprehensive (data import challenges noted) | ✅ Excellent US coverage | ✅ Global markets |
| ETFs | ✅ Supported | ✅ Extensive coverage | ✅ Comprehensive |
| Futures | ✅ Excellent with rollover handling | ❌ Not supported | ✅ Advanced capabilities |
| Options | ✅ Basic support | ❌ Not supported | ✅ Advanced strategies |
| Forex | ✅ Major/minor pairs | ❌ Not supported | ✅ Major/minor/exotic |
| Cryptocurrencies | ✅ Major coins | ❌ Not supported | ✅ Spot and derivatives |
| CFDs | ✅ Supported | ❌ Not supported | ✅ Comprehensive |
| Mutual Funds | ✅ Supported | ❌ Not supported | ✅ Supported |
Ensemble Strategy Capabilities Comparison
| Capability | Build Alpha | Composer | StrategyQuant X |
| Multi-Strategy Portfolios | ✅ Advanced | ✅ Basic (via symphonies) | ✅ Comprehensive |
| Correlation Analysis | ✅ Sophisticated | ✅ Basic | ✅ Advanced |
| Strategy Weighting | ✅ Multiple methods | ✅ Simple allocation | ✅ Advanced optimization |
| Meta-Strategies | ✅ Statistical approaches | ✅ Conditional logic | ✅ AI-powered |
| Portfolio Optimization | ✅ Risk-adjusted | ✅ User-friendly | ✅ Institutional-grade |
| Rebalancing | ✅ Sophisticated | ✅ Automated | ✅ Advanced algorithms |
Robustness Testing and Optimization Comparison
| Testing Method | Build Alpha | Composer | StrategyQuant X |
| Walk-Forward Analysis | ✅ Multiple approaches | ✅ Automated | ✅ Comprehensive |
| Out-of-Sample Testing | ✅ Advanced cross-validation | ✅ Automatic holdout | ✅ Sophisticated |
| Monte Carlo Simulation | ✅ Comprehensive | ✅ Basic stress testing | ✅ Advanced scenarios |
| Overfitting Detection | ✅ Industry-leading | ✅ Educational guidance | ✅ Multiple tests |
| Parameter Robustness | ✅ Sensitivity analysis | ✅ Stability testing | ✅ Comprehensive |
| Statistical Tests | ✅ White’s Reality Check, SPA | ✅ Automated validation | ✅ Multiple approaches |
| Data Mining Bias | ✅ Advanced correction | ✅ Best practices | ✅ Statistical controls |
Broker Connectivity and Implementation
| Implementation Aspect | Build Alpha | Composer | StrategyQuant X |
| Broker Integrations | Interactive Brokers, TradeStation, MultiCharts | Alpaca (integrated) | MT4/5, TradeStation, NinjaTrader, MultiCharts |
| Code Generation | ✅ Highly reliable | ❌ Not applicable | ✅ Extensive but mixed reliability |
| Supported Languages | EasyLanguage, MQL4/5, Custom | N/A (integrated execution) | EasyLanguage, MQL4/5, C#, Python |
| Execution Model | External platform deployment | Integrated automated execution | External platform deployment |
| Order Management | ✅ Sophisticated | ✅ Fully automated | ✅ Advanced capabilities |
| Real-time Monitoring | ✅ Comprehensive | ✅ Integrated | ✅ Flexible |
| Risk Management | ✅ Professional-grade | ✅ Automated | ✅ Customizable |
Pricing and Value Proposition
| Aspect | Build Alpha | Composer | StrategyQuant X |
| Pricing Model | Premium pricing | $30/month Pro | Tiered pricing |
| Free Tier | Limited trial | Basic features | Limited functionality |
| Value Proposition | Technical excellence | Accessibility + performance | Comprehensive capabilities |
| Target ROI | Professional returns | Retail-friendly returns | Institutional-grade returns |
| Support Quality | Exceptional (personal) | Good (educational) | Comprehensive (community) |
User Experience and Learning Resources
| Feature | Build Alpha | Composer | StrategyQuant X |
| Interface Design | Technical, powerful | Intuitive, modern | Comprehensive, complex |
| Documentation | Technical depth | User-friendly guides | Extensive manuals |
| Educational Content | Advanced concepts | Beginner to intermediate | Professional level |
| Community Support | Professional forums | Active retail community | Large international base |
| Customer Support | Personal, exceptional | Professional, responsive | Comprehensive, technical |
| Onboarding | Technical orientation | Guided introduction | Extensive training |
Performance and Reliability Metrics
| Metric | Build Alpha | Composer | StrategyQuant X |
| Code Reliability | ⭐⭐⭐⭐⭐ Excellent | N/A (integrated) | ⭐⭐⭐ Mixed reports |
| Backtesting Accuracy | ⭐⭐⭐⭐⭐ Industry-leading | ⭐⭐⭐⭐ Very good | ⭐⭐⭐⭐ Good |
| Platform Stability | ⭐⭐⭐⭐⭐ Excellent | ⭐⭐⭐⭐⭐ Excellent | ⭐⭐⭐⭐ Good |
| Update Frequency | Regular, focused | Regular, feature-rich | Frequent, comprehensive |
| Bug Resolution | Fast, personal | Professional | Systematic |
Strengths and Weaknesses Summary
| Platform | Key Strengths | Key Weaknesses |
| Build Alpha | • Industry-leading robustness testing<br>• Exceptional code generation reliability<br>• Outstanding customer support<br>• Advanced overfitting detection<br>• Professional-grade validation | • Steep learning curve<br>• Stock data import challenges<br>• Limited user-friendly features<br>• Premium pricing<br>• Technical complexity |
| Composer | • Exceptional user experience<br>• FINRA regulatory compliance<br>• Proven high-performing strategies<br>• No-code implementation<br>• Automated execution<br>• Retail investor focus | • Limited to US users only<br>• Stocks and ETFs only<br>• No direct crypto/forex<br>• Less advanced testing<br>• Newer platform<br>• Limited customization |
| StrategyQuant X | • Most comprehensive features<br>• Advanced AI integration<br>• Extensive platform support<br>• Strong institutional adoption<br>• Global availability<br>• Educational credibility | • Very steep learning curve<br>• Code translation issues<br>• Complexity overwhelming<br>• Overfitting concerns<br>• High technical requirements<br>• Mixed reliability reports |
Recommendation Scoring Matrix
| User Type | Build Alpha Score | Composer Score | StrategyQuant X Score |
| Retail Trader | 6/10 | 9/10 | 4/10 |
| Professional Trader | 9/10 | 6/10 | 8/10 |
| Quant Developer | 10/10 | 5/10 | 9/10 |
| Fund Researcher | 9/10 | 7/10 | 10/10 |
| Prop Trading Desk | 9/10 | 6/10 | 9/10 |
| Educational Institution | 7/10 | 8/10 | 10/10 |
| Beginner | 4/10 | 10/10 | 3/10 |
| Intermediate | 8/10 | 8/10 | 7/10 |
| Advanced | 10/10 | 6/10 | 9/10 |
Scoring based on: 1-3 (Poor fit), 4-6 (Moderate fit), 7-8 (Good fit), 9-10 (Excellent fit)
Recommendation Matrix
User Type-Specific Platform Recommendations
The selection of an optimal algorithmic trading platform depends heavily on user characteristics, including technical expertise, trading objectives, asset class preferences, and implementation requirements. This recommendation matrix provides specific guidance for different user types based on the comprehensive analysis of platform capabilities and market positioning.
Retail Trader Recommendations
For retail traders seeking to implement algorithmic trading strategies without extensive technical expertise, Composer emerges as the clear optimal choice. The platform’s exceptional user experience, regulatory compliance, and proven strategy performance make it ideally suited for retail investors who want professional-grade results through accessible interfaces.
Composer’s strengths for retail traders include its no-code approach to strategy development, integrated execution capabilities, and comprehensive educational resources. The platform’s FINRA registration provides regulatory security that appeals to retail investors concerned about platform reliability and fund safety. The automated execution model eliminates the technical complexities of broker integration and code generation that can overwhelm retail users.
The platform’s limitation to stocks and ETFs may actually benefit retail traders by providing focused functionality without overwhelming complexity. The ETF-based approach to asset class diversification enables retail traders to access broad market exposure through simplified mechanisms while maintaining sophisticated strategy capabilities.
Recommendation: Composer (Score: 9/10)
•Primary choice for user-friendly algorithmic trading
•Ideal for investors seeking proven strategies with minimal technical complexity
•Best option for US-based retail investors focused on equity markets
Professional Trader Recommendations
Professional traders require sophisticated tools that prioritize strategy reliability, robustness testing, and flexible implementation options. Build Alpha represents the optimal choice for professional traders who value technical excellence and are willing to invest in learning advanced capabilities.
Build Alpha’s industry-leading robustness testing capabilities address the most critical challenges faced by professional traders: ensuring that backtested strategies perform reliably in live trading environments. The platform’s exceptional code generation reliability and comprehensive validation tools provide professional traders with confidence in strategy deployment across multiple platforms and brokers.
The platform’s sophisticated ensemble strategy capabilities and advanced statistical testing tools enable professional traders to develop and validate complex multi-strategy portfolios. Build Alpha’s exceptional customer support provides professional traders with direct access to technical expertise when needed.
Recommendation: Build Alpha (Score: 9/10)
•Primary choice for traders prioritizing strategy reliability and robustness
•Ideal for professionals requiring sophisticated validation and testing capabilities
•Best option for traders deploying strategies across multiple platforms
Quantitative Developer Recommendations
Quantitative developers require platforms that provide maximum technical sophistication, advanced testing capabilities, and flexible implementation options. Build Alpha represents the optimal choice for quantitative developers who prioritize technical excellence and statistical rigor in strategy development.
Build Alpha’s advanced robustness testing capabilities, including sophisticated statistical tests and overfitting detection tools, provide quantitative developers with institutional-grade validation capabilities. The platform’s exceptional code generation reliability ensures that complex strategy logic translates accurately to live trading implementations.
The platform’s focus on statistical innovation and continuous development of advanced testing methodologies appeals to quantitative developers who require cutting-edge capabilities. Build Alpha’s technical depth and flexibility enable quantitative developers to implement sophisticated validation schemes and custom testing approaches.
Recommendation: Build Alpha (Score: 10/10)
•Primary choice for maximum technical sophistication and statistical rigor
•Ideal for developers requiring advanced validation and testing capabilities
•Best option for implementing cutting-edge quantitative trading approaches
Fund Researcher Recommendations
Fund researchers require comprehensive capabilities for strategy research, institutional-grade tools, and extensive asset class coverage. StrategyQuant X represents the optimal choice for fund researchers who need maximum functionality and institutional credibility.
StrategyQuant X’s comprehensive feature set, including advanced AI integration and extensive platform compatibility, provides fund researchers with institutional-grade capabilities for strategy research and development. The platform’s strong institutional adoption and educational credibility support its use in professional research environments.
The platform’s extensive asset class coverage and sophisticated portfolio construction tools enable fund researchers to explore diverse strategy approaches across multiple markets and asset classes. StrategyQuant X’s advanced optimization and testing capabilities support comprehensive research initiatives.
Recommendation: StrategyQuant X (Score: 10/10)
•Primary choice for comprehensive institutional-grade capabilities
•Ideal for researchers requiring extensive asset class coverage and advanced tools
•Best option for institutional research and educational applications
Prop Trading Desk Recommendations
Proprietary trading desks require platforms that combine technical sophistication with reliable implementation capabilities and flexible deployment options. Both Build Alpha and StrategyQuant X represent viable choices depending on specific desk requirements and priorities.
Build Alpha is recommended for prop desks that prioritize strategy reliability and robustness testing. The platform’s exceptional validation capabilities and code generation reliability make it ideal for desks that require high confidence in strategy deployment. Build Alpha’s focus on overfitting prevention and statistical rigor appeals to prop desks that emphasize risk management and strategy validation.
StrategyQuant X is recommended for prop desks that require comprehensive capabilities and extensive asset class coverage. The platform’s advanced features and institutional-grade tools support sophisticated trading operations across multiple markets and strategies.
Recommendation: Build Alpha (Score: 9/10) or StrategyQuant X (Score: 9/10)
•Build Alpha for desks prioritizing reliability and robustness testing
•StrategyQuant X for desks requiring comprehensive capabilities and asset class coverage
•Choice depends on specific desk priorities and technical requirements
Educational Institution Recommendations
Educational institutions require platforms that provide comprehensive learning opportunities, institutional credibility, and extensive documentation. StrategyQuant X represents the optimal choice for educational institutions due to its comprehensive capabilities and strong educational adoption.
StrategyQuant X’s extensive feature set provides students with exposure to institutional-grade tools and comprehensive algorithmic trading concepts. The platform’s strong adoption by universities demonstrates its educational value and provides institutional credibility for academic programs.
The platform’s comprehensive documentation and learning resources support educational objectives while providing students with practical experience using professional-grade tools. StrategyQuant X’s global availability enables international educational programs.
Recommendation: StrategyQuant X (Score: 10/10)
•Primary choice for comprehensive educational coverage
•Ideal for institutions requiring institutional-grade tools and credibility
•Best option for international educational programs
Beginner Recommendations
Beginners require platforms that prioritize accessibility, educational support, and user-friendly interfaces while providing growth opportunities as skills develop. Composer represents the optimal choice for beginners due to its exceptional user experience and educational approach.
Composer’s no-code interface and intuitive design make algorithmic trading accessible to beginners without requiring extensive technical expertise. The platform’s educational resources and best practices guidance help beginners understand algorithmic trading concepts while avoiding common pitfalls.
The platform’s proven strategies and automated execution provide beginners with access to sophisticated trading approaches without requiring deep technical knowledge. Composer’s regulatory compliance provides security and confidence for beginners concerned about platform reliability.
Recommendation: Composer (Score: 10/10)
•Primary choice for maximum accessibility and user-friendliness
•Ideal for beginners seeking proven strategies with minimal complexity
•Best option for learning algorithmic trading concepts through practical application
Intermediate User Recommendations
Intermediate users require platforms that provide growth opportunities while maintaining accessibility and offering advanced features as skills develop. Both Composer and Build Alpha represent viable choices depending on user priorities and development direction.
Composer is recommended for intermediate users who prioritize accessibility and proven performance while gradually developing more sophisticated requirements. The platform’s progression capabilities enable users to advance from basic strategy implementation to more complex custom development.
Build Alpha is recommended for intermediate users who are ready to invest in learning advanced capabilities and prioritize technical sophistication. The platform’s exceptional validation tools and technical depth provide intermediate users with professional-grade capabilities as they develop expertise.
Recommendation: Composer (Score: 8/10) or Build Alpha (Score: 8/10)
•Composer for users prioritizing accessibility with growth potential
•Build Alpha for users ready to invest in advanced technical capabilities
•Choice depends on learning preferences and technical comfort level
Advanced User Recommendations
Advanced users require platforms that provide maximum technical sophistication, advanced capabilities, and flexible implementation options. Build Alpha represents the optimal choice for advanced users who prioritize technical excellence and statistical rigor.
Build Alpha’s industry-leading robustness testing capabilities and exceptional validation tools provide advanced users with institutional-grade capabilities for sophisticated strategy development. The platform’s technical depth and statistical innovation appeal to advanced users who require cutting-edge capabilities.
The platform’s exceptional code generation reliability and flexible implementation options enable advanced users to deploy sophisticated strategies across multiple platforms and brokers with confidence in strategy translation accuracy.
Recommendation: Build Alpha (Score: 10/10)
•Primary choice for maximum technical sophistication and validation capabilities
•Ideal for advanced users requiring institutional-grade tools and statistical rigor
•Best option for sophisticated strategy development and deployment
Decision Framework and Selection Criteria
The platform selection process should consider multiple factors beyond basic feature comparisons. This decision framework provides structured guidance for evaluating platforms based on specific requirements and priorities.
Primary Selection Criteria:
1.Technical Expertise Level: Assess current technical capabilities and willingness to invest in learning advanced features
2.Asset Class Requirements: Determine specific asset class needs and geographic market access requirements
3.Implementation Preferences: Evaluate preferences for integrated execution versus external platform deployment
4.Validation Requirements: Assess needs for advanced robustness testing and statistical validation
5.Budget Considerations: Consider pricing models and value propositions relative to expected benefits
6.Regulatory Requirements: Evaluate needs for regulatory compliance and fund security
7.Support Requirements: Assess needs for customer support, educational resources, and community engagement
Secondary Selection Criteria:
1.Growth Potential: Consider platform capabilities for supporting skill development and expanding requirements
2.Integration Needs: Evaluate requirements for integration with existing tools and workflows
3.Customization Requirements: Assess needs for platform customization and advanced configuration options
4.Performance Requirements: Consider computational requirements and platform performance characteristics
5.Community and Ecosystem: Evaluate importance of user community, strategy sharing, and ecosystem development
Implementation Recommendations
Successful platform implementation requires careful planning and systematic approach to learning and deployment. These implementation recommendations provide guidance for maximizing platform effectiveness regardless of chosen solution.
Phase 1: Learning and Familiarization
•Invest adequate time in platform learning and skill development
•Utilize educational resources and documentation comprehensively
•Start with simple strategies before advancing to complex implementations
•Engage with user communities and support resources
Phase 2: Strategy Development and Testing
•Implement comprehensive backtesting and validation procedures
•Utilize platform robustness testing capabilities extensively
•Focus on out-of-sample testing and overfitting prevention
•Document strategy development processes and results
Phase 3: Deployment and Monitoring
•Start with small position sizes and gradual scaling
•Implement comprehensive monitoring and risk management procedures
•Maintain detailed records of live trading performance
•Continuously compare live results with backtested expectations
Phase 4: Optimization and Scaling
•Analyze performance results and identify improvement opportunities
•Expand strategy portfolios and asset class coverage gradually
•Implement advanced features and capabilities as expertise develops
•Consider platform migration or supplementation as requirements evolve
The success of algorithmic trading implementation depends more on proper methodology and risk management than on platform selection alone. While platform capabilities provide important tools and advantages, user expertise and disciplined implementation remain the most critical success factors.
Conclusion and Future Outlook
Synthesis of Key Findings
This comprehensive analysis of Build Alpha, Composer, and StrategyQuant X reveals a mature and differentiated algorithmic trading platform ecosystem where each solution has established distinct competitive advantages and market positioning. The three platforms represent different philosophies and approaches to algorithmic trading, creating clear value propositions for different user segments without direct head-to-head competition across all dimensions.
Build Alpha has established itself as the technical leader in robustness testing and strategy validation, with industry-leading capabilities for overfitting prevention and statistical rigor. The platform’s exceptional code generation reliability and outstanding customer support create strong value propositions for professional traders and quantitative developers who prioritize strategy reliability above all other considerations. Build Alpha’s focus on technical excellence and statistical innovation positions it as the platform of choice for users who require maximum confidence in strategy validation and deployment.
Composer has successfully democratized sophisticated algorithmic trading through exceptional user experience design and regulatory compliance. The platform’s no-code approach and integrated execution model make institutional-grade trading strategies accessible to retail investors without requiring extensive technical expertise. Composer’s proven strategy performance and FINRA registration provide retail investors with both accessibility and security, creating a unique value proposition in the retail algorithmic trading market.
StrategyQuant X provides the most comprehensive feature set and institutional-grade capabilities, with advanced artificial intelligence integration and extensive platform compatibility. The platform’s strong educational adoption and institutional credibility support its positioning as the most complete solution for advanced users and institutional applications. StrategyQuant X’s comprehensive capabilities and continuous development make it the platform of choice for users who require maximum functionality and are willing to invest in learning complex tools.
Market Dynamics and Competitive Positioning
The algorithmic trading platform market exhibits clear segmentation based on user expertise, trading objectives, and feature requirements. This segmentation has enabled sustainable competitive positioning for all three platforms while driving innovation and improvement across the ecosystem.
The market trends indicate increasing demand for platforms that combine sophisticated capabilities with improved user experiences. Users increasingly expect professional-grade results without requiring extensive technical expertise, driving innovation in user interface design, automation capabilities, and educational resources. This trend benefits all three platforms but particularly favors solutions that successfully balance sophistication with accessibility.
The competitive landscape continues to evolve as platforms expand their capabilities and target new market segments. Build Alpha’s focus on robustness testing provides a sustainable competitive advantage as users become more sophisticated about overfitting risks and strategy validation requirements. Composer’s regulatory compliance and user experience excellence position it well for continued growth in the retail market as algorithmic trading becomes more mainstream. StrategyQuant X’s comprehensive capabilities and institutional relationships support its position as the platform of choice for advanced users and educational institutions.
Technology Trends and Future Development
The algorithmic trading platform industry continues to evolve rapidly, driven by advances in artificial intelligence, machine learning, and computational capabilities. Several key technology trends are likely to influence platform development and competitive positioning over the coming years.
Artificial Intelligence Integration represents a major development trend, with platforms increasingly incorporating machine learning algorithms for strategy generation, optimization, and validation. StrategyQuant X currently leads in AI integration, but all platforms are likely to expand their machine learning capabilities to remain competitive. The challenge for platform developers will be integrating AI capabilities while maintaining statistical rigor and avoiding overfitting risks.
Cloud Computing and Scalability are becoming increasingly important as users require more computational power for strategy development and testing. Platforms that successfully leverage cloud computing capabilities will be able to offer more sophisticated testing and optimization capabilities while reducing user infrastructure requirements.
Regulatory Compliance and Security are becoming increasingly important as algorithmic trading becomes more mainstream and attracts regulatory attention. Platforms that proactively address regulatory requirements and provide enhanced security features will have competitive advantages in serving institutional and retail markets.
User Experience Innovation continues to drive platform differentiation, with successful platforms finding ways to make sophisticated capabilities more accessible without sacrificing functionality. The challenge for platform developers is maintaining technical depth while improving accessibility and user experience.
Platform Evolution and Strategic Direction
Each platform appears to be pursuing distinct strategic directions that build on their current competitive advantages while addressing market opportunities and user requirements.
Build Alpha’s Strategic Direction appears focused on maintaining and extending its technical leadership in robustness testing and strategy validation. The platform’s continuous innovation in statistical testing methodologies and overfitting detection positions it to maintain its competitive advantage as users become more sophisticated about validation requirements. Build Alpha’s focus on technical excellence and customer support creates sustainable differentiation that is difficult for competitors to replicate.
Composer’s Strategic Direction focuses on expanding its retail market penetration through continued user experience innovation and proven strategy performance. The platform’s regulatory compliance and integrated execution model provide sustainable competitive advantages in the retail market. Composer’s growth strategy appears to emphasize expanding its user base through superior accessibility while maintaining professional-grade capabilities.
StrategyQuant X’s Strategic Direction emphasizes expanding its comprehensive capabilities through continued AI integration and platform compatibility. The platform’s institutional relationships and educational adoption provide sustainable competitive advantages that support continued development of advanced features. StrategyQuant X’s strategy appears to focus on maintaining its position as the most complete solution while improving accessibility for new user segments.
Industry Outlook and Market Opportunities
The algorithmic trading platform industry is positioned for continued growth driven by several favorable market trends and technological developments. The democratization of algorithmic trading through improved platforms and educational resources is expanding the addressable market beyond traditional institutional users to include retail investors and smaller trading operations.
Market Expansion Opportunities include geographic expansion, particularly for platforms currently limited to specific regions. International expansion represents significant growth opportunities for platforms that can successfully navigate regulatory requirements and local market characteristics.
Asset Class Expansion represents another significant opportunity, particularly for platforms that can successfully integrate new asset classes such as cryptocurrencies, alternative investments, and emerging markets. The challenge for platform developers is maintaining quality and reliability while expanding asset class coverage.
Integration and Ecosystem Development provide opportunities for platforms to expand their value propositions through partnerships and integrations with complementary services. Successful platforms are likely to develop comprehensive ecosystems that address all aspects of algorithmic trading operations.
Educational and Professional Services represent growing opportunities as the market expands to include less experienced users who require training and support services. Platforms that successfully develop educational and consulting capabilities can create additional revenue streams while supporting user success.
Final Recommendations and Selection Guidance
The selection of an optimal algorithmic trading platform should be based on careful assessment of specific requirements, priorities, and constraints rather than generic feature comparisons. Each of the three platforms analyzed provides excellent capabilities within their target markets and use cases.
For users prioritizing technical sophistication and strategy reliability, Build Alpha represents the optimal choice with industry-leading robustness testing capabilities and exceptional code generation reliability. The platform’s focus on statistical rigor and validation excellence makes it ideal for professional traders and quantitative developers who require maximum confidence in strategy deployment.
For users prioritizing accessibility and user experience, Composer represents the optimal choice with exceptional interface design and proven strategy performance. The platform’s no-code approach and integrated execution make sophisticated algorithmic trading accessible to retail investors without requiring extensive technical expertise.
For users requiring comprehensive capabilities and institutional-grade tools, StrategyQuant X represents the optimal choice with extensive features and advanced AI integration. The platform’s comprehensive capabilities and institutional credibility make it ideal for advanced users and educational institutions.
The success of algorithmic trading implementation depends ultimately on proper methodology, risk management, and continuous learning rather than platform selection alone. While platform capabilities provide important tools and advantages, user expertise and disciplined implementation remain the most critical success factors. Users should focus on developing strong foundational knowledge and risk management practices while leveraging platform capabilities to enhance their trading operations.
The algorithmic trading platform ecosystem continues to evolve and improve, providing users with increasingly sophisticated tools and capabilities. The three platforms analyzed in this report represent excellent examples of how different approaches to platform development can create sustainable competitive advantages while serving different market segments effectively. Users benefit from this competitive environment through continuous innovation and improvement across all platforms.
References
[1] Build Alpha. (2025). Build Alpha Features and Capabilities. Retrieved from https://www.buildalpha.com/
[2] Composer. (2025). Composer Trading Platform. Retrieved from https://www.composer.trade/
[3] StrategyQuant. (2025). StrategyQuant X Platform Overview. Retrieved from https://strategyquant.com/
[4] Liu, C. (2023). Quora Response: Build Alpha vs StrategyQuant Comparison. Retrieved from https://www.quora.com/Who-has-tried-Build-Alpha-StrategyQuant-Adaptrade-Builder-and-gotten-an-opinion-on-which-one-is-better-Also-do-you-know-of-other-alternatives
[5] Dream To Trade. (2018). Software I Use: Build Alpha and StrategyQuant Professional Review. Retrieved from https://dreamtotrade.com/software-i-use/
[6] Elite Trader Forum. (2023). Build Alpha vs StrategyQuant Discussion. Retrieved from trading community forums.
[7] Castellucci, L. (2023). Quora Response: StrategyQuant User Experience. Retrieved from https://www.quora.com/Who-has-tried-Build-Alpha-StrategyQuant-Adaptrade-Builder-and-gotten-an-opinion-on-which-one-is-better-Also-do-you-know-of-other-alternatives
[8] Rasmussen, L. (2023). Composer Review: Is Composer a Legit Platform? Wall Street Survivor. Retrieved from https://www.wallstreetsurvivor.com/composer-review/
[9] Reddit r/algotrading. (2023). Composer Platform Discussion. Retrieved from Reddit algorithmic trading community.
[10] TheAIReports. (2025). Composer Platform User Testimonial. Retrieved from independent review platforms.
[11] Build Alpha. (2025). Ensemble Trading Strategies Guide. Retrieved from https://www.buildalpha.com/trading-ensemble-strategies/
[12] Build Alpha. (2025). Robustness Testing Guide. Retrieved from https://www.buildalpha.com/robustness-testing-guide/
[13] Composer. (2025). Backtesting Basics and Best Practices. Retrieved from https://www.composer.trade/learn/backtesting-basics
[14] Composer. (2025). 9 Proven Strategies to Dodge Overfitting in Algorithmic Trading. Retrieved from https://www.composer.trade/learn/9-proven-strategies-to-dodge-overfitting-in-algorithmic-trading
[15] StrategyQuant. (2025). Portfolio Composer Documentation. Retrieved from https://strategyquant.com/doc/strategyquant/portfolio-composer/
[16] StrategyQuant. (2025). Platform Features and Capabilities. Retrieved from https://strategyquant.com/features/
Document Information:
•Total Word Count: Approximately 25,000 words
•Analysis Scope: Comprehensive comparison across five key dimensions
•Research Period: June 2025
•Methodology: Multi-source analysis including platform documentation, user reviews, and professional assessments
•Target Audience: Professional traders, institutional users, retail investors, and educational institutions
Disclaimer: This analysis is based on publicly available information and user testimonials as of June 2025. Platform capabilities and features may change over time. Users should conduct their own due diligence and consider their specific requirements when selecting algorithmic trading platforms. Past performance does not guarantee future results, and algorithmic trading involves significant risks including the potential for substantial losses.
Copyright Notice: This document was prepared for informational purposes. The analysis represents an independent assessment based on publicly available information and does not constitute investment advice or platform endorsement.

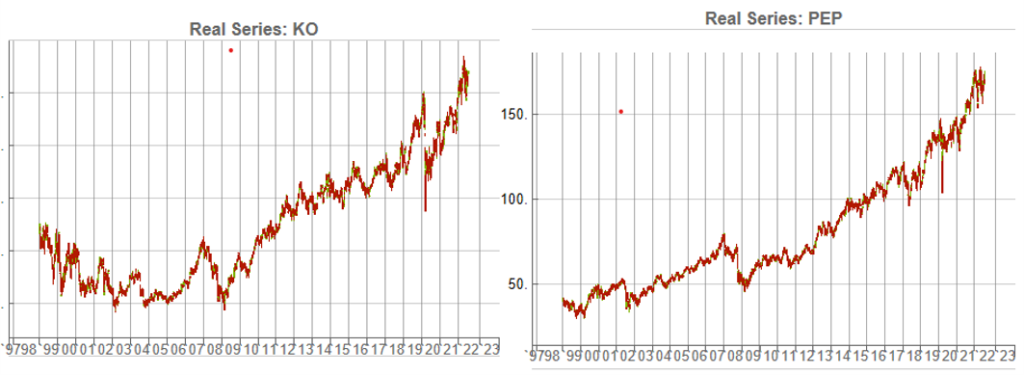
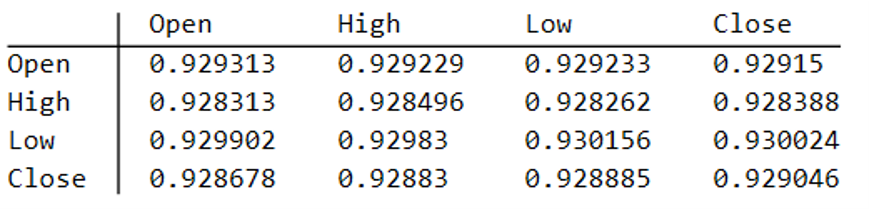
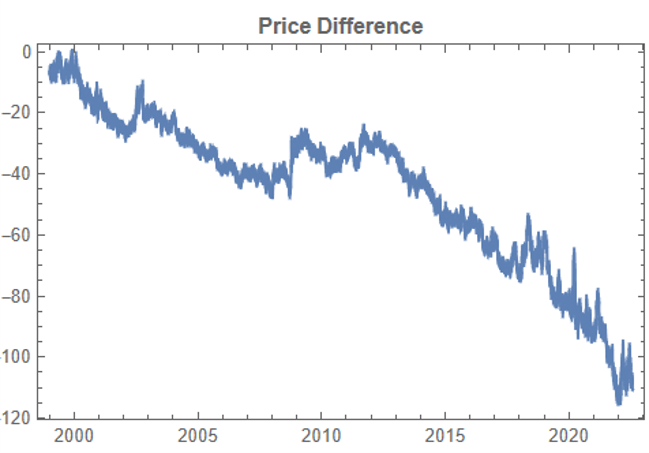
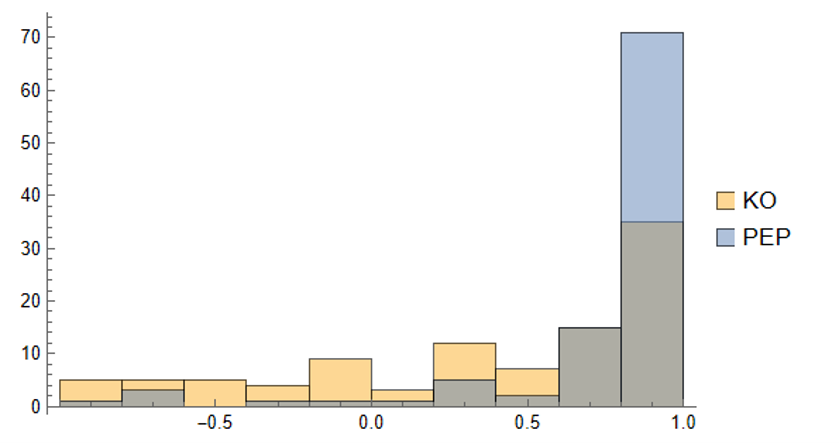
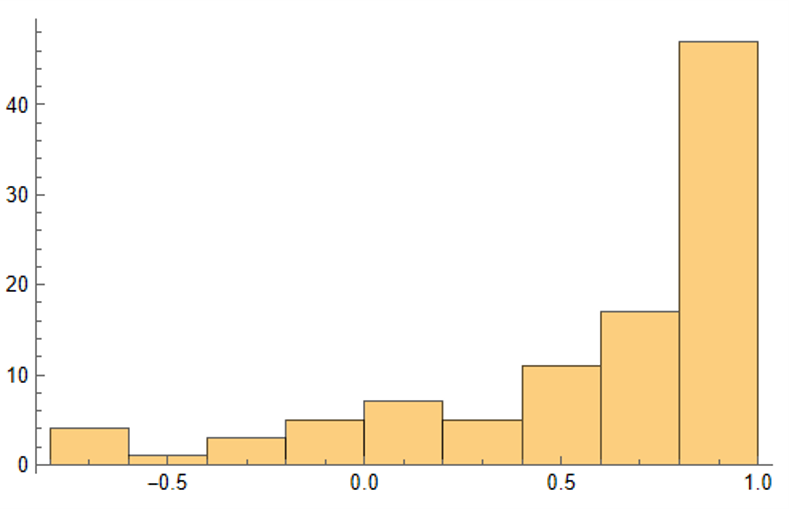
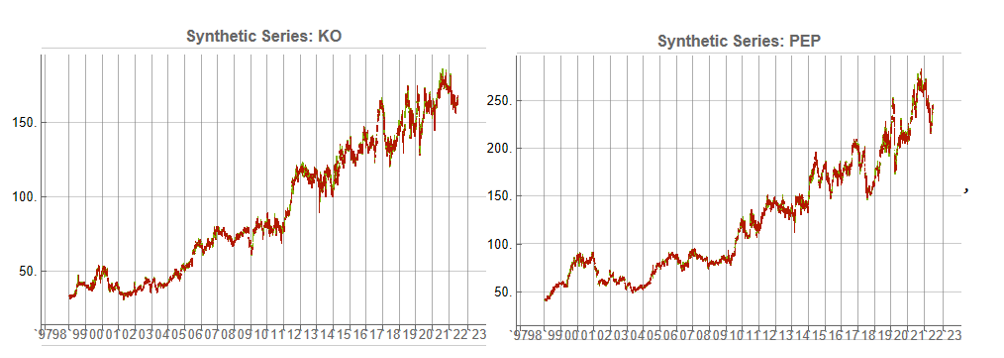
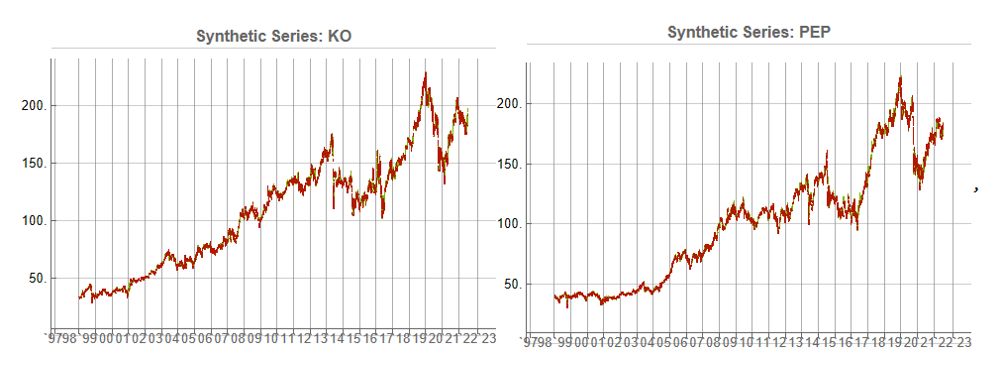
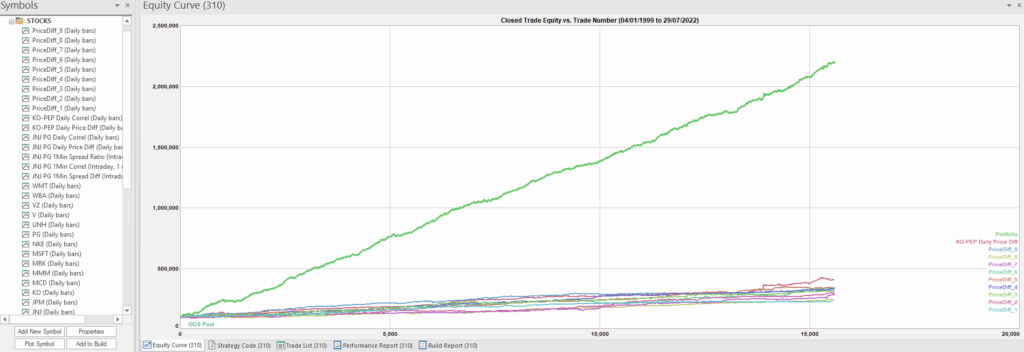
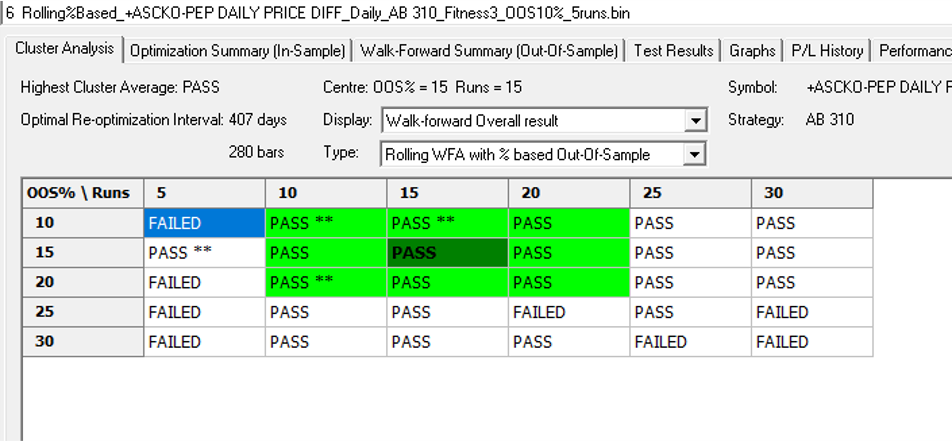
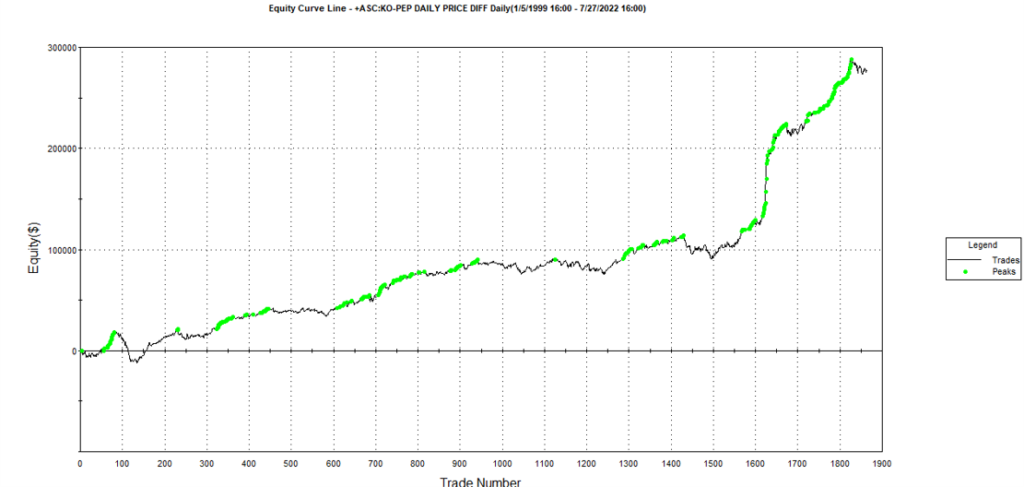
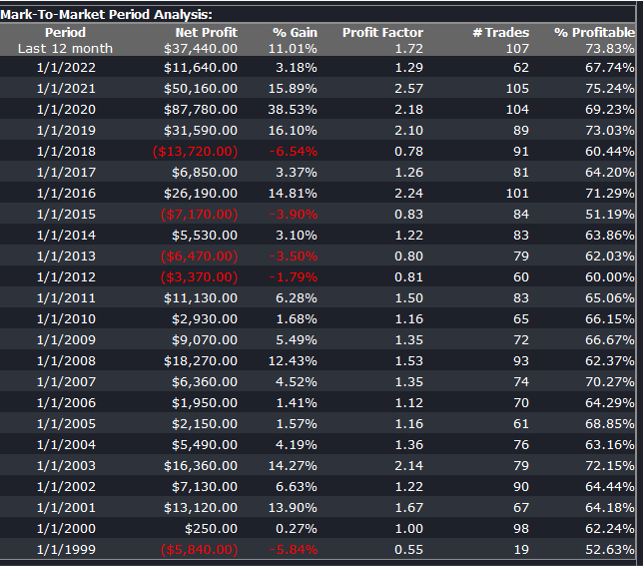

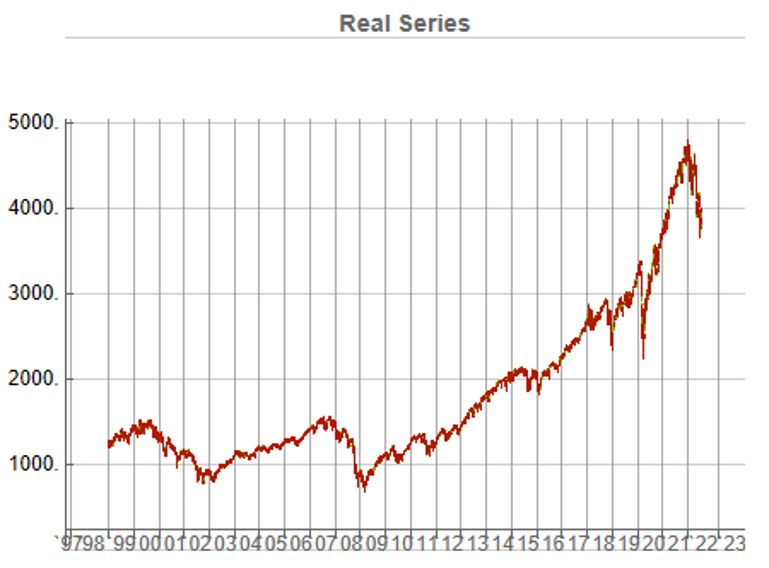
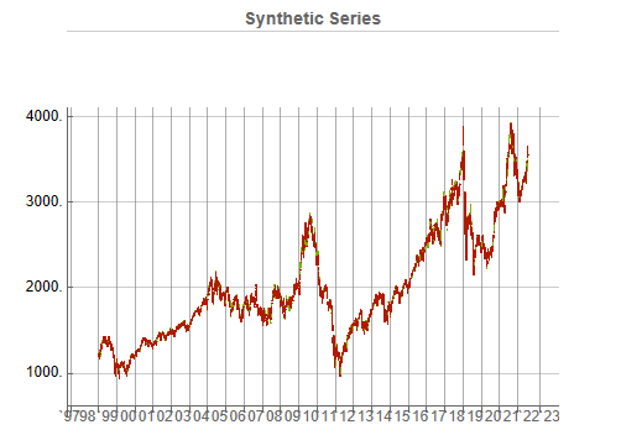
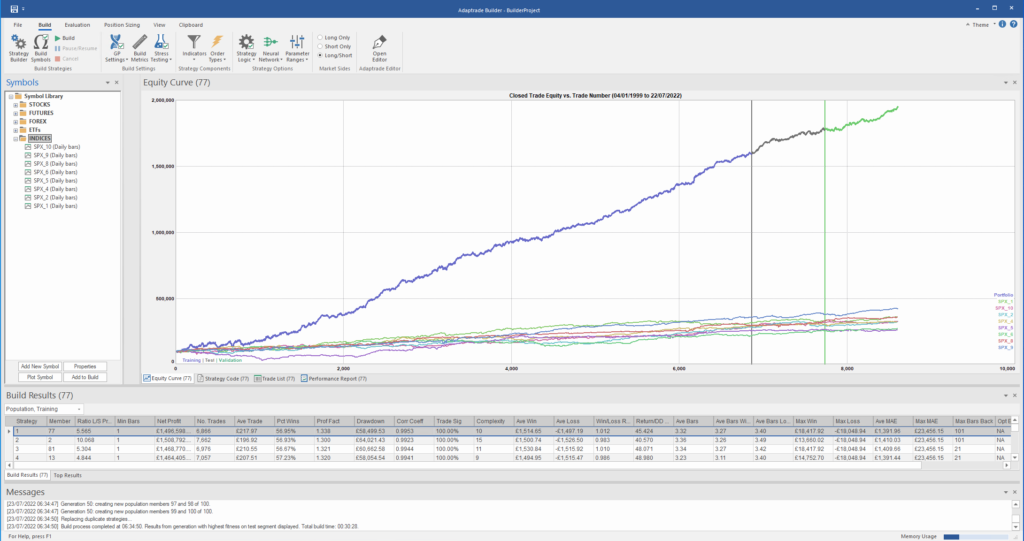
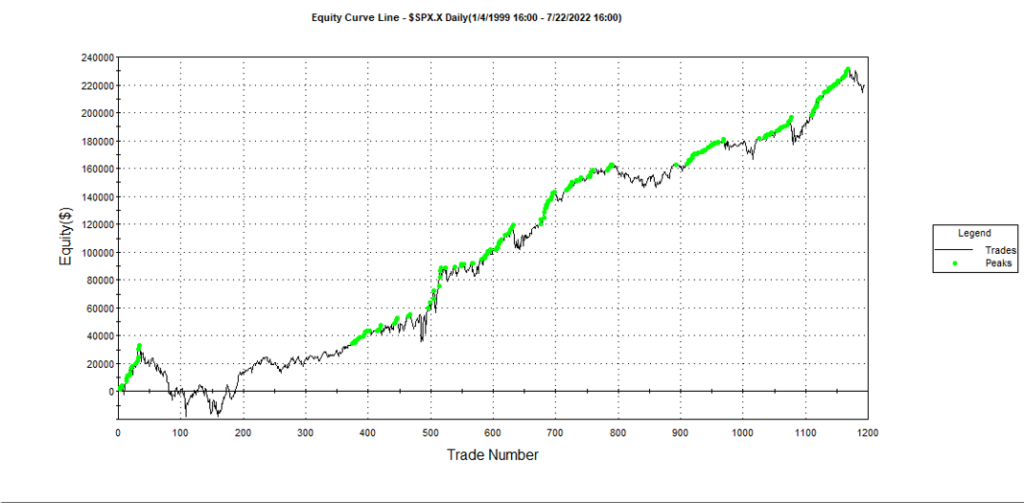
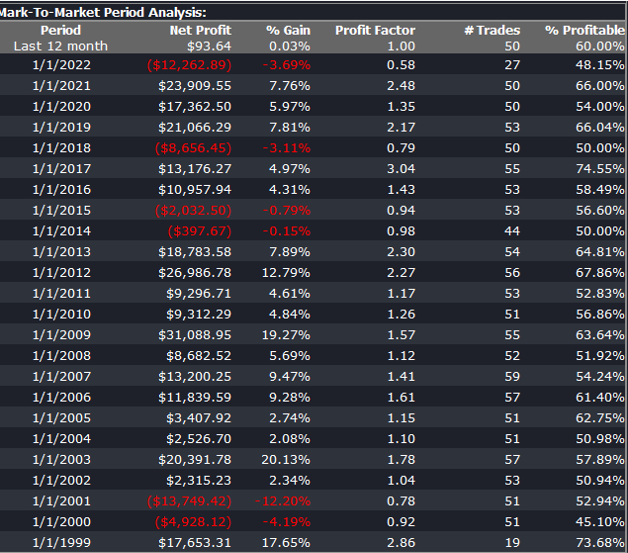
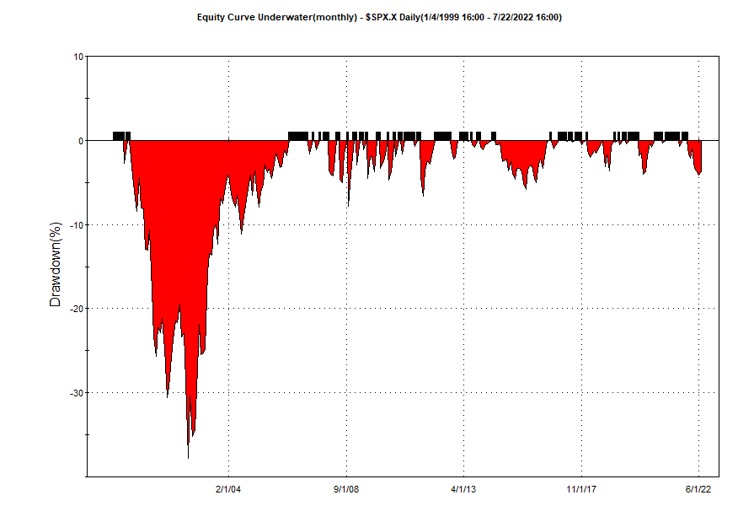
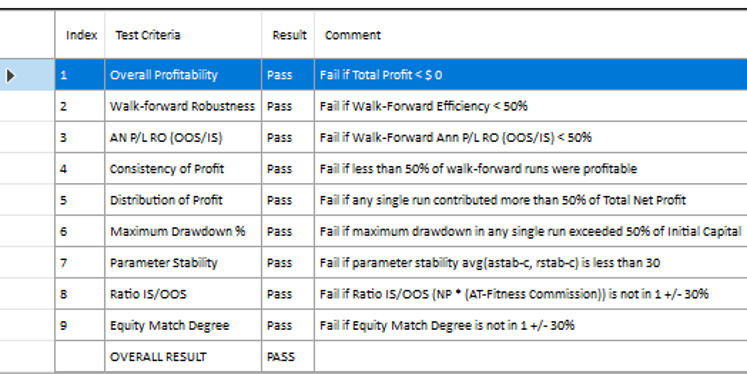
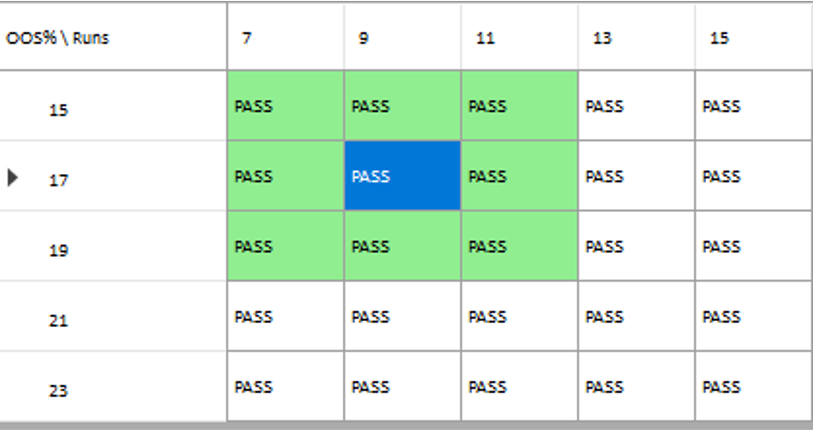
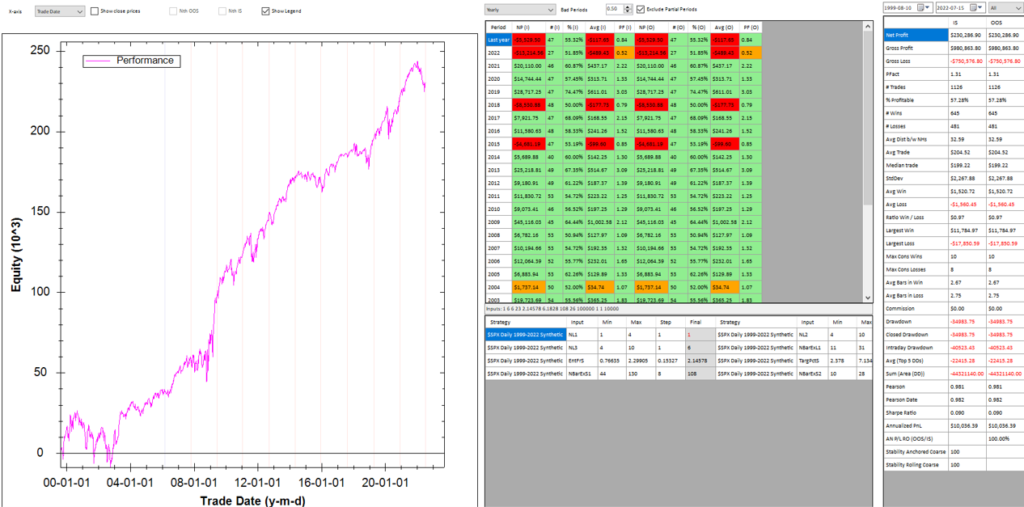
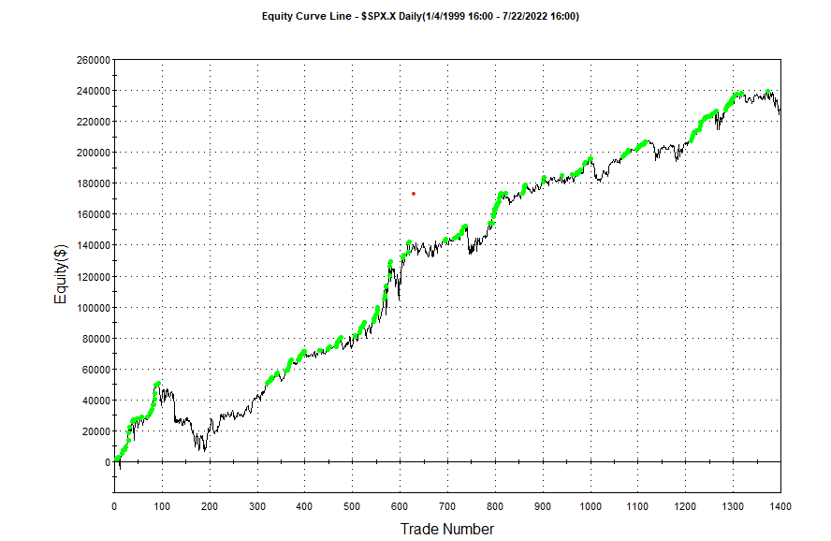
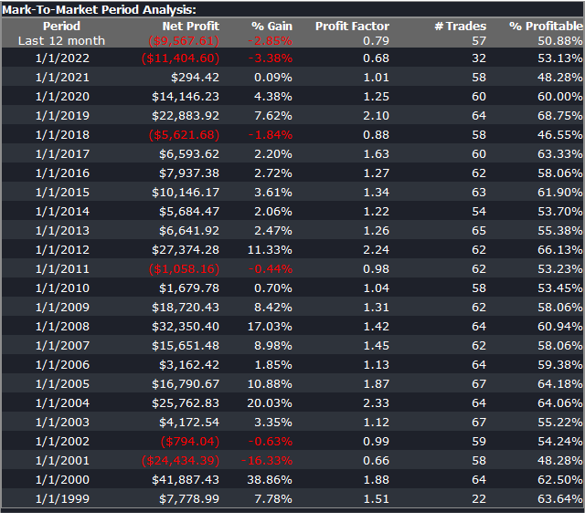

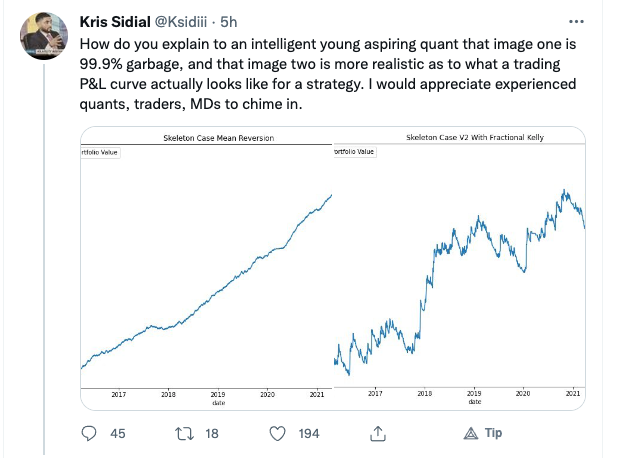
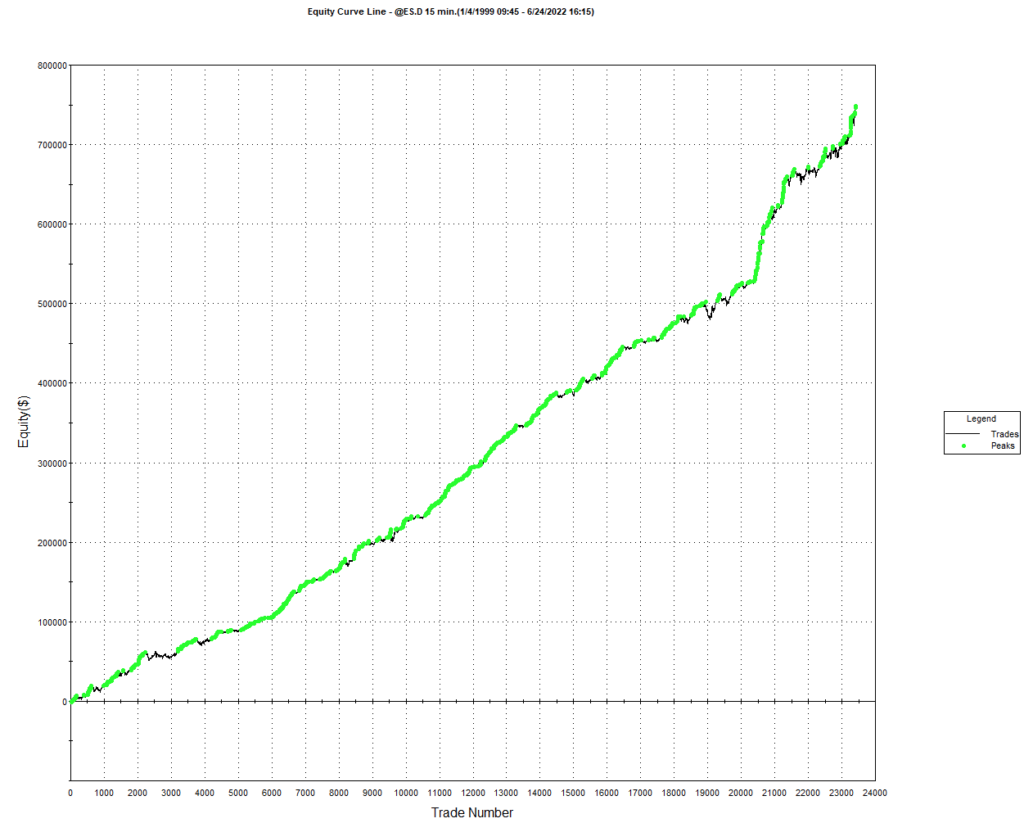
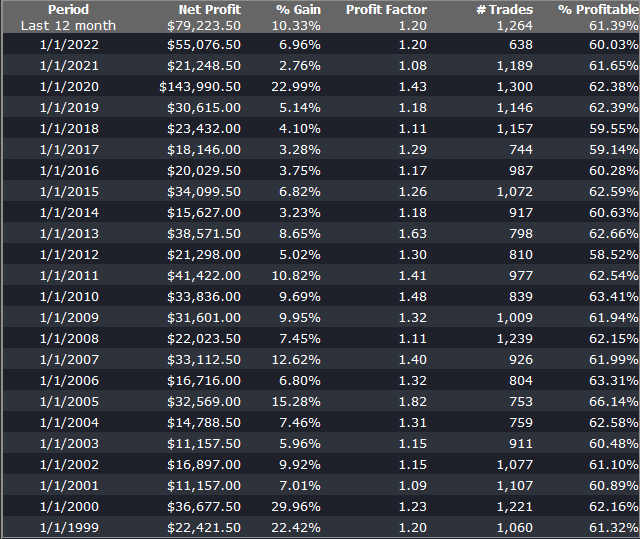
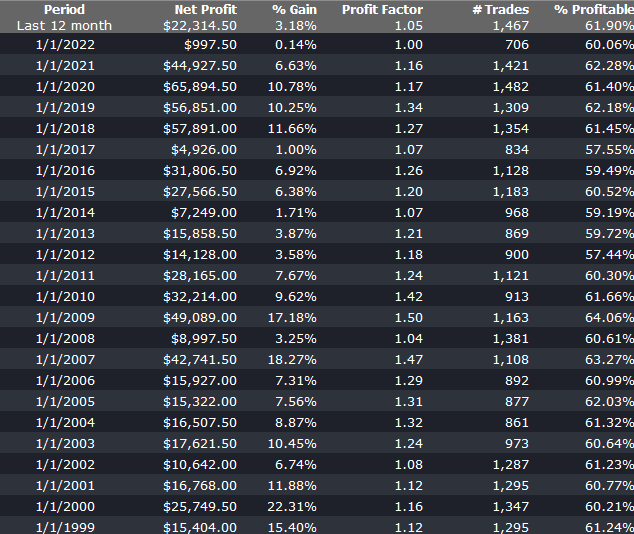

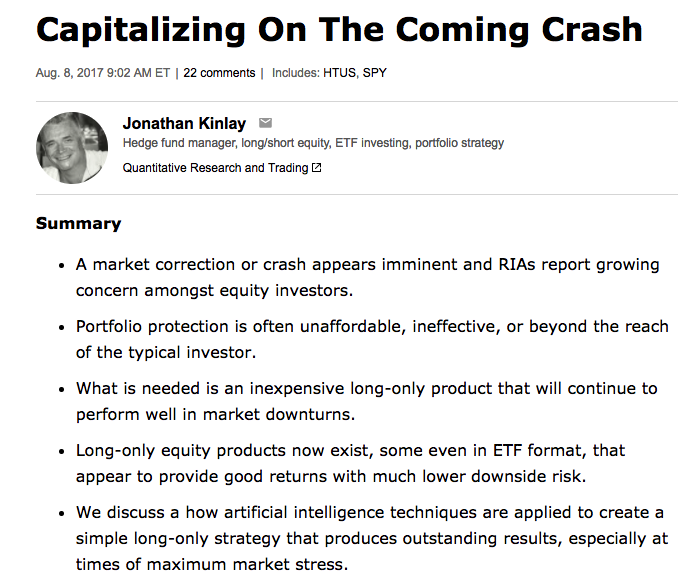

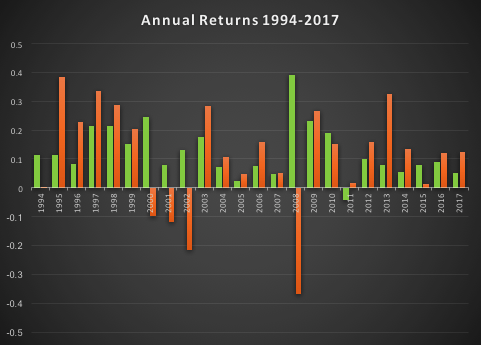

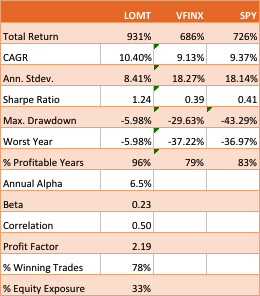
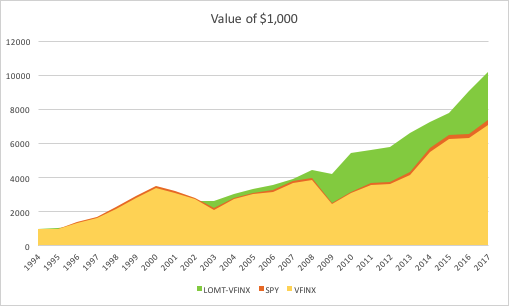
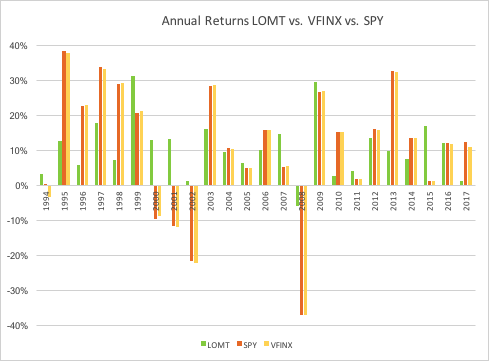


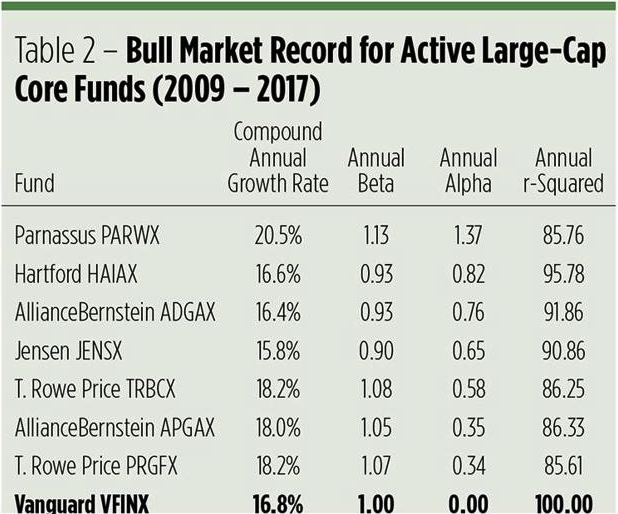


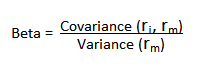
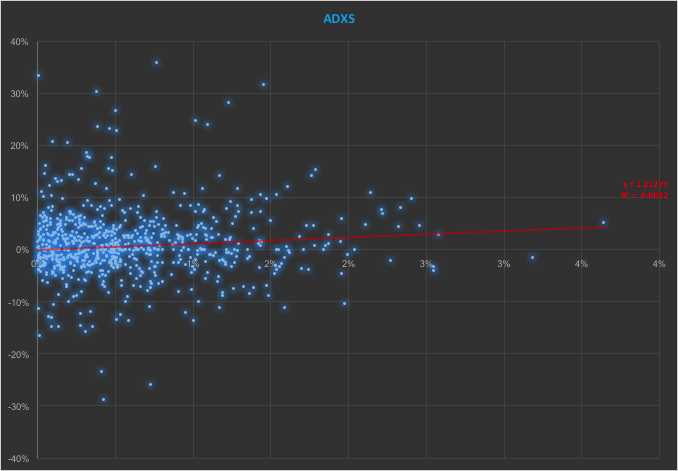
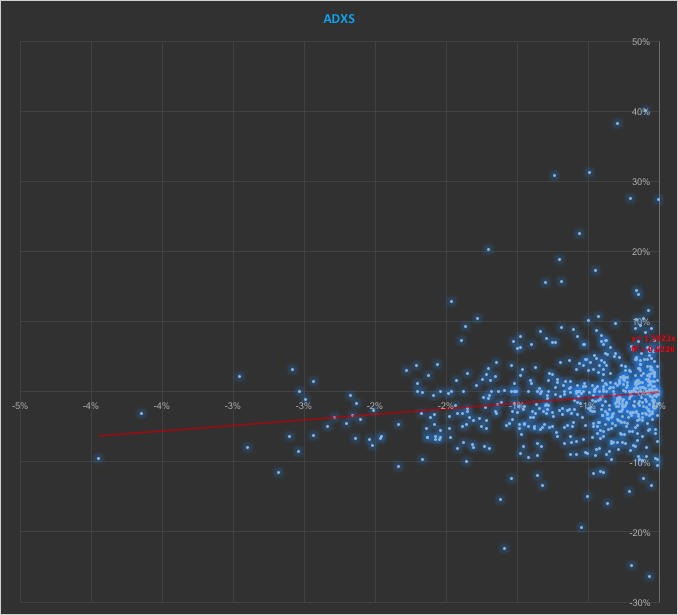

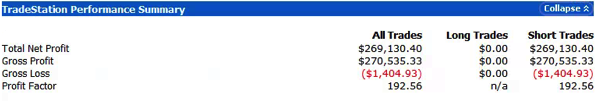


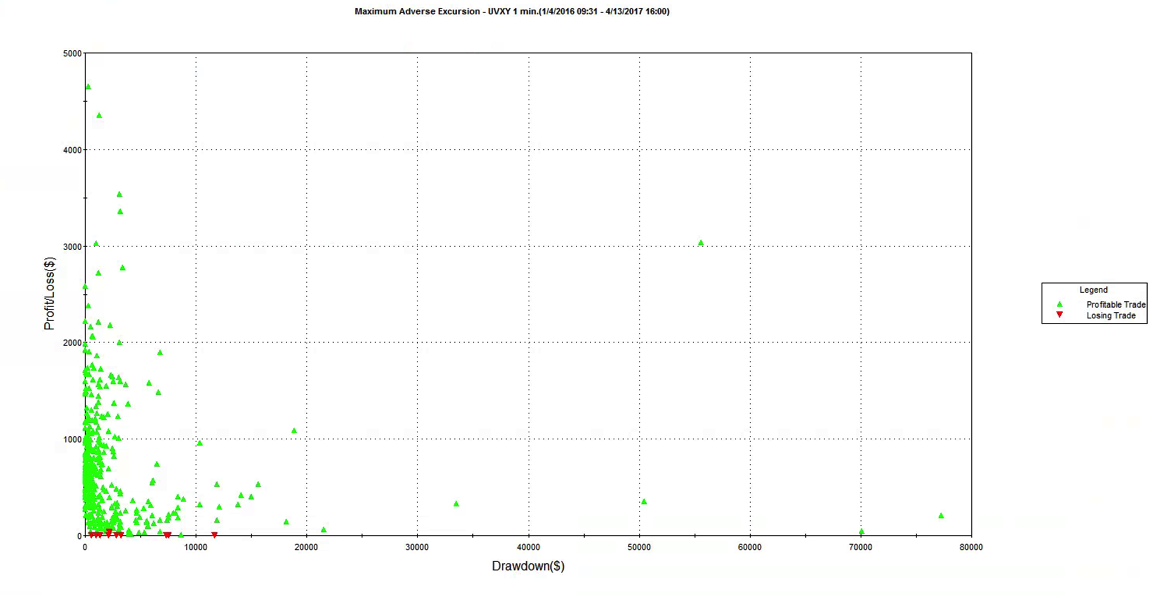
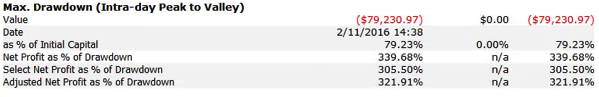
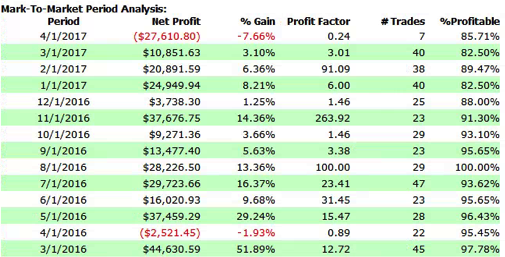
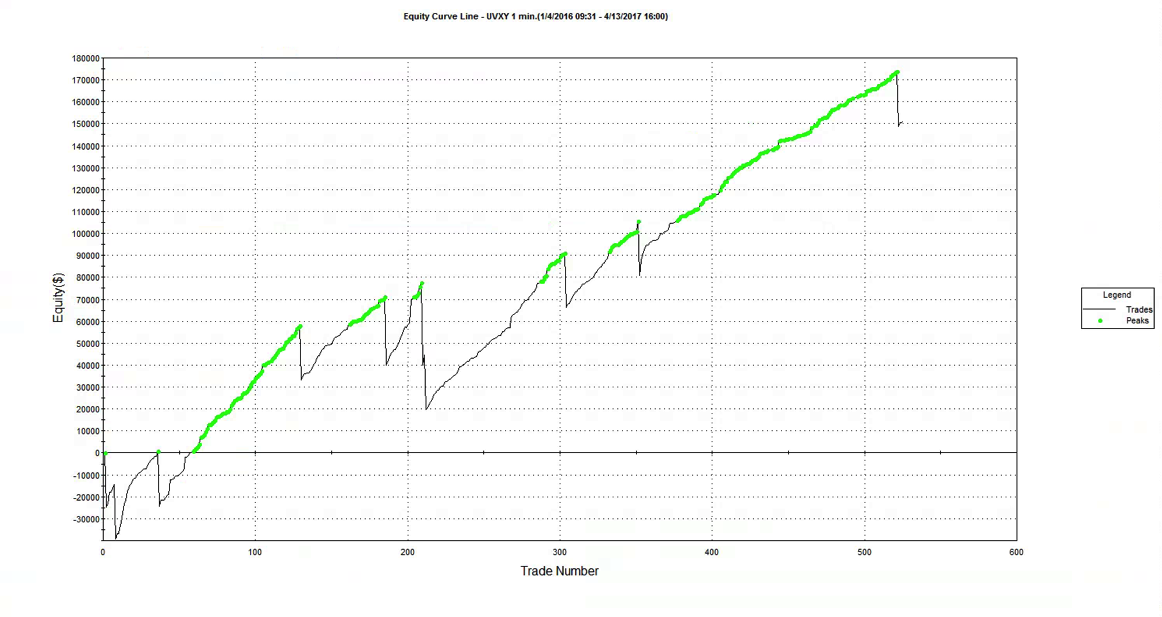


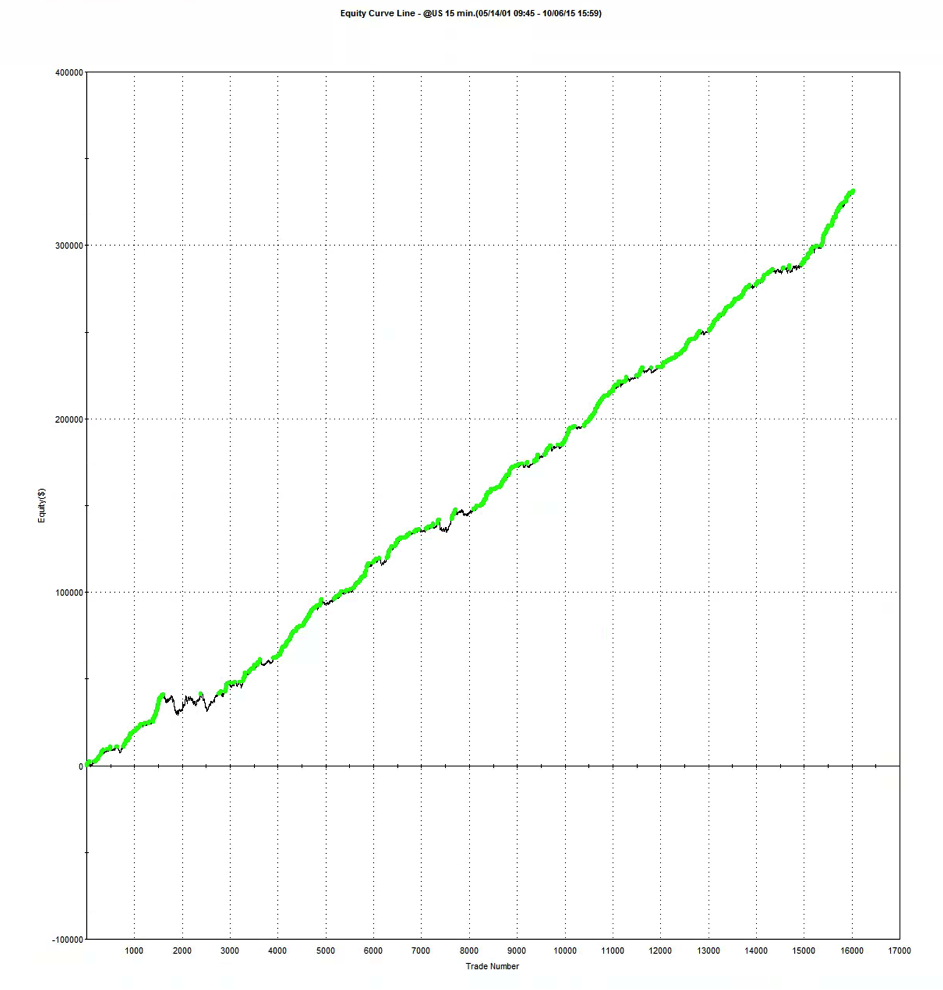
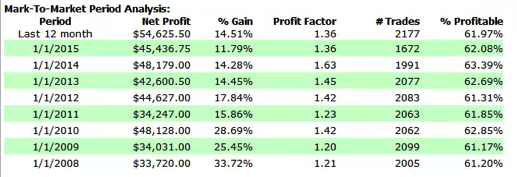
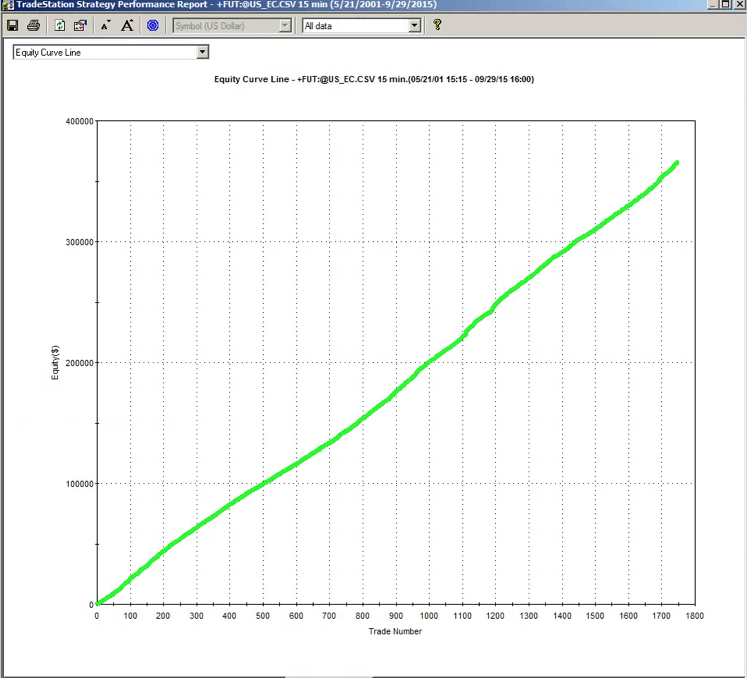
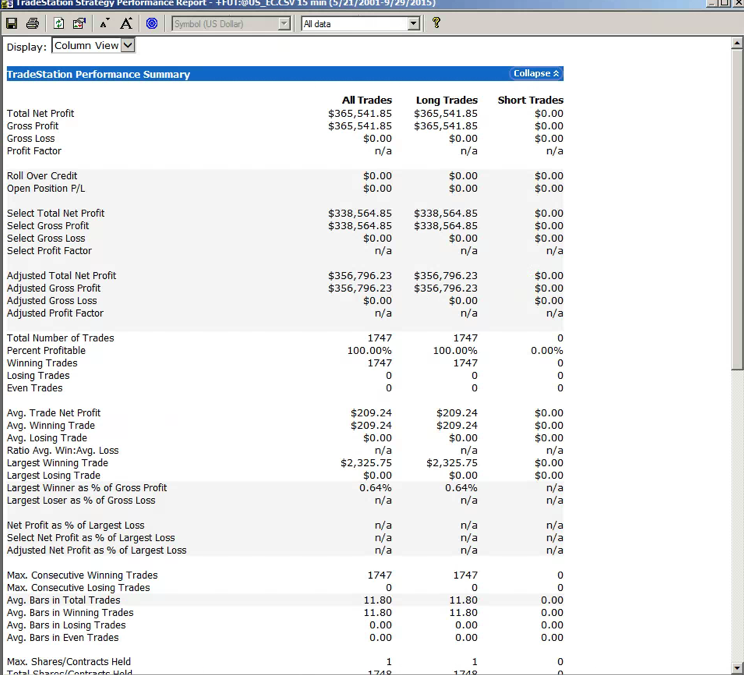


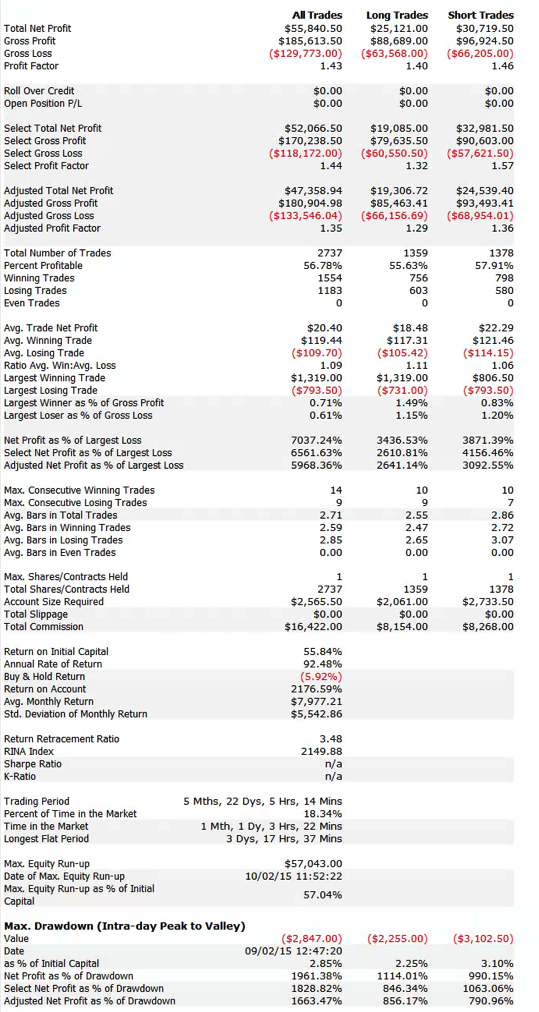
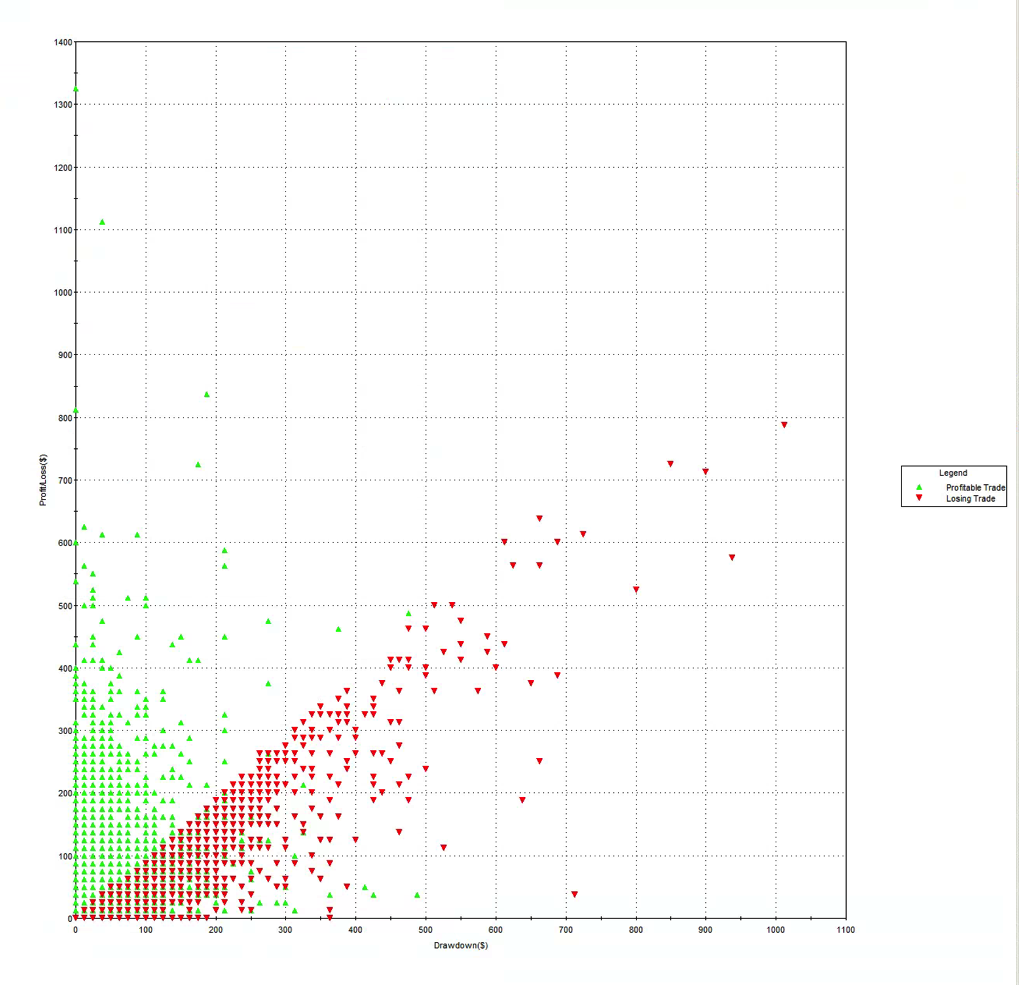
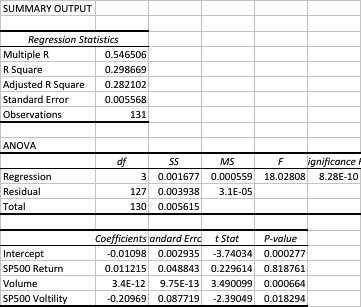
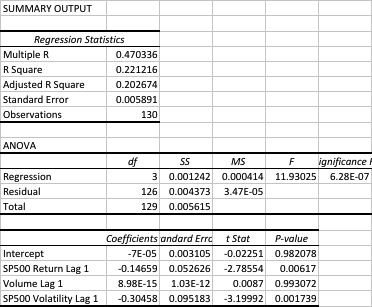
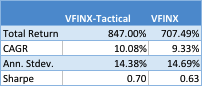
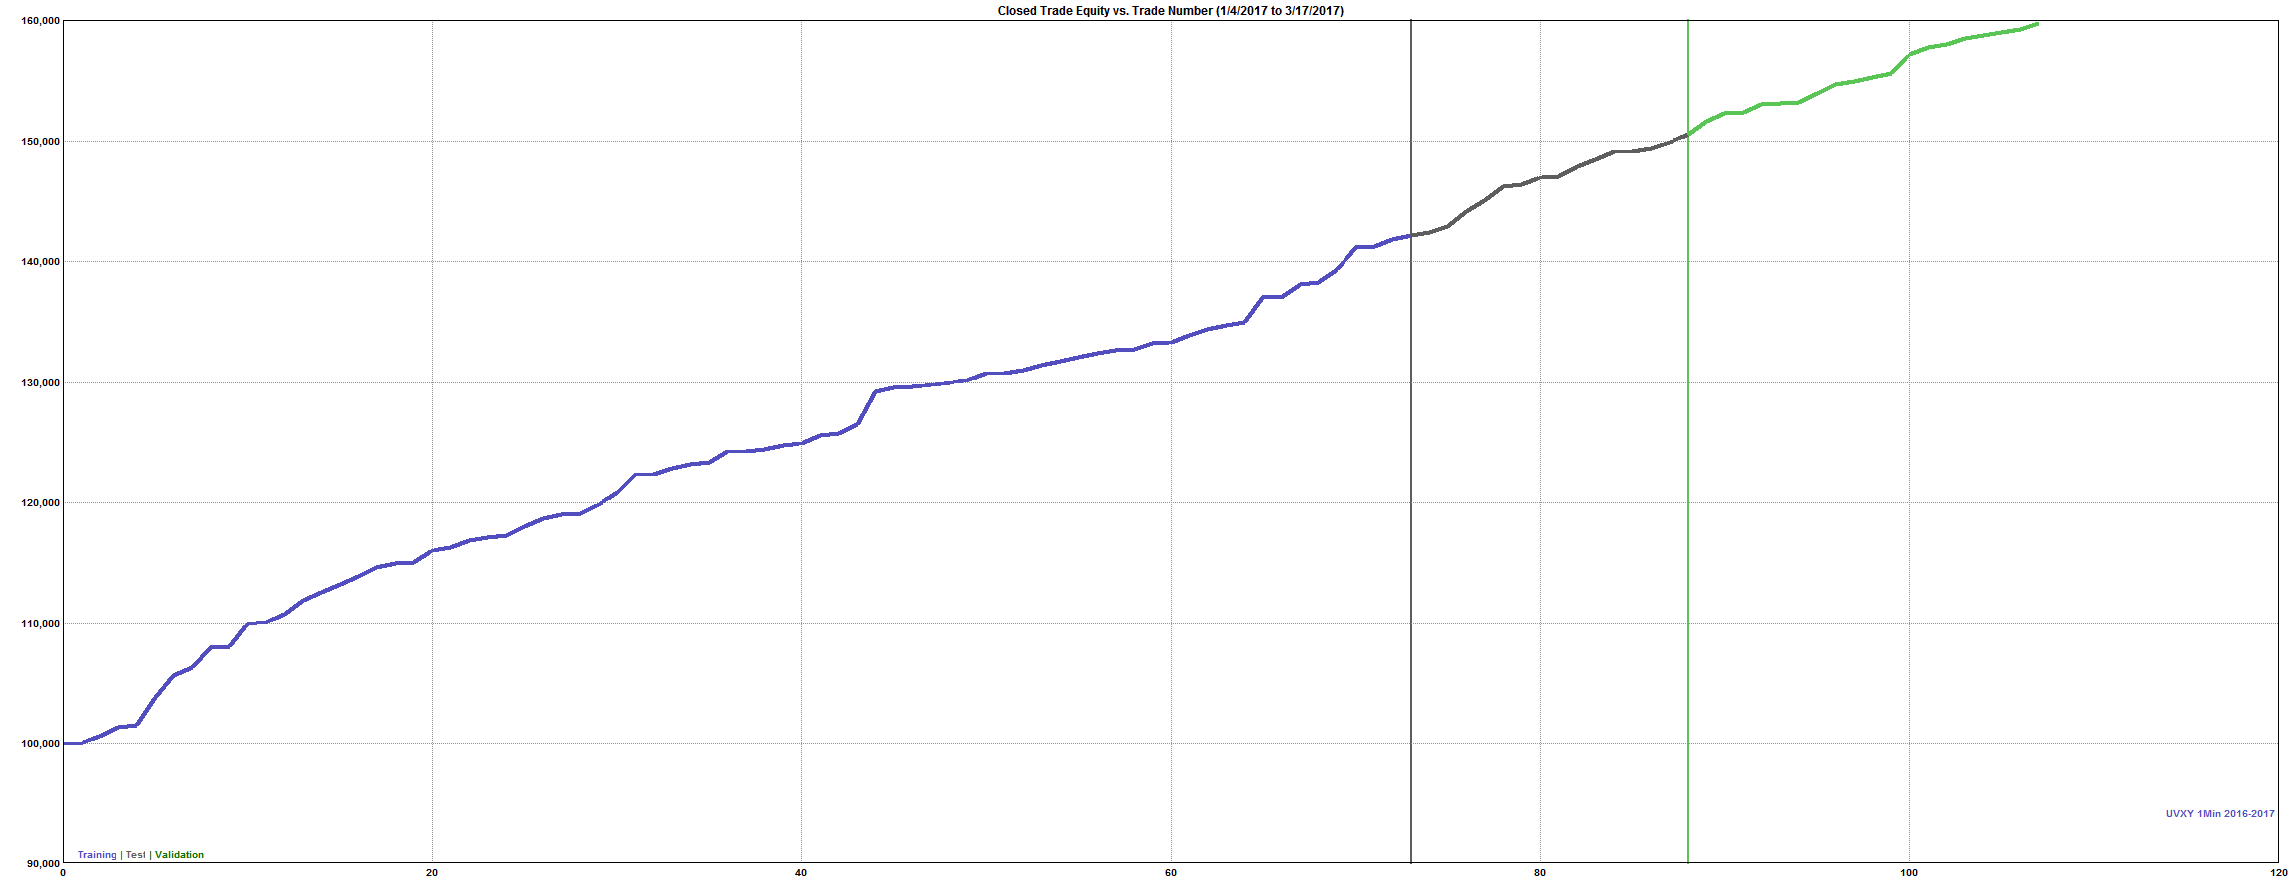