In this post I want to share some thoughts on how to design great automated trading strategies – what to look for, and what to avoid.
For illustrative purposes I am going to use a strategy I designed for the ever-popular S&P500 e-mini futures contract.
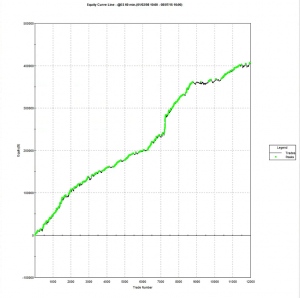
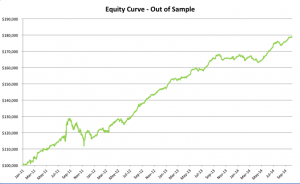
The overall equity curve for the strategy is show below.
This is often the best place to start. What you want to see, of course, is a smooth, upward-sloping curve, without too many sizable drawdowns, and one in which the strategy continues to make new highs. This is especially important in the out-of-sample test period (Jan 2014- Jul 2015 in this case). You will notice a flat period around 2013, which we will need to explore later. Overall, however, this equity curve appears to fit the stereotypical pattern we hope to see when developing a new strategy.
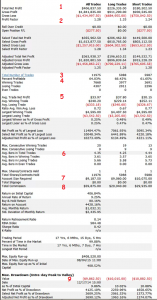
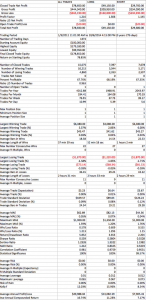
Let’s move on look at the overall strategy performance numbers.
STRATEGY PERFORMANCE CHARACTERISTICS
1. Net Profit
Clearly, the most important consideration. Over the 17 year test period the strategy has produced a net profit averaging around $23,000 per annum, per contract. As a rough guide, you would want to see a net profit per contract around 10x the maintenance margin, or higher.
2. Profit Factor
The gross profit divided by the gross loss. You want this to be as high as possible. Too low, as the strategy will be difficult to trade, because you will see sustained periods of substantial losses. I would suggest a minimum acceptable PF in the region of 1.25. Many strategy developers aim for a PF of 1.5, or higher.
3. Number of Trades
Generally, the more trades the better, at least from the point of view of building confidence in the robustness of strategy performance. A strategy may show a great P&L, but if it only trades once a month it is going to take many many years of performance data to ensure statistical significance. This strategy, on the other hand, is designed to trade 2-3 times a day. Given that, and the length of the test period, there is little doubt that the results are statistically significant.
Profit Factor and number of trades are opposing design criteria – increasing the # trades tends to reduce the PF. That consideration sets an upper bound on the # trades that can be accommodated, before the profit factor deteriorates to unacceptably low levels. Typically, 4-5 trades a day is about the maximum trading frequency one can expect to achieve.
4. Win Rate
Novice system designers tend to assume that you want this to be as high as possible, but that isn’t typically the case. It is perfectly feasible to design systems that have a 90% win rate, or higher, but which produce highly undesirable performance characteristics, such as frequent, large drawdowns. For a typical trading system the optimal range for the win rate is in the region of 40% to 66%. Below this range, it becomes difficult to tolerate the long sequences of losses that will result, without losing faith in the system.
5. Average Trade
This is the average net profit per trade. A typical range would be $10 to $100. Many designers will only consider strategies that have a higher average trade than this one, perhaps $50-$75, or more. The issue with systems that have a very small average trade is that the profits can quickly be eaten up by commissions. Even though, in this case, the results are net of commissions, one can see a significant deterioration in profits if the average trade is low and trade frequency is high, because of the risk of low fill rates (i.e. the % of limit orders that get filled). To assess this risk one looks at the number of fills assumed to take place at the high or low of the bar. If this exceeds 10% of the total # trades, one can expect to see some slippage in the P&L when the strategy is put into production.
6. Average Bars
The number of bars required to complete a trade, on average. There is no hard limit one can suggest here – it depends entirely on the size of the bars. Here we are working in 60 minute bars, so a typical trade is held for around 4.5 hours, on average. That’s a time-frame that I am comfortable with. Others may be prepared to hold positions for much longer – days, or even weeks.
Perhaps more important is the average length of losing trades. What you don’t want to see is the strategy taking far longer to exit losing trades than winning trades. Again, this is a matter of trader psychology – it is hard to sit there hour after hour, or day after day, in a losing position – the temptation to cut the position becomes hard to ignore. But, in doing that you are changing the strategy characteristics in a fundamental way, one that rarely produces a performance improvement.
What the strategy designer needs to do is to figure out in advance what the limits are of the investor’s tolerance for pain, in terms of maximum drawdown, average losing trade, etc, and design the strategy to meet those specifications, rather than trying to fix the strategy afterwards.
7. Required Account Size
It’s good to know exactly how large an account you need per contract, so you can figure out how to scale the strategy. In this case one could hope to scale the strategy up to a 10-lot in a $100,000 account. That may or may not fit the trader’s requirements and again, this needs to be considered at the outset. For example, for a trader looking to utilize, say, $1,000,000 of capital, it is doubtful whether this strategy would fit his requirements without considerable work on the implementations issues that arise when trying to trade in anything approaching a 100 contract clip rate.
8. Commission
Always check to ensure that the strategy designer has made reasonable assumptions about slippage and commission. Here we are assuming $5 per round turn. There is no slippage, because the strategy executes using limit orders.
9. Drawdown
Drawdowns are, of course, every investor’s bugbear. No-one likes drawdowns that are either large, or lengthy in relation to the annual profitability of the strategy, or the average trade duration. A $10,000 max drawdown on a strategy producing over $23,000 a year is actually quite decent – I have seen many e-mini strategies with drawdowns at 2x – 3x that level, or larger. Again, this is one of the key criteria that needs to be baked into the strategy design at the outset, rather than trying to fix later.
ANNUAL PROFITABILITY
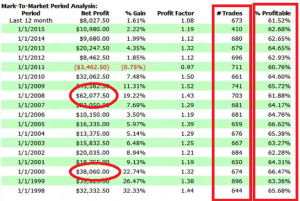
Let’s now take a look at how the strategy performs year-by-year, and some of the considerations and concerns that often arise.
 1. Performance During Downturns
One aspect I always pay attention to is how well the strategy performs during periods of high market stress, because I expect similar conditions to arise in the fairly near future, e.g. as the Fed begins to raise rates.
Here, as you can see, the strategy performed admirably during both the dot com bust of 1999/2000 and the financial crisis of 2008/09.
2. Consistency in the # Trades and % Win Rate
It is not uncommon with low frequency strategies to see periods of substantial variation in the # trades or win rate. Regardless how good the overall performance statistics are, this makes me uncomfortable. It could be, for instance, that the overall results are influenced by one or two exceptional years that are unlikely to be repeated. Significant variation in the trading or win rate raise questions about the robustness of the strategy, going forward. On the other hand, as here, it is a comfort to see the strategy maintaining a very steady trading rate and % win rate, year after year.
3. Down Years
Every strategy shows variation in year to year performance and one expects to see years in which the strategy performs less well, or even loses money. For me, it rather depends on when such losses arise, as much as the size of the loss. If a loss occurs in the out-of-sample period it raises serious questions about strategy robustness and, as a result, I am very unlikely to want to put such a strategy into production. If, as here, the period of poor performance occurs during the in-sample period I am less concerned – the strategy has other, favorable characteristics that make it attractive and I am willing to tolerate the risk of one modestly down-year in over 17 years of testing.
INTRA-TRADE DRAWDOWNS
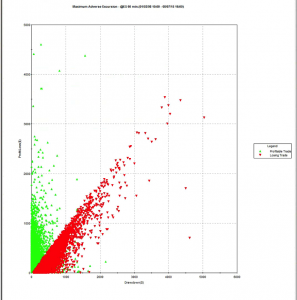
Many trades that end up being profitable go through a period of being under-water. What matters here is how high those intra-trade losses may climb, before the trade is closed. To take an extreme example, would you be willing to risk $10,000 to make an average profit of only $10 per trade? How about $20,000? $50,000? Your entire equity?
The Maximum Average Excursion chart below shows the drawdowns on a trade by trade basis. Here we can see that, over the 17 year test period, no trade has suffered a drawdown of much more than $5,000. I am comfortable with that level. Others may prefer a lower limit, or be tolerant of a higher MAE.
Again, the point is that the problem of a too-high MAE is not something one can fix after the event. Sure, a stop loss will prevent any losses above a specified size. But a stop loss also has the unwanted effect of terminating trades that would have turned into money-makers. While psychologically comfortable, the effect of a stop loss is almost always negative in terms of strategy profitability and other performance characteristics, including drawdown, the very thing that investors are looking to control.
CONCLUSION
I have tried to give some general guidelines for factors that are of critical importance in strategy design. There are, of course, no absolutes: the “right” characteristics depend entirely on the risk preferences of the investor.
One point that strategy designers do need to take on board is the need to factor in all of the important design criteria at the outset, rather than trying (and usually failing) to repair the strategy shortcomings after the event.
