Long/Short Stock Trading Strategy

The Long-Short Stock Trader strategy uses a quantitative model to introduce market orders, both entry and exits. The model looks for divergencies between stock price and its current volatility, closing the position when the Price-volatility gap is closed.  The strategy is designed to obtain a better return on risk than S&P500 index and the risk management is focused on obtaining a lower drawdown and volatility than index.
The model trades only Large Cap stocks, with high liquidity and without scalability problems. Thanks to the high liquidity, market orders are filled without market impact and at the best market prices.

For more information and back-test results go here.

The Long-Short Trader is the first strategy launched on the Systematic Algotrading Platform under our new Strategy Manager Program.

Performance Summary


Monthly Returns


Value of $100,000 Portfolio


Understanding Stock Price Range Forecasts

Stock Price Range Forecasts

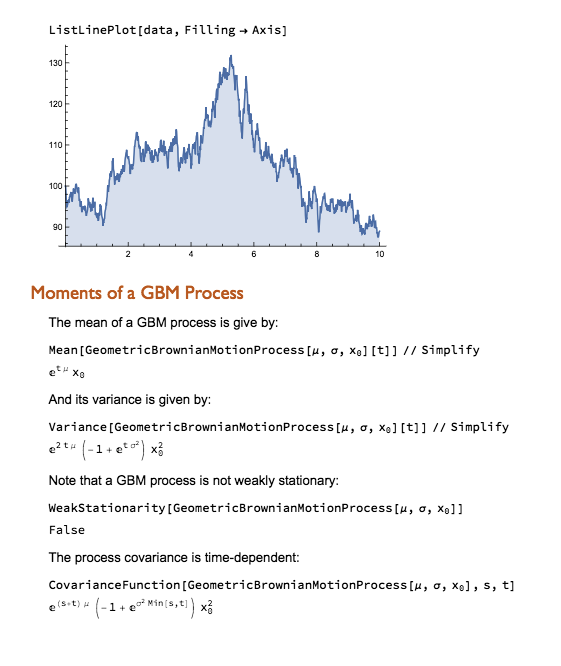
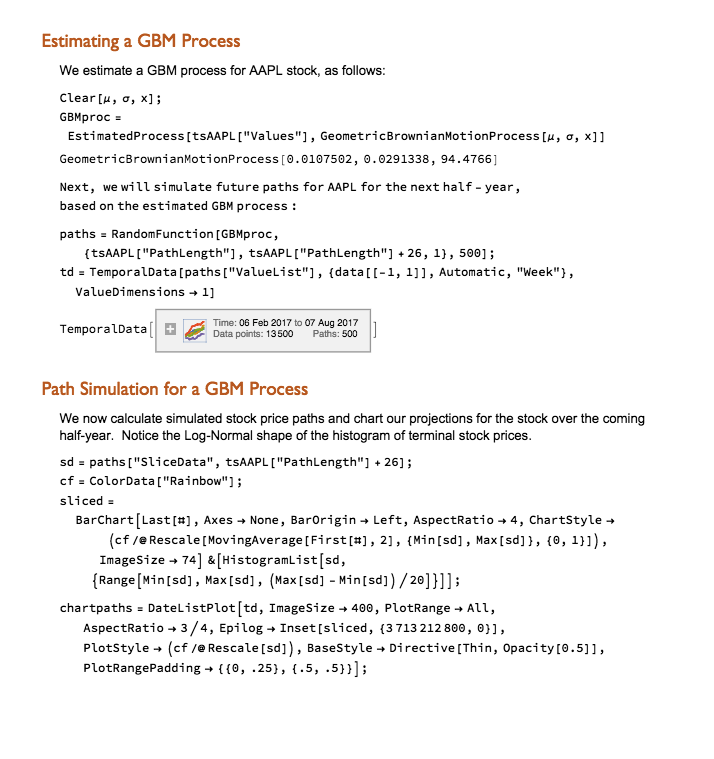
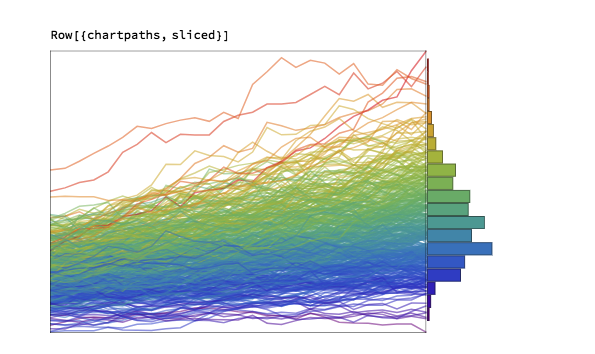
Range forecasts are produced by estimating the parameters of a Geometric Brownian Motion process from historical data and using the model to project a large number of sample paths for the stock price over the coming month and year.

For example, this is a range forecast for Netflix, Inc. (NFLX) as at 7/27/2018 when the price of the stock stood at $355.21:

$NFLX

As you can see, the great majority of the simulated price paths trend upwards.  This is typical for most stocks on account of their upward drift, a tendency to move higher over time.  The statistical table below the chart tells you that in 50% of cases the ending stock price 1 month from the date of forecast was in the range $352.15 to $402.49. Similarly, around 50% of the time the price of the stock in one year’s time were found to be in the range $565.01 to $896.69.  Notice that the end points of the one-year range far exceed the end points of the one-month range forecast – again this is a feature of the upward drift in stocks.

If you want much greater certainty about the outcome, you should look at the 95% ranges.  So, for NFLX, the one month 95% range was projected to be $310.06 to $457.13.  Here, only 1 in 20 of the simulated price paths produced one month forecasts that were higher than $457.13, or lower than $310.06.

Notice that the spread of the one month and one year 95% ranges is much larger than of the corresponding 50% ranges.  This demonstrates the fundamental tradeoff between “accuracy” (the spread of the range) and “certainty”, (the probability of the outcome being with the projected range).  If you want greater certainty of the outcome, you have to allow for a broader span of possibilities, i.e. a wider range.

SSALGOTRADING AD

Uses of Range Forecasts

Most stock analysts tend to produce single price “targets”, rather than a range – these are known as “point forecasts” by econometricians.  So what’s the thinking behind range forecasts?

Range forecasts are arguably more useful than simple point forecasts.  Point forecasts make no guarantee as to the likelihood of the projected price – the only thing we know for sure about such forecasts is that they will be wrong!  Is the forecast target price optimistic or pessimistic?  We have no way to tell.

With range forecasts the situation is very different.  We can talk about the likelihood of a stock being within a specified range at a certain point in time.  If we want to provide a pessimistic forecast for the price in NFLX in one month’s time, for example, we could quote the value $352.15, the lower end of the 50% range forecast.  If we wanted to provide a very pessimistic forecast, one that is very likely to be exceeded, we could quote the bottom of the 95% range: $310.06.

The range also tells us about the future growth prospects for the firm.  So, for example, with NFLX, based on past performance, it is highly likely that the stock price will grow at a rate of more than 2.4% and, optimistically, might increase by almost 3x in the coming year (see the growth rates calculated for the 95% range values).

One specific use of range forecasts is in options trading.  If a trader is bullish on NFLX, instead of buying the stock, he might instead choose to sell one-month put options with a strike price below $352 (the lower end of the 50% one-month range).  If the trader wanted to be more conservative, he might look for put options struck at around $310, the bottom of the 95% range.  A more complex strategy might be to buy calls struck near the top of the 50% range, and sell more calls struck near the top of the 95% range (the theory being that the stock is quite likely to exceed the top of the 50% one-month range, but much less likely to reach the high end of the 95% range).

Limitations of Range Forecasts

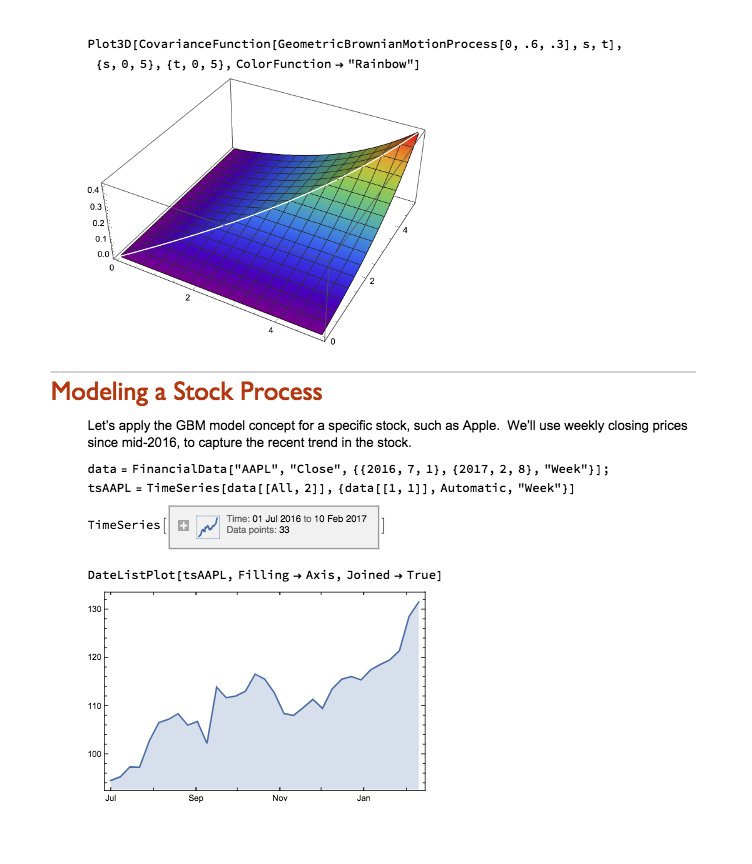
Range forecasts are produced by using historical data to estimate the parameters of a particular type of mathematical model, known as a Geometric Brownian Motion process.  For those who are interested in the mechanics of how the forecasts are produced, I have summarized the relevant background theory below.

While there are grounds for challenging the use of such models in this context, it has to be acknowledged that the GBM process is one of the most successful mathematical models in finance today.  The problem lies not so much in the model, as in one of the key assumptions underpinning the approach:  specifically, that the characteristics of the stock process will remain as they are today (and as they have been in the historical past).  This assumption is manifestly untenable when applied to many stocks:  a company that was a high-growth $100M start-up is unlikely to demonstrate the same  rate of growth ten years later, as a $10Bn enterprise.  A company like Amazon that started out as an online book seller has fundamentally different characteristics today, as an online retail empire.  In such cases, forecasts about the future stock price – whether point or range forecasts – based on outdated historical informations are likely to be wrong, sometimes wildly so.

Having said that, there are a great many companies that have evolved to a point of relative stability over a period of perhaps several decades: for example, a company like Caterpillar Inc. (CAT).  In such cases the parameters of the GBM process underpinning the stock price are unlikely to fluctuate widely in the short term, so range forecasts are consequently more likely to be useful.

Another factor to consider are quarterly earnings reports, which can influence stock prices considerably in the short term, and corporate actions (mergers, takeovers, etc) that can change the long term characteristics of a firm and its stock price process in a fundamental way.  In these situations any forecast methodology is likely to unreliable, at least for a while, until the event has passed.  It’s best to avoid taking positions based on projections from historical data at times like this.

Review of Background Theory


GBM1

GBM2 GBM3 GBM4 GBM5

Developing Statistical Arbitrage Strategies Using Cointegration

In his latest book (Algorithmic Trading: Winning Strategies and their Rationale, Wiley, 2013) Ernie Chan does an excellent job of setting out the procedures for developing statistical arbitrage strategies using cointegration.  In such mean-reverting strategies, long positions are taken in under-performing stocks and short positions in stocks that have recently outperformed.

I will leave a detailed description of the procedure to Ernie (see pp 47 – 60), which in essence involves:

(i) estimating a cointegrating relationship between two or more stocks, using the Johansen procedure

(ii) computing the half-life of mean reversion of the cointegrated process, based on an Ornstein-Uhlenbeck  representation, using this as a basis for deciding the amount of recent historical data to be used for estimation in (iii)

(iii) Taking a position proportionate to the Z-score of the market value of the cointegrated portfolio (subtracting the recent mean and dividing by the recent standard deviation, where “recent” is defined with reference to the half-life of mean reversion)

Countless researchers have followed this well worn track, many of them reporting excellent results.  In this post I would like to discuss a few of many considerations  in the procedure and variations in its implementation.  We will follow Ernie’s example, using daily data for the EWF-EWG-ITG triplet of ETFs from April 2006 – April 2012. The analysis runs as follows (I am using an adapted version of the Matlab code provided with Ernie’s book):

Johansen test We reject the null hypothesis of fewer then three cointegrating relationships at the 95% level. The eigenvalues and eigenvectors are as follows:

Eigenvalues The eignevectors are sorted by the size of their eigenvalues, so we pick the first of them, which is expected to have the shortest half-life of mean reversion, and create a portfolio based on the eigenvector weights (-1.046, 0.76, 0.2233).  From there, it requires a simple linear regression to estimate the half-life of mean reversion:

Halflife From which we estimate the half-life of mean reversion to be 23 days.  This estimate gets used during the final, stage 3, of the process, when we choose a look-back period for estimating the running mean and standard deviation of the cointegrated portfolio.  The position in each stock (numUnits) is sized according to the standardized deviation from the mean (i.e. the greater the deviation the larger the allocation). Apply Ci The results appear very promising, with an annual APR of 12.6% and Sharpe ratio of 1.4:   Returns EWA-EWC-IGE

Ernie is at pains to point out that, in this and other examples in the book, he pays no attention to transaction costs, nor to the out-of-sample performance of the strategies he evaluates, which is fair enough.

The great majority of the academic studies that examine the cointegration approach to statistical arbitrage for a variety of investment universes do take account of transaction costs.  For the most part such studies report very impressive returns and Sharpe ratios that frequently exceed 3.  Furthermore, unlike Ernie’s example which is entirely in-sample, these studies typically report consistent out-of-sample performance results also.

But the single, most common failing of such studies is that they fail to consider the per share performance of the strategy.  If the net P&L per share is less than the average bid-offer spread of the securities in the investment portfolio, the theoretical performance of the strategy is unlikely to survive the transition to implementation.  It is not at all hard to achieve a theoretical Sharpe ratio of 3 or higher, if you are prepared to ignore the fact that the net P&L per share is lower than the average bid-offer spread.  In practice, however, any such profits are likely to be whittled away to zero in trading frictions – the costs incurred in entering, adjusting and exiting positions across multiple symbols in the portfolio.

Put another way, you would want to see a P&L per share of at least 1c, after transaction costs, before contemplating implementation of the strategy.  In the case of the EWA-EWC-IGC portfolio the P&L per share is around 3.5 cents.  Even after allowing, say, commissions of 0.5 cents per share and a bid-offer spread of 1c per share on both entry and exit, there remains a profit of around 2 cents per share – more than enough to meet this threshold test.

Let’s address the second concern regarding out-of-sample testing.   We’ll introduce a parameter to allow us to select the number of in-sample days, re-estimate the model parameters using only the in-sample data, and test the performance out of sample.  With a in-sample size of 1,000 days, for instance, we find that we can no longer reject the null hypothesis of fewer than 3 cointegrating relationships and the weights for the best linear portfolio differ significantly from those estimated using the entire data set.

Johansen 2

Repeating the regression analysis using the eigenvector weights of the maximum eigenvalue vector (-1.4308, 0.6558, 0.5806), we now estimate the half-life to be only 14 days.  The out-of-sample APR of the strategy over the remaining 500 days drops to around 5.15%, with a considerably less impressive Sharpe ratio of only 1.09.

osPerfOut-of-sample cumulative returns

One way to improve the strategy performance is to relax the assumption of strict proportionality between the portfolio holdings and the standardized deviation in the market value of the cointegrated portfolio.  Instead, we now require  the standardized deviation of the portfolio market value to exceed some chosen threshold level before we open a position (and we close any open positions when the deviation falls below the threshold).  If we choose a threshold level of 1, (i.e. we require the market value of the portfolio to deviate 1 standard deviation from its mean before opening a position), the out-of-sample performance improves considerably:

osPerf 2

The out-of-sample APR is now over 7%, with a Sharpe ratio of 1.45.

The strict proportionality requirement, while logical,  is rather unusual:  in practice, it is much more common to apply a threshold, as I have done here.  This addresses the need to ensure an adequate P&L per share, which will typically increase with higher thresholds.  A countervailing concern, however, is that as the threshold is increased the number of trades will decline, making the results less reliable statistically.  Balancing the two considerations, a threshold of around 1-2 standard deviations is a popular and sensible choice.

Of course, introducing thresholds opens up a new set of possibilities:  just because you decide to enter based on a 2x SD trigger level doesn’t mean that you have to exit a position at the same level.  You might consider the outcome of entering at 2x SD, while exiting at 1x SD, 0x SD, or even -2x SD.  The possible nuances are endless.

Unfortunately, the inconsistency in the estimates of the cointegrating relationships over different data samples is very common.  In fact, from my own research, it is often the case that cointegrating relationships break down entirely out-of-sample, just as do correlations.  A recent study by Matthew Clegg of over 860,000 pairs confirms this finding (On the Persistence of Cointegration in Pais Trading, 2014) that cointegration is not a persistent property.

I shall examine one approach to  addressing the shortcomings  of the cointegration methodology  in a future post.


Matlab code (adapted from Ernie Chan’s book):

Continue reading “Developing Statistical Arbitrage Strategies Using Cointegration”

Beating the S&P500 Index with a Low Convexity Portfolio

What is Beta Convexity?

Beta convexity is a measure of how stable a stock beta is across market regimes.  The essential idea is to evaluate the beta of a stock during down-markets, separately from periods when the market is performing well.  By choosing a portfolio of stocks with low beta-convexity we seek to stabilize the overall risk characteristics of our investment portfolio.

A primer on beta convexity and its applications is given in the following post:


In this post I am going to use the beta-convexity concept to construct a long-only equity portfolio capable of out-performing the benchmark S&P 500 index.

The post is in two parts.  In the first section I outline the procedure in Mathematica for downloading data and creating a matrix of stock returns for the S&P 500 membership.  This is purely about the mechanics, likely to be of interest chiefly to Mathematica users. The code deals with the issues of how to handle stocks with multiple different start dates and missing data, a problem that the analyst is faced with on a regular basis.  Details are given in the pdf below. Let’s skip forward to the analysis.

Portfolio Formation & Rebalancing

We begin by importing the data saved using the data retrieval program, which comprises a matrix of (continuously compounded) monthly returns for the S&P500 Index and its constituent stocks.  We select a portfolio size of 50 stocks, a test period of 20 years, with a formation period of 60 months and monthly rebalancing.

In the processing stage, for each month in our 20-year test period we  calculate the beta convexity for each index constituent stock and select the 50 stocks that have the lowest beta-convexity during the prior 5-year formation period.  We then compute the returns for an equally weighted basket of the chosen stocks over the following month.  After that, we roll forward one month and repeat the exercise.

It turns out that beta-convexity tends to be quite unstable, as illustrated for a small sample of component stocks in the chart below:

A snapshot of estimated convexity factors is shown in the following table.  As you can see, there is considerable cross-sectional dispersion in convexity, in addition to time-series dependency.

At any point in time the cross-sectional dispersion is well described by a Weibull distribution, which passes all of the usual goodness-of-fit tests.

Performance Results

We compare the annual returns and standard deviation of the low convexity portfolio with the S&P500 benchmark in the table below. The results indicate that the average gross annual return of a low-convexity portfolio of 50 stocks is more than double that of the benchmark, with a comparable level of volatility. The portfolio also has slightly higher skewness and kurtosis than the benchmark, both desirable characteristics.


Portfolio Alpha & Beta Estimation

Using the standard linear CAPM model we estimate the annual alpha of the low-convexity portfolio to be around 7.39%, with a beta of 0.89.

Beta Convexity of the Low Convexity Portfolio

As we might anticipate, the beta convexity of the portfolio is very low since it comprises stocks with the lowest beta-convexity:

Conclusion: Beating the Benchmark S&P500 Index

Using a beta-convexity factor model, we are able to construct a small portfolio that matches the benchmark index in terms of volatility, but with markedly superior annual returns.  Larger portfolios offering greater liquidity produce slightly lower alpha, but a 100-200 stock portfolio typically produce at least double the annual rate of return of the benchmark over the 20-year test period.

For those interested, we shall shortly be offering a low-convexity strategy on our Systematic Algotrading platform – see details below:

Section on Data Retrieval and Processing

Data Retrieval


Pattern Trading

Summary

  • Pattern trading rules try to identify profit opportunities, based on short term price patterns.
  • An exhaustive test of simple pattern trading rules was conducted for several stocks, incorporating forecasts of the Open, High, Low and Close prices.
  • There is clear evidence that pattern trading rules continue to work consistently for many stocks.
  • Almost all of the optimal pattern trading rules suggest buying the stock if the close is below the mid-range of the day.
  • This “buy the dips” approach can sometimes be improved by overlaying additional conditions, or signals from forecasting models.

MMM

Trading Pattern Rules

From time to time one comes across examples of trading pattern rules that appear to work. By “pattern rule”, I mean something along the lines of: “if the stock closes below the open and today’s high is greater than yesterday’s high, then buy tomorrow’s open”.

Trading rules of this kind are typically one-of-a-kind oddities that only work for limited periods, or specific securities. But I was curious enough to want to investigate the concept of pattern trading, to see if there might be some patterns that are generally applicable and potentially worth trading.

To my surprise, I was able to find such a rule, which I will elaborate on in this article. The rule appears to work consistently for a wide range of stocks, across long time frames. While perhaps not interesting enough to trade by itself, the rule might provide some useful insight and, possibly, be combined with other indicators in a more elaborate trading strategy.

The original basis for this piece of research was the idea of using vector autoregression models to forecast the daily O/H/L/C prices of a stock. The underlying thesis is that there might be information in the historical values of these variables that, combined together, could produce more useful forecasts than, say, using close prices alone. In technical terms, we say that the O/H/L/C price series are cointegrated, which one might think of as a more robust kind of correlation: cointegrated series tend to continue to move together for some underlying economic reason, whereas series that are merely correlated will often see that purely statistical relationship break down. In this case the economic relationship between the O/H/L/C series is clear: the high price will always be greater than the low price, and the open and close prices will always lie between the two. Furthermore, the prices cannot drift arbitrarily far apart indefinitely, since volatility is finite and mean-reverting. So there is some kind of rationale for using a vector autoregression model in this context. But I don’t want to dwell on this idea too much, as it turns out to be useful only at the margin.

SSALGOTRADING AD

To keep it simple I decided to focus attention on simple pattern trades of the following kind:

If Rule1 and/or Rule2 then Trade

Rule1 and Rule2 are simple logical statements of the kind: “Today’s Open greater than yesterday’s Close”, or “today’s High below yesterday’s Low”. The trade can be expressed in combinations of the form “Buy today’s Open, Sell today’s Close”, or “Buy today’s Close, Sell tomorrow’s Close”.

In my model I had to consider rules combining not only the O/H/L/C prices from yesterday, today and tomorrow, but also forecast O/H/L/C prices from the vector autoregression model. This gave rise to hundreds of thousands of possibilities. A brute-force test of every one of them would certainly be feasible, but rather tedious to execute. And many of the possible rules would be redundant – for example a rule such as : “if today’s open is lower than today’s close, buy today’s open”. Rules of that kind will certainly make a great deal of money, but they aren’t practical, unfortunately!

To keep the number of possibilities to a workable number, I restricted the trading rule to the following: “Buy today’s close, sell tomorrow’s close”. Consequently, we are considering long-only trading strategies and we ignore any rules that might require us to short a stock.

I chose stocks with long histories, dating back to at least the beginning of the 1970’s, in order to provide sufficient data to construct the VAR model. Data from the period from Jan 1970 to Dec 2012 were used to estimate the model, and the performance of the various possible trading rules was evaluated using out-of-sample data from Jan 2013 to Jun 2014.

For ease of illustration the algorithms were coded up in MS-Excel (a copy of the Excel workbook is available on request). In evaluating trading rule performance an allowance was made of $1c per share in commission and $2c per share in slippage. Position size was fixed at 1,000 shares. Considering that the trading rules requires entry and exit at market close, a greater allowance for slippage may be required for some stocks. In addition, we should note the practical difficulties of trading a sizeable position at the close, especially in situations where the stock price may be very near to key levels such as the intra-day high or low that our trading rule might want to take account of.

As a further caveat, we should note that there is an element of survivor bias here: in order to fit this test protocol, stocks would have had to survive from the 1970’s to the present day. Many stocks that were current at the start of that period are no longer in existence, due to mergers, bankruptcies, etc. Excluding such stocks from the evaluation will tend to inflate the test results. It should be said that I did conduct similar tests on several now-defunct stocks, for which the outcomes were similar to those presented here, but a fully survivor-bias corrected study is beyond the scope of this article. With that caveat behind us, let’s take a look at some of the results.

Trading Pattern Analysis

Fig. 1 below shows the summary output from the test for the 3M Company (NYSE:MMM). At the top you can see the best trading rule that the system was able to find for this particular stock. In simple English, the rule tells you to buy today’s close in MMM and sell tomorrow’s close, if the stock opened below the forecast of yesterday’s high price and, in addition, the stock closed below the midrange of the day (the average of today’s high and low prices).

Fig. 1 Summary Analysis for MMM 

Fig 1

Source: Yahoo Finance.

The in-sample results from Jan 2000, summarized in left-hand table in Fig. 2 below, are hardly stellar, but do show evidence of a small, but significant edge, with total net returns of 165%, profit factor of 1.38 and % win rate of 54%. And while the trading rule is, ultimately, outperformed by a simple buy-and-hold strategy, after taking into account transaction costs, for extended periods (e.g. 2009-2012), investors would have been better off had they used the trading rule, because it successfully avoided the worst of the effects of the 2008/09 market crash.

Out-of-sample results, shown in the right-hand table, are less encouraging, but net returns are nonetheless positive and the % win rate actually increases to 55%.

Fig 2. Trade Rule Performance

Results1

Source: Yahoo Finance.

I noted earlier that the first part of our trading rule for MMM involved comparing the opening price to the forecast of yesterday’s high, produced by the vector autoregression model, while the second part of the trading rule references only the midrange and closing prices. How much added value does the VAR model provide? We can test this by eliminating the first part of the rule and considering all days in which the stock closed below the midrange. The results turn out to as shown in Fig. 3.

Fig. 3 Performance of Simplified Trading Rule 

Results2

Source: Yahoo Finance.

As expected, the in-sample results from our shortened trading rule are certainly inferior to the original rule, in which the VAR model forecasts played a role. But the out-of-sample performance of the simplified rule is actually improved – not only is the net return higher than before, so too is the % win rate, by a couple of percentage points.

A similar pattern emerges for many other stocks: in almost every case, our test algorithm finds that the best trading rule buys the close, based on a comparison of the closing price to the mid-range price. In some cases, the in-sample test results are improved by adding further conditions, such as we saw in the case of MMM. But, as with MMM, we often find that the additional benefit derived from use of the autoregression model forecasts fails to improve trading rule results in the out-of-sample period, and indeed often makes them worse.

Conclusion

In general, we find evidence that a simple trading rule based on a comparison of the closing price to the mid-range price appears to work for many stocks, across long time spans.

In a sense, this simple trading rule is already well known: it is just a variant of the “buy the dips” idea, where, in this case, we define a dip as being when the stock closes below the mid-range of the day, rather than, say, below a moving average level. The economic basis for this finding is also well known: stocks have positive drift. But it is interesting to find yet another confirmation of this well-known idea. And it leaves open the possibility that the trading concept could be further improved by introducing additional rules, trading indicators, and model forecasts to the mix.