

I tend not to get involved in Q&A with readers of my blog, or with investors. I am at a point in my life where I spend my time mostly doing what I want to do, rather than what other people would like me to do. And since I enjoy doing research and trading, I try to maximize the amount of time I spend on those activities.
As a business strategy, I wouldn’t necessarily recommend this approach. It’s just something I evolved while learning to play chess: since I had no-one to teach me, I had to learn everything for myself and this involved studying for many, many hours alone.
By contrast, several of the best money managers are also excellent communicators – take Roy Niederhoffer, or Ernie Chan, for example. Having regular, informed communication with your investors is, as smarter managers have realized, a means of building trust and investor loyalty – important factors that come into play during periods when your strategy is underperforming. Not only that, but since communication is two-way, an analyst/manager can learn much from his exchanges with his clients. Knowing how others perceive you – and your competitors – for example, is very useful information. So, too, is information about your competitors’ research ideas, investment strategies and fund performance, which can often be gleaned from discussions with investors. There are plenty of reasons to prefer a policy of regular, open communication.
As a case in point, I was surprised to learn from comments on another research blog that readers drew the conclusion from my previous posts that pursuing the cointegration or Kalman Filter approach to statistical arbitrage was a waste of time. Apparently, my remark to the effect that researchers often failed to pay attention to the net PnL per share in evaluating stat. arb. trading strategies was taken by some to mean that any apparent profitability would always be subsumed within the bid-offer spread. That was not my intention. What I intended to convey was that in some instances, this would be the case – some, but not all.
To illustrate the point, below are the out-of-sample results from a research study applying the Kalman Filter approach for four equity pairs using 5-minute data. For competitive reasons I am unable to identify the specific stocks in each pair, which result from an exhaustive analysis of over 30,000 pairs, but I can say that they are liquid large-cap equities traded in large volume on the US exchanges. The performance numbers are net of transaction costs and are based on the assumption of a 5-minute delay in execution: meaning, a trading signal received at time t is assumed to be executed at time t+5 minutes. This allows sufficient time to leg into each trade passively, in most cases avoiding the bid-offer spread. The net PnL per share is above 1.5c per share for each pair.
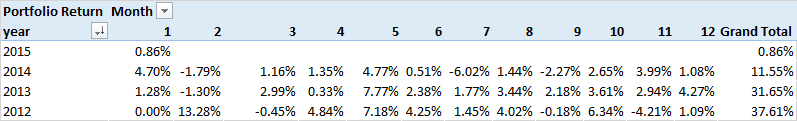
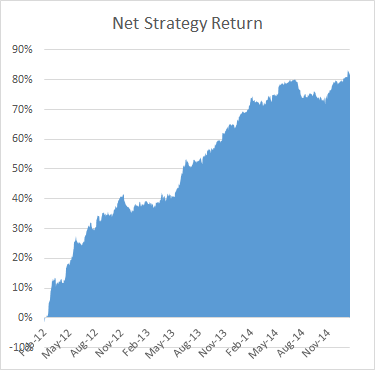
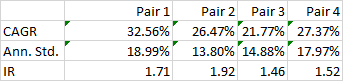 While the performance of none of the pairs is spectacular, a combined portfolio has quite attractive characteristics, which include 81% winning months since Jan 2012, a CAGR of over 27% and Information Ratio of 2.29, measured on monthly returns (2.74 based on daily returns).
Finally, I am currently implementing trading of a number of stock portfolios based on static cointegration relationships that have out-of-sample information ratios of between 3 and 4, using daily data.