
The Holdout That Made the Sharpe Bigger

First, a correction

The panel in my September post was supposed to have zero alpha. It didn’t quite. The market factor carried a drift of 0.0002 per day and the betas were drawn N(1, 0.3), so a book that tilted towards high-beta names had a true Sharpe of about +0.22 on a panel I described as containing nothing. The generator also clipped daily returns asymmetrically, at [−0.5, +1.0], which leaves a name whose shock breaches the floor with a small positive mean that a book ranking on volatility can load on.

I found this while building the generator for this study, and priced both defects rather than describing them. Every one of the 294 books that post reported on its zero-alpha panels — both reporting rules, all five arms — has been re-scored on the published panel and on a twin that differs only in having the drift removed. The twin is bit-identical otherwise: the drift constant consumes no random draws, so the two panels share every innovation. The recomputation reproduces all 294 published Sharpe ratios to machine precision (maximum absolute error 8.9 × 10⁻¹⁶).

The clip is the smaller of the two, and separable the same way. Across the twelve September panels it binds on 7 of 6,000,000 daily returns — a daily return above +50% is not a common event in a panel of 2%-volatility names — and a volatility-ranked book collects +0.003 of out-of-sample Sharpe from it (SE 0.002, largest on any single panel 0.02). The rest of this section is the drift.

September’s headline is an in-sample number, and in sample the drift is worth almost nothing: the median drift component of in-sample Sharpe across all 294 books is +0.006, and for the agent’s own books it is −0.007, against a published 2.24. Out of sample the median by arm runs +0.004 to +0.019, and no arm-and-rule cell exceeds +0.025, against +0.27 for a book constructed deliberately to load on beta — a different measurement from the +0.22 above, which is that book’s absolute Sharpe on the September panels rather than its drift component. Individual books move more — the largest is +0.49 and the smallest −0.22, and book beta loadings run from −0.21 to +0.25 — so the drift is not invisible at the level of a single run. The pre-registered threshold I had set for retracting a September conclusion, a median drift component above 0.101, does not fire.
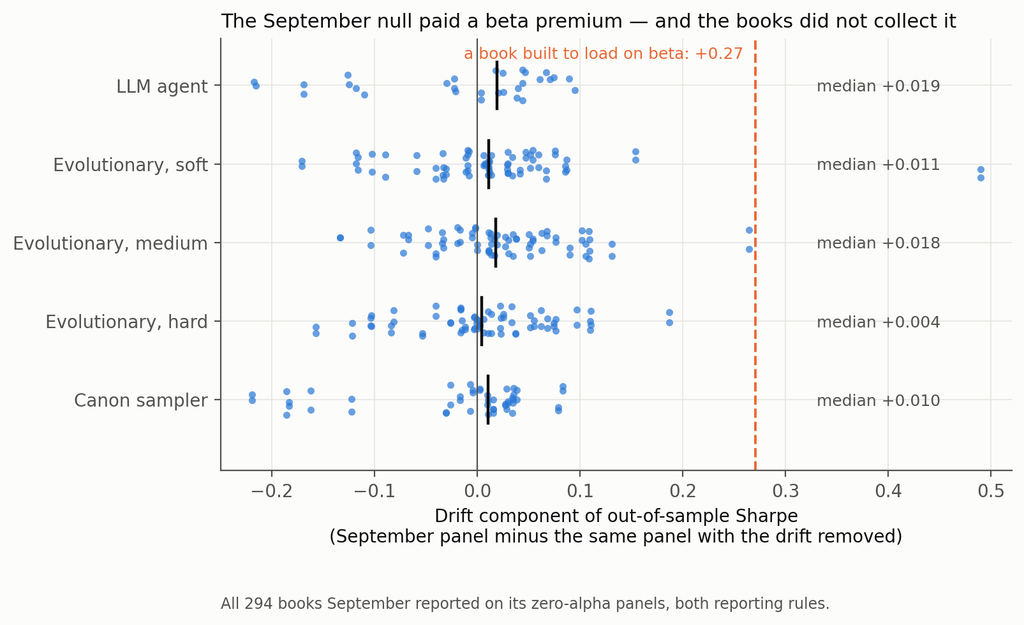
Every book September reported, on the published panel and on its drift-free twin

So September’s headline — that a research agent manufactures an in-sample Sharpe of 2.1 from nothing, and that 88% of it is explained by two integers in the log — stands. The generator does not. It has been replaced, the arithmetic is in the repository, and the correction is in this post rather than in a footnote, because a null you cannot verify is what this entire post is about.

Setup

The null. Factor-structured daily panels: 400 names, regime-switching volatility on the market and three latent factors, Student-t idiosyncratic shocks, lognormal dispersion in volatility. Zero drift, symmetric clipping, and — the part the September generator got wrong — separate random streams for structure (betas, loadings, volatilities, regime paths) and for innovations, so a fresh path can be drawn through the same world.

Verifying that a null is null is harder than writing one. The pre-registered acceptance test probed a constant-beta book and two oracle signals; it passed on two and, on the third, produced a +0.093 on the sixty study seeds that went away on a 120-seed replication. That episode is in the deviations file, and the acceptance file records the pre-registered failure rather than only the replication that passed. It also convinced me the test was too blunt, so there is a better one: 200 expressions drawn from the signal grammar before any panel existed, of which a median of 184 evaluate cleanly on a given panel, across 40 fresh null panels — 7,346 signal-panels, mean annualised Sharpe +0.017, 95% CI [−0.015, +0.048].

Two honest caveats on that. It is measured on the 1,000-day training window, not on the 2,000-day window the books are scored on. And on the exact sixty seeds this study ran, the residual tilt from the acceptance test is bounded at about +0.09 — larger than several of the out-of-sample numbers below. I flag them where they appear.

The pipeline being controlled. An evolutionary search over the same price-only grammar as the September post — returns, moving averages, rolling moments, range position, rolling beta and correlation, with cross-sectional and time-series normalisations. Twelve rounds of twenty-five expressions. The uncontrolled baseline reports the three highest in-sample Sharpes as an equal-weight book. Sixty seeds (9000–9059); 1,000 training days; 2,000 untouched days for scoring.

The two things worth measuring. Every control is placed on two axes.

How much manufactured Sharpe does it remove? Measured on panels with no alpha, and — this matters more than it sounds — measured on the number a user of that control would actually report. If a gate abstains, nothing is reported. If a control re-selects on a validation window, the researcher reports the validation-window number, not the training number they just threw away. If a control searches a shorter window, the researcher reports the shorter window’s Sharpe. Measuring every control on the original training window, which is what I did in the first pass of this study, flatters every re-selection control enormously and is the single largest correction here.

How much real alpha does it destroy? Measured on the same panels with a signal planted in them. Because each seed’s panels are drawn from identical innovations and differ only in the plant, the same book can be scored on both, which separates the exposure a noise-selected book has to the plant by construction from the gain that selecting on the planted panel actually adds. Only the second is “finding alpha”.

Two plants, and why. My first plant was calibrated to an in-sample Sharpe of about 1.0 — below the 1.77 the search manufactures from noise. A pipeline that ranks on in-sample Sharpe must then prefer the noise, so “the search fails to find real alpha” was a property of my calibration rather than a finding. There are now two, both calibrated on thirty seeds (8000–8029) rather than the three the first pass used: a weak plant and a strong one, with realised out-of-sample oracle Sharpes on the study seeds of 0.59 and 2.43.

The analysis plan, the predictions and the estimators were committed before the first search ran. Eighteen departures from them are logged, including several this study’s reviewers forced.

1. Selection manufactures the Sharpe. The search adds nothing.

Start with the uncontrolled pipeline on panels containing nothing:

Uncontrolled pipeline, 60 null panelsValue
Reported in-sample Sharpe1.77 (SE 0.04)
Realised out-of-sample Sharpe, 2,000 days+0.015 (SE 0.051)
One-way turnover, per day19.5%
Net of 5 bp per unit of turnover, at ≈2.5% book volatility−1.00

Familiar enough. Now the part I did not expect. Take 200 expressions drawn at random from the grammar before any panel is generated — no search, no feedback, no breeding — and keep the best three by in-sample Sharpe. On the same kind of null panel that book has an annualised in-sample Sharpe of 1.99 (SE 0.05, 40 panels).

Put the evolutionary search on exactly the same footing — its own logged candidates, the same 700-day window, the same complete-case filter, top three re-selected on that window — and it reports 1.95 (SE 0.05, 60 panels). The difference is 0.04, Welch t = 0.60.

Twelve rounds of adaptive search, three hundred evaluations, mutation and crossover, and the machinery adds nothing measurable to the manufactured number. Picking three things out of a hundred and eighty-odd does all of the work. (The two arms run on different seed sets and are not paired; the pools are matched at 182 against 184 candidates after filtering, with participation ratios of 13 and 15.)

Whatever your research process is — an agent, a grid, a graduate student with a notebook — the quantity that produces the fictitious Sharpe is the size of the set you chose from, and nothing clever has to have happened inside.

2. The holdout that made the number bigger

Here is the reported in-sample Sharpe on panels with no alpha, for each control, measured on the window that control actually reports:

ControlReported Sharpe, null panelsManufactured Sharpe removedAbstains
Internal gate (search 750 days, pick on 250)3.08−0.74—
Internal gate + leg cap of 12.45−0.38—
750-day search, no gate2.15−0.22—
Leg cap 121.78−0.01—
Uncontrolled baseline1.77——
Leg cap 11.650.07—
Budget 6 × 251.590.10—
Budget 12 × 121.560.12—
Budget 6 × 121.420.20—
Out-of-path gate (fresh innovations)1.360.23—
CSCV / PBO gate1.080.3925 of 60
Romano–Wolf stepdown0.410.7748 of 60
Deflated Sharpe hurdle0.001.0060 of 60

Read the last column before the middle one. For the three gates, the removal figure is driven by the abstention rate rather than by any reduction: those gates never make a fiction smaller. They make it rarer — and on the panels where Romano–Wolf does pass, the book it lets through reports 2.04, above the 1.77 it was meant to discipline; the PBO gate’s pass-conditional number is 1.85. That is why each gate’s removal figure sits below its abstention rate — 0.77 against 48 abstentions in 60, 0.39 against 25 — and it means that conditional on getting an answer out of them, you get a worse number than if you had not asked.

Now the top of the table. The train/validate split is the most widely practised control in quantitative research, and on a panel with no alpha it made the reported number 74% larger.

The mechanism is not subtle once you see it. On a panel with no alpha, every point of reported Sharpe is selection. The standard error of a Sharpe estimate scales as one over the square root of the sample, and for a fixed candidate pool the expected maximum scales with that standard error — so the ratio of two reported maxima should be the square root of the inverse ratio of their sample sizes. Those sample sizes are the days the Sharpe is actually computed over, after each book’s warm-up is dropped: 876 for the baseline, 591 for the 750-day search, and a clean 250 for the validation window, which needs no warm-up.

Predicted: √(876/591) = 1.2172 and √(876/250) = 1.872. Observed: 1.2175 and 1.742. The first is right to three decimal places. The gate falls a little short of its prediction because it selects from a pool bred on a different window, so its candidates are not the baseline’s candidates.

Look at the “750-day search, no gate” row, which is there precisely to separate the two effects. Running the same shorter search and reporting its own window’s top three already inflates the number by 22%. The gate adds a further 52 points of the baseline on top of that. Splitting the sample does not remove the selection: it relocates the selection to a shorter window, where selection is cheaper and its rewards are larger — and then hands you that number to report. This is the practical form of a result that is already well established in adaptive data analysis: a holdout reused for selection stops being a holdout [8].

The same logic hits the out-of-path gate, which I expected to be the best control in the study. It re-scores every candidate on a genuinely fresh path through the same world and keeps the best three. A top-three-of-two-hundred maximum over 1,000 fresh days is still worth 1.36. The gate does not remove the manufactured Sharpe. It moves it onto a new path and lets you report it there with a clear conscience.

If a control ends by selecting a maximum, the maximum is the problem, and the control has not addressed it.

One anticipation. A 750/250 split is not a straw split — 70/30 and 80/20 are the conventional choices, and the effect gets worse as the validation window shrinks, so a shop splitting 80/20 on four years is further along this curve than the one measured here.

3. The corrections are fine. You are pointing them at the wrong family.

Three of these controls are formal multiple-testing procedures with published guarantees: the deflated Sharpe ratio [1], the CSCV probability of backtest overfitting [2], and a Romano–Wolf stepdown at 5% familywise error [3], bootstrapped with a stationary block bootstrap [4]. Their realised size on null data is well known to be disappointing in practice. The question that seems not to get asked is whether that is the procedure’s fault.

So I measured each twice: once on the family of candidates the search produced, and once on a family of 200 expressions fixed before the data existed.
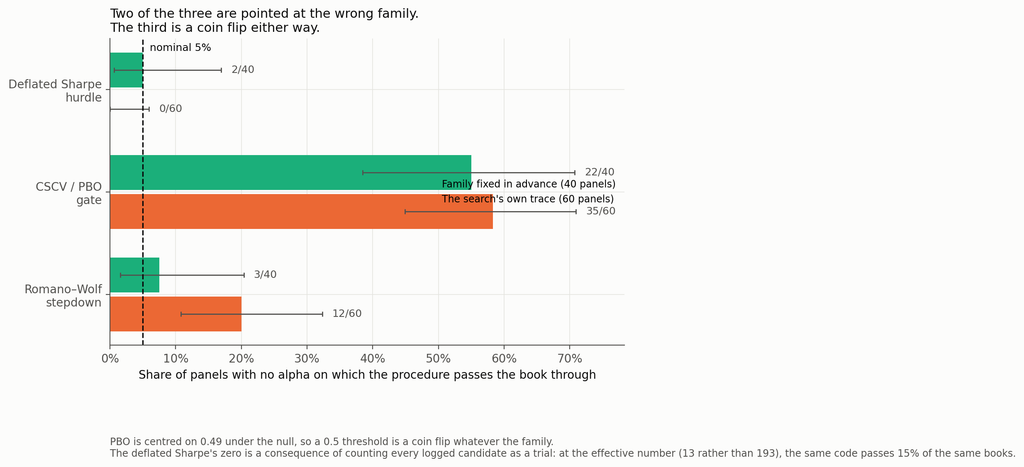
Realised size on a family fixed in advance against the search’s own trace

ProcedureFamily fixed in advance (40 panels)The search’s own trace (60 panels)
Deflated Sharpe hurdle2 of 40 (5%)0 of 60 at N = 193 logged; 9 of 60 (15%) at N effective = 13
CSCV / PBO gate22 of 40 (55%)35 of 60 (58%)
Romano–Wolf stepdown3 of 40 (8%)12 of 60 (20%)

On a family chosen before the data I can detect no inflation in either formal procedure. Forty panels is not enough to certify a 5% test — the Romano–Wolf interval runs from 1.6% to 20.4% — so read that column as the absence of the gross inflation the search family produces, not as a calibration certificate. What is unambiguous is the other side. Pointed at the family the search produced, Romano–Wolf rejects on 12 of 60 panels containing nothing: four times nominal, binomial p < 10⁻⁴. Forty panels against sixty is too little to make the 8%-versus-20% contrast itself significant — Fisher’s exact test on that comparison gives p = 0.15 — so the claim that carries is the one against nominal, not the one across columns. The size inflation on the search family is also not a bootstrap artefact: it holds at expected block lengths of 5, 21 and 63 days and at 500 and 2,000 replications, ranging from 18% to 20% across all four settings.

Why? Not because the bootstrap fails to see the generations that bred the survivors — restrict the family to the search’s round-zero population, random expressions no selection has touched, and rejections fall from 12 panels to 6 (paired exact p = 0.07). That points at adaptive breeding as one contributor rather than the whole story; on sixty panels it is a direction, not a decomposition. The rest is the plainer fact that the family was chosen by looking at the window the test then uses.

The deflated Sharpe ratio is a more uncomfortable case, because its answer is determined by a number you supply. It needs the number of trials; I gave it the count of distinct expressions the search logged, a mean of 193 across panels (range 103 to 258). Those are not independent trials — the participation ratio of their correlation matrix averages 13 (range 5 to 26). Feeding 193 independent trials into a formula that assumes independence pushes the expected-maximum benchmark above the book’s Sharpe on 40 of 60 panels, and leaves the z-statistic short of the 95th percentile on the other twenty — so the hurdle rejects everything. Feed it 13 and the same code, on the same books, passes 9 of 60 — three times nominal (p = 0.003), in the opposite direction. The control’s verdict is a function of a modelling choice nobody documents. To be clear, no published implementation asks for an effective trial count; this is an extension of the method, not a correction to it.

And then there is PBO, which I had been treating as a control and which is not one. CSCV’s logit statistic is symmetric about zero when the candidate strategies are exchangeable and null, so the probability of backtest overfitting is centred on 0.49 — by construction, not by accident. A threshold at 0.5 is therefore a coin flip on data containing nothing: it passes 55% of pre-specified null books and 58% of searched null books. It is not powerless — against the strong plant it passes 95% — but a gate whose false-pass rate is 58% is not a 5% test, whatever it does on real signal.

4. What the controls cost you

Removing fiction is half of a control’s job. The other half is not destroying the thing you are looking for, and you cannot measure that on a null panel.

Against the strong plant — realised out-of-sample oracle Sharpe 2.43, above what the search can manufacture — here is what each control finds of it, alongside what it removes:
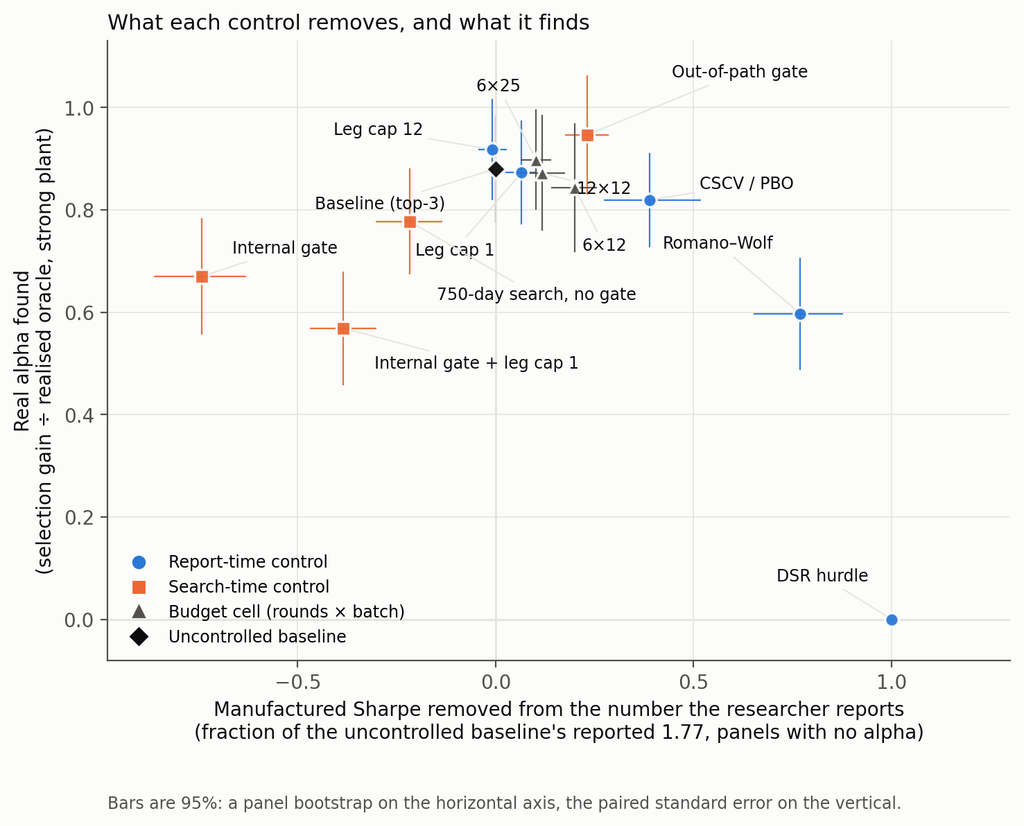
What each control removes and what it keeps

The right-hand column is the selection gain defined in the Setup — what selecting on the planted panel adds over what a null-selected book earns on it by construction. The raw ratio of book Sharpe to oracle is lower, because a book’s exposure to the plant is slightly negative on average: 0.81 for the baseline and 0.85 for the out-of-path gate.

ControlManufactured Sharpe removedReal alpha found (selection gain ÷ oracle)
Out-of-path gate0.230.95
Leg cap 12−0.010.92
Budget 6 × 250.100.90
Uncontrolled baseline—0.88
Leg cap 10.070.87
Budget 12 × 120.120.87
Budget 6 × 120.200.84
CSCV / PBO gate0.390.82
750-day search, no gate−0.220.78
Internal gate−0.740.67
Romano–Wolf stepdown0.770.60
Internal gate + leg cap 1−0.380.57
Deflated Sharpe hurdle1.000.00

The minimum difference detectable at 80% power between the baseline and any of the seven pre-registered controls in that column, after Holm across the whole 84-test scan, runs from 0.05 to 0.21 of the oracle. Differences smaller than that should not be read — including the gap between the out-of-path gate’s 0.95 and the uncontrolled baseline’s 0.88, which is nominally the largest in the table and is not separable at this sample size.

The deflated Sharpe hurdle rejects a genuine 2.4-Sharpe strategy on all sixty panels, and passes exactly one of the sixty carrying the weak plant. Its perfect score in the removal column and its zero in the retention column are the same fact stated twice. A control that abstains on everything is unfalsifiable on null data and useless on real data, and you cannot tell those two properties apart without running a planted arm.

Romano–Wolf is the most defensible trade in the table: it removes 77% of the fiction — by abstaining four times in five — and keeps 60% of a strong real signal. That is a real control with a real price, which is more than most of this column can claim.

The out-of-path gate keeps the most alpha while removing a real 23% of the fiction. It is the only control whose null-panel out-of-sample Sharpe is even marginally negative (−0.086, SE 0.045, 95% CI [−0.17, +0.00]) — a t of 1.9 in a scan across fourteen arms, and inside the residual-tilt bound I flagged in the Setup, so I would not lean on the sign.

Four controls dominate the internal gate on both axes after Holm adjustment: leg cap 1, leg cap 12, the out-of-path gate, and — awkwardly — the PBO gate I have just described as a coin flip. No other pair dominates. That a gate with no size control still dominates the internal gate says more about the internal gate than it does about PBO.

A fourteenth arm, the shorter search with a leg cap of 1, is in the repository and not in these tables: it reports 2.01 on null panels — a little less inflation than the window-matched arm’s 2.15 — and finds 0.78 of the plant, which is the window-matched arm’s figure to within noise.
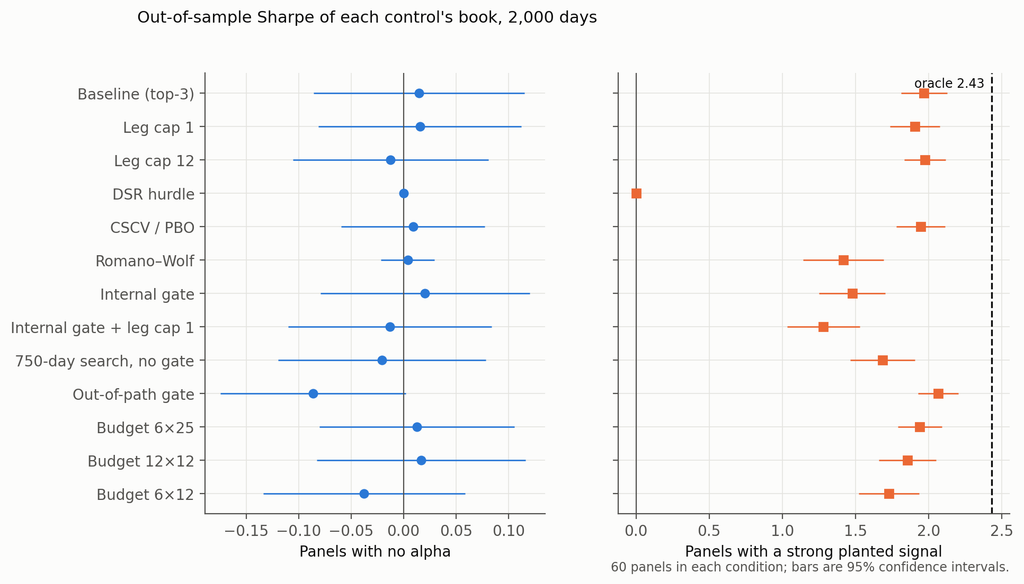
Out-of-sample Sharpe of each control’s book, with no alpha and with a strong plant

One more thing this table only shows because there is a strong plant in the study. Against the weak plant — oracle 0.59 — the uncontrolled pipeline’s selection gain is 11% of the oracle with a minimum detectable effect of 27%. That is not a finding, it is a non-detection, and the first pass of this study reported it as “the search captures 6% of the real signal”. The honest version is conditional and worth stating precisely: a search that ranks on in-sample Sharpe finds real alpha when the real alpha is larger than the alpha it can manufacture, and there is no evidence either way when it is smaller.

5. The agent behaves much like the machine

Eighteen fresh runs of the September research agent through a gated harness, six per condition, with the prompt frozen:

ConditionReported in-sampleRealised out-of-sampleOracleFound the plant
No alpha1.41−0.16 (SE 0.12)——
Weak plant1.52+0.24 (SE 0.17)0.503 of 6 exactly, 4 of 6 by family
Strong plant2.91+2.04 (SE 0.16)2.313 of 6 exactly, 6 of 6 by family

Manufactures on nothing, indistinguishable from noise against a weak signal, and its book earns 88% of the strong plant’s oracle out of sample against the mechanical pipeline’s 81% on the same raw basis. The arms ran on different panels and are not formally compared; qualitatively, whatever an LLM researcher is doing, it is not different enough from an evolutionary search to warrant a different control regime.

The arm is not blinded: the run id the agent types on every harness call carries the condition, K0, K1 or K2. Nothing in the logs refers to it, but it was in front of the agent, and six runs per condition is a small arm.

Two details worth having. The agents worked harder when there was more to find — 4.2 evaluation batches of a permitted 12 against the weak plant, 8.5 against the strong one — but they did not stop early on the null panel, where they used 5.7 batches and one run burned all twelve. That is responsiveness to signal strength, not an ability to notice there is nothing there.

And the twelve September agent traces, re-scored under the report-time controls on drift-free panels, behave as the mechanical arms do: the deflated Sharpe hurdle passes 0 of 12, PBO 5 of 12, Romano–Wolf 7 of 12. The exception is leg caps, which move an agent’s reported Sharpe by +0.02 on average at a cap of one and −0.02 at a cap of twelve — never by more than 0.29 on any single run, and in no consistent direction — because an agent’s legs live inside a single expression rather than in the count of expressions. Any control that counts expressions is close to blind to an agent.

6. One real path, for illustration

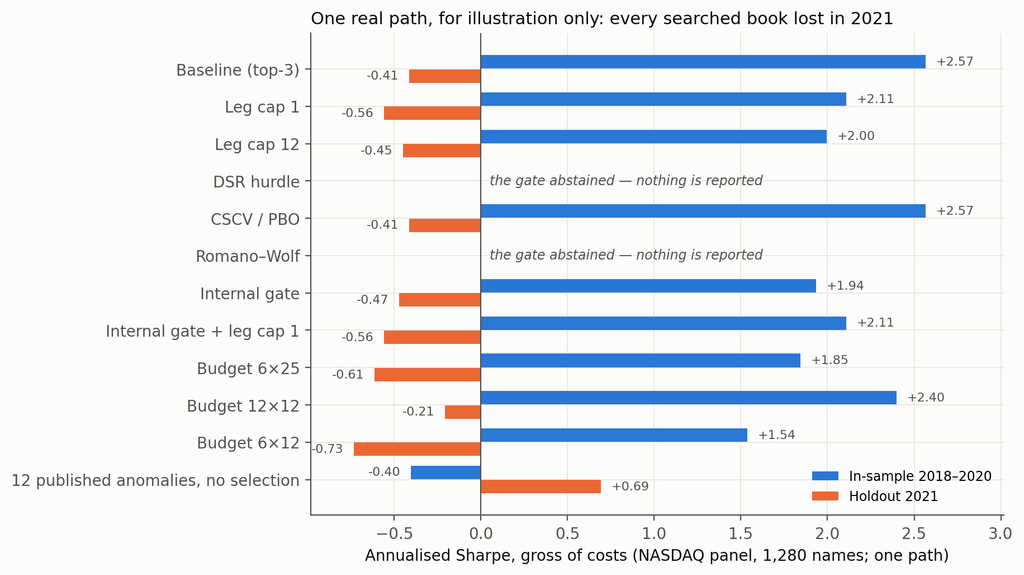
The same pipeline on a real panel — 1,280 NASDAQ names, search 2018–2020, holdout 2021 [5]. One path, a stale and survivorship-conditioned dataset, and a universe filter that looks at the whole sample. It evidences nothing; it is here because it makes the synthetic result legible.

BookIn-sample 2018–2020Holdout 2021Through May 2023
Baseline (top-3)+2.57−0.41−0.24
Leg cap 1+2.11−0.56−0.45
Leg cap 12+2.00−0.45−0.26
CSCV / PBO (passed)+2.57−0.41−0.24
Internal gate+1.94−0.47−0.26
Internal gate + leg cap 1+2.11−0.56−0.45
Budget 6 × 25+1.85−0.61−0.52
Budget 12 × 12+2.40−0.21−0.30
Budget 6 × 12+1.54−0.73−0.64
Deflated Sharpe hurdleabstained——
Romano–Wolfabstained——
Twelve published anomalies, no selection−0.40+0.69+0.69

Every searched book on the real panel, in sample and out

Every searched book turned negative. The unselected canon, which looked worst in sample, was the only thing that worked out of sample. Consistent with the synthetic result, and worth precisely as much as one path is worth.

One inconsistency to flag rather than let a reader find: the in-sample column here is the full 2018–2020 window for every book, including the internal gate, so it is not the reported-window number section 2 corrects to. On this arm the gate therefore appears to lower the in-sample figure when the synthetic result says it raises the number the gate’s user would report. The real panel’s dataset is fetched over the network and I could not re-score that row from the sandbox this study ran in; it is stated here rather than quietly left in the table.

The pre-registration scorecard

PredictionVerdict
P1 the out-of-path gate dominates the DSR hurdle on both axesRefuted, with each control winning one axis: the out-of-path gate removes 1.36 less of the reported Sharpe (CI [−1.45, −1.27]) and finds 2.07 more of the plant (CI [+1.92, +2.21])
P2 a leg cap of 1 removes ≥ 0.20 more than the smallest budget cellRefuted: −0.13, CI [−0.19, −0.07]
P3 the DSR hurdle’s size exceeds 25%Refuted: 0 of 60, conditional on N = logged candidates
P4a the internal gate costs ≥ 0.10 Sharpe on planted panelsConfirmed: −0.49, CI [−0.69, −0.29]
P4b the internal gate removes ≥ 0.50 of the manufactured SharpeRefuted, and in the opposite direction: −0.74

Things that did not work

The leg axis. Capping a book at one leg removes 0.13 less manufactured Sharpe than the smallest search budget does — the budget axis beat the leg axis, and leg caps are close to a no-op on this pipeline. Against an agent they are a complete no-op, for the reason in section 5. This is the one place where I expected a result from the literature to transfer and it didn’t: in-sample statistics do inflate with the number of combined signals [9], but not in a way a cap on the count can reach when the signals are themselves sums.

The pre-registered “oracle frontier” — thresholding candidates on their true out-of-sample Sharpe to trace the best attainable trade-off — is not reported at all. Estimating “true” out-of-sample Sharpe on the same window that scores the books is circular, and on null panels it obligingly produced a frontier that “retained” +0.60 of Sharpe that does not exist. The file is in the repository; the chart does not draw it.

And the first version of this study, which four reviewers took apart before publication. The largest correction was measuring each control on the number a researcher reports rather than the number they discard, which reversed the sign of the headline. The second was noticing that my planted signal had been calibrated to a level the search could beat by fabrication, which made one of my conclusions a property of the experiment rather than of the world. The third was catching three numbers quoted from the weak-plant arm where the text said otherwise. The fourth was showing that this post’s own draft compared the random family and the search on different windows, which inflated the gap in section 1 into a result it is not. All eighteen deviations are logged, and the first-pass tables sit in the repository beside the corrected ones.

What this does and does not show

It does show that on a verified-null panel an in-sample Sharpe of about 1.9 comes out of selecting three candidates from a couple of hundred, on the window the selection is made, and that twelve rounds of adaptive search add nothing measurable to that number.

It does show that a held-out validation window, used the way it is normally used, raises the reported Sharpe rather than lowering it, by roughly the factor the standard error of a Sharpe estimate predicts; and that a fresh-path re-test mostly relocates the manufactured Sharpe rather than removing it.

It does show that two of the three formal procedures show no detectable inflation on a family fixed in advance and are grossly mis-sized on a family the search selected; and that the third is centred on its own threshold under the null and therefore does not decide anything about size.

It does show that a pipeline, mechanical or agentic, recovers most of a planted signal strong enough to beat what it can manufacture — and that the deflated Sharpe hurdle, as conventionally parameterised, destroys all of it.

It does not show that any of these procedures is wrong. Each is implemented here against its published definition and is doing what it was designed to do on the input it is handed.

It does not show anything about faint alpha. Against a signal with a 0.59 oracle Sharpe this design cannot separate “finds nothing” from “finds a quarter of it”. That needs more panels or a longer scoring window.

It does not show a ranking of controls that transfers. The removal axis depends on the reporting convention, the retention axis on a plant that happens to be a single expression the grammar can write exactly — evaluated verbatim by the mechanical search on only 6 of the 60 strong-plant panels, so its findability is not an artefact of expressibility, but a plant the grammar cannot write at all would give a different answer. The leg-cap results depend on a grammar in which a leg is a separate expression, and every net-of-cost number on a book volatility of about 2.5%.

It does not show anything about real markets. One path on a stale dataset is an illustration.

So what do you do?

Report the number you selected on, and say which window it is. Most of the apparent power of every re-selection control in this study came from measuring it on a window the researcher had already discarded: the out-of-path gate’s removal falls from 0.99 to 0.23 when you do this properly, and the internal gate’s flips sign, from +0.47 to −0.74. If your validation split produces a Sharpe of 3.1 where your in-sample fit produced 1.8, the honest headline is 3.1, and the fact that it is larger should alarm you rather than reassure you.

Write down the family before you look. Not the trial count — the family. Every procedure in section 3 shows no inflation on a family fixed in advance and gross inflation on a family your search selected, and the difference between those is a decision you make before the data, not a correction you apply after it.

If you use the deflated Sharpe ratio, state how you counted trials, and report the effective number alongside the raw count. The gap between 193 and 13 on the same candidate set moved the pass rate from 0% to 15%. No published implementation asks for an effective count, so this is an extension rather than a fix — but a DSR quoted without saying how trials were counted is a number with a free parameter in it.

Stop using a PBO threshold of 0.5 as a gate. It is centred on 0.49 under the null. Use the distribution, or use something else.

Run a planted arm. This is the one that costs real effort and is worth it. A control that abstains on everything looks perfect on a null panel; you only find out what it costs when you give it something real to find. And calibrate the plant above what your own pipeline can fabricate, or you will measure your calibration rather than your control — which is exactly what the first version of this study did.

Code and data

The repository holds the pre-registered analysis plan committed before the first run, eighteen logged deviations from it, the corrected generator with its bitwise verification against the September panels, the calibration of both plants, the full study across 180 panels, the pre-specified-family placebo, the erratum arithmetic against all 294 previously published books, the agent harness with every run log and journal, the canary tests, and the analysis and figure code. Seeds: study panels 9000–9059, calibration 8000–8029, placebo panels 9500–9539, pre-specified family drawn from seed 20260921. Everything except the LLM calls reproduces from those seeds; the LLM calls are not re-runnable, which is why the logs are included in full. The repository is at github.com/jkinlay/research-controls; this article refers to commit c11241e.

Two requests of anyone re-running it. Fix your family before you look at the data, and keep the list. And run a planted arm alongside the null arm — half the results here are invisible without one.

References

[1] Bailey & López de Prado, The Deflated Sharpe Ratio: Correcting for Selection Bias, Backtest Overfitting and Non-Normality, Journal of Portfolio Management 40(5), 2014.

[2] Bailey, Borwein, López de Prado & Zhu, The Probability of Backtest Overfitting, Journal of Computational Finance 20(4), 2017; and Pseudo-Mathematics and Financial Charlatanism, Notices of the AMS 61(5), 2014, for the expected-maximum-Sharpe result.

[3] Romano & Wolf, Stepwise Multiple Testing as Formalized Data Snooping, Econometrica 73(4), 2005, 1237–1282. The stepdown implemented here is the one-sided studentised version at 5% familywise error.

[4] Politis & Romano, The Stationary Bootstrap, Journal of the American Statistical Association 89(428), 1994. Expected block length 21 days throughout. The section 3 size result is stable across that choice: 18% at a block length of 5, 20% at 21, 18% at 63, and 18% at 21 with 2,000 replications rather than 500.

[5] skfolio, load_nasdaq_dataset — daily adjusted closes, 1,455 NASDAQ constituents, 2018-01-02 to 2023-05-31, documented by its authors as a stale dataset not intended for investment or commercial use. Filtered here to 1,280 names with median price ≥ $5.

[6] Harvey & Liu, Backtesting, Journal of Portfolio Management 42(1), 2015 — the multiple-testing haircut the report-time controls in section 3 descend from.

[7] Harvey & Liu, False (and Missed) Discoveries in Financial Economics, Journal of Finance 75(5), 2020, on the two-sided cost of correction; section 4 is a direct measurement of the missed-discovery side. See also Chen, The Limits of p-Hacking: Some Thought Experiments, Journal of Finance 76(5), 2021, 2447–2480, for the argument that selection alone cannot account for the observed cross-section — the complement of the measurement in section 1.

[8] Dwork, Feldman, Hardt, Pitassi, Reingold & Roth, The reusable holdout: Preserving validity in adaptive data analysis, Science 349(6248), 2015. Section 2 is the practical, one-reuse form of the result that a holdout used for selection stops being a holdout.

[9] Novy-Marx, Backtesting Strategies Based on Multiple Signals, NBER Working Paper 21329, 2015, on the inflation of in-sample statistics with the number of combined signals — the leg axis that section 4 finds to be a no-op here.

Disclosure: I run systematic strategies. Nothing here is a recommendation, and no strategy discussed is one I trade. These are diagnostic quantities from a methodological experiment on synthetic data and one stale public dataset, not a track record.


Agentic Workflows for Alpha Research

A 12-Week Practitioner Case Study

There is by now a small mountain of vendor material claiming that AI agents will run hedge funds. The reality on the ground — for those of us who actually do the work — is more interesting and more useful. Agentic workflows, properly constructed, materially accelerate the parts of quant research that consume the most time. They also fail in specific, predictable ways that you can defend against if you take them seriously and ignore if you don’t.

This post is a write-up of an architecture I have been using for the last four months on an FX-carry research project, and what it changed about my throughput. The headline finding is that the right unit of measurement is not “ideas per hour” — which is misleading — but ideas that survive a human-grade critique per month. On that metric the lift, on this single workstream, is on the order of 2× rather than 10×, and it comes from a very specific allocation of work between the human and the agent.

The single most important thing to internalise before reading further is that the architecture is the load-bearing piece — not the prompts, not the model choice. Most of what makes this stack work would still work if you swapped Claude for any other frontier model; very little of it would work if you swapped the typed handoffs, the research log, and the human gates for a single conversational thread. The recent multi-agent literature converges on the same conclusion from the software-engineering side — AutoGen [1] frames LLM applications as configurable agents with structured interaction, and MetaGPT [2] argues explicitly that encoding standard operating procedures into role-specialised pipelines is what produces reliable outputs. The point of this post is to make the same argument for the quant-research side, and to instrument the claim with measured numbers rather than vibes.

1. What alpha research actually consists of

Before discussing what to automate, it helps to be honest about what the day-to-day is.

A reasonable decomposition of the time I spend on a single research idea, end-to-end:

  • Literature triage and replication — finding the three papers that matter out of the thirty that cite the relevant phenomenon, and reproducing their core result. 20–25%.
  • Hypothesis specification — stating the economic claim precisely enough that a backtest can falsify it. 5%.
  • Data wrangling — sourcing, aligning, point-in-time correctness, handling holidays and corporate actions. 25–30%.
  • Implementation — writing the signal, the portfolio construction, the cost model, the evaluator. 10–15%.
  • Diagnostic and ablation work — by-regime, by-subsample, by-feature, transaction-cost sensitivity, parameter stability. 20%.
  • Judgment and synthesis — deciding whether what you have is real, whether it adds to the existing book, and whether to risk it. 10%.

The last category is the one that actually distinguishes a senior researcher from a junior one, and it is the category that AI agents are worst at. The first four are the categories where they are dramatically better than the alternative of doing it yourself.

The architecture I will describe is built around that asymmetry: aggressively delegate the first four, keep judgment human, and instrument the boundary between the two so failures are visible early.

2. The naive loop and why it fails

The seductive thing to do — and the thing every demo on Twitter shows — is to wire a single capable LLM up to a Python sandbox and a price-history database and tell it “find me alpha in EM FX”. I tried this. So has everyone.

What you get back, reliably, is a strategy with an in-sample Sharpe of 2.4 that does the following four things:

  1. Uses some flavour of recent-return signal with a lookback chosen to fit the sample.
  2. Sizes positions inversely proportional to realised volatility, with the volatility window also chosen to fit the sample.
  3. Quietly references a feature whose construction has a one-step look-ahead bug.
  4. Reports backtest statistics over a period that conveniently excludes the 2022 carry drawdown.

The agent is not malicious. It is doing exactly what you asked. The objective you wrote — “maximise Sharpe on this dataframe” — has no concept of out-of-sample, of economic prior, or of regime. An agent with code execution and a permissive objective is a specification-gaming machine, and the result is the alpha-research equivalent of a model that achieves 99% accuracy on MNIST by memorising the test set.

This is a textbook case of the failure modes formalised in Amodei et al. [3]: reward hacking when the objective is misspecified, distributional shift between training and deployment regimes, and absence of scalable supervision when the supervisor is the same LLM doing the optimisation. The lesson is that the single-agent, single-objective loop is the wrong abstraction. Quant research has more than one objective, and the objectives are partly adversarial.

3. The architecture: separated roles, instrumented handoffs

The setup that has worked for me has four roles, each instantiated as a separate LLM call with its own system prompt, tool access, and — importantly — its own context window. They communicate via a structured research-log database rather than by sharing memory directly.

Proposer. Reads recent literature and the current research log, and emits a single falsifiable hypothesis in a fixed schema: economic claim, dependent variable, predictor(s), sample, null. No code. Read access to a curated paper corpus and to the research log; no access to price data. Forcing the hypothesis through a schema is the single most important constraint in the whole stack — it makes “interesting-sounding but unfalsifiable” outputs impossible.

Implementer. Takes a single approved hypothesis and produces a notebook that tests it. Has read access to data and write access to a sandboxed compute environment. Critically, has no access to the results of prior implementations — this prevents the agent from anchoring on prior backtest numbers and tuning the new implementation to match.

Critic. Reads only the implementer’s notebook and its output. Its prompt is to produce an adversarial list of reasons the result might be spurious: look-ahead bugs, multiple-testing inflation, regime cherry-picking, cost-model optimism, feature contamination. Outputs a checklist with severity. The Critic does not get to fix anything; it only files findings.

Replicator. Takes the Critic’s findings and the original notebook and produces a panel of robustness tests: alternative samples, alternative cost assumptions, leave-one-out by feature, and deliberate ablations of any flagged components. Outputs a single comparison table.

Replicator independence at promotion stage. For any candidate that has cleared the Critic and is being considered for the second human gate, the Replicator is not allowed to reuse the Implementer’s feature-generation code. It receives only the hypothesis schema and a frozen data contract, and reimplements the signal independently. This turns the Replicator from a robustness-script generator into a genuine independent check, and catches at least one class of bug — silent feature-construction errors — that the Critic structurally cannot detect from reading the Implementer’s notebook alone.

The human (me) sits as a gate at two points: between Proposer and Implementer (does this hypothesis deserve compute?) and between Replicator and “promotion to candidate” (is the robustness panel convincing?). Everything in between runs without supervision.

What this is, and what it is not. The stack is autonomous only inside pre-specified rails. It is a controlled batch pipeline with LLM modules, not an autonomous research scientist. It does not choose its own data permissions, change its own validation criteria, redefine the promotion threshold, or promote its own results. That is by design — and it is the design feature that separates this from the “AI hedge fund” pitch. The fully autonomous research agent is, as far as I can tell, not yet a viable target; what is a viable target is making each non-judgment step of the research pipeline an order of magnitude cheaper, while leaving the judgment steps untouched.

The key invariant is that no role sees its own prior outputs as ground truth. Each handoff is a fresh context with the schema-typed artifact and nothing else. This is what kills the most common failure mode of single-agent loops, which is that the agent quietly accumulates evidence in favour of its earlier guesses.

Schematically:

                   ┌──────────────────────┐
                  │ Research-log DB     │
                  │ (typed artifacts)   │
                  └─────────┬────────────┘
                            │
  ┌─────────┐   hypothesis │   notebook   ┌────────┐
  │Proposer ├───────────────┴──────────────┤Impl.   │
  └────┬────┘           ▲                 └───┬────┘
      │                 │                     │
    human gate           │                     │
      │                 │   findings         ▼
      │             ┌───┴────┐           ┌────────┐
      └────────────►│Critic │◄──────────┤notebook│
                    └───┬────┘           │+ output│
                        │               └────────┘
                      robustness
                        ▼
                    ┌──────────┐
                    │Replicator│──► comparison table ──► human gate
                    └──────────┘

4. The objective function, written down

It is worth being explicit about what the system as a whole is optimising. A single Sharpe number is not it. The composite I use is:

U \;=\; \mathrm{IR}_{\text{oos}} \;-\; \lambda_1 \,\big|\mathrm{IR}_{\text{is}} – \mathrm{IR}_{\text{oos}}\big| \;-\; \lambda_2 \, k_{\text{eff}} \;-\; \lambda_3 \, S_{\text{tc}} \;-\; \lambda_4 \log\!\big(1 + N_{\text{trials}}\big) \;-\; \lambda_5 \, C_{\text{frag}}

Term by term:

  • Out-of-sample IR. The information ratio of the strategy on data the Implementer has not seen. The sample boundary is fixed by the Proposer in the hypothesis schema, not chosen by the Implementer.
  • Overfitting drift. The absolute gap between in-sample and out-of-sample IR. A strategy with a 2.0 in-sample IR and 0.4 out-of-sample IR is worse than one at 0.9 / 0.7. The penalty weight is calibrated ex ante and frozen before any candidate is evaluated.
  • Effective parameters, k-eff. A degrees-of-freedom proxy that counts lookback choices, thresholds, feature inclusions, regime switches, and any other knob whose value was set after seeing data. The count is generated by the Implementer at submission time as part of the notebook schema, not estimated post hoc. A strategy with three tuned knobs is preferred over an empirically-equal strategy with eleven.
  • Transaction-cost sensitivity, S-tc. The slope of net returns with respect to a 1 bp shift in assumed cost. A strategy that goes from a 0.8 IR at 2 bps assumed cost to 0.0 at 3 bps is fragile to a part of the world we do not know well, and the objective should say so.
  • Search-intensity penalty. A logarithmic penalty in the effective number of trials the stack has run on related hypotheses in the same workstream. This is the term that explicitly links the objective to the multiple-testing literature: White’s Reality Check [4] on data-snooping, Bailey, Borwein, López de Prado and Zhu [5] on the probability of backtest overfitting (which gives a usable Deflated Sharpe Ratio formulation), and Harvey, Liu and Zhu [6] on inflated significance in factor research. Without it, an agentic stack that runs 38 hypotheses in 12 weeks will mechanically look better than a human who runs 11, even when the marginal hypothesis is no better — exactly the dynamic those papers warn against. The effective trial count is incremented every time the Implementer commits a notebook touching the same dependent variable, regardless of whether the result is positive.
  • Fragility penalty, C-frag. Captures dependence on one date range, one currency, one regime, one cost assumption, or one feature family. Computed as the maximum proportional loss in IR when any single such dimension is ablated. A strategy whose IR collapses when 2022 is excluded scores poorly regardless of headline performance.

The Proposer, Implementer, and Critic all see this composite. The Implementer is not told to maximise it — that would re-introduce the specification-gaming problem. It is told to test the hypothesis. The composite is used by the Critic to flag any result where any term contributes negatively beyond a fixed threshold, and by the human gate to compare candidates.

This is the same idea that underlies penalised regression: you write your taste explicitly into the objective rather than relying on the optimiser to share it. The λ weights are not magic; they are chosen so that — on a held-out historical set of strategies whose ex-post five-year outcomes are known — the ranking produced by U correlates with realised forward performance. The calibration is done once, before any candidate from the current workstream is evaluated, and is not re-tuned during the run.

5. The tooling, concretely

For practitioners who want to assemble something equivalent, the components I am using:

  • LLM: Claude Opus for Proposer and Critic (better at synthesis, more skeptical reading); Claude Sonnet for Implementer and Replicator (faster, sufficient for code). All calls go through the standard Anthropic SDK with prompt caching on the role system prompts — this matters for cost, since the role prompts are long and reused on every turn.
  • Execution sandbox: a pinned Docker image with pandas, numpy, statsmodels, scikit-learn, and a vendored copy of the data layer. No network. The sandbox is rebuilt nightly to keep dependencies fresh; the image hash is stored in every research-log entry so any result is exactly reproducible.
  • Research-log DB: SQLite with five tables — hypotheses, implementations, results, critiques, robustness. Every artifact has a UUID, a parent UUID, a timestamp, the image hash of the sandbox at the time, and the git commit of the data layer. This is the single most-valuable component and the one most people skip.
  • Data layer: a thin wrapper over the price store that enforces point-in-time correctness by construction. Any access by date t can only return data available at or before t. The wrapper raises if asked for anything later. This single guardrail prevents the most common look-ahead bug.
  • Human-gate UI: a tiny Streamlit app that surfaces (hypothesis, notebook, critique, robustness) as a single page with approve / reject / send-back-with-comment buttons. The friction here matters; if the gate is cumbersome you start waving things through.

A simplified version of the Proposer call, just to make it concrete:

# proposer.py
import anthropic, json
from research_log import recent_hypotheses, recent_critiques
​
client = anthropic.Anthropic()
​
SYSTEM = """You are the Proposer in a four-role alpha-research loop.
You produce ONE testable hypothesis in the schema below. You do not
write code. You do not run backtests. You do not propose hypotheses
that have been tested in the last 60 days (see prior list).
​
Schema (JSON):
{
"economic_claim":     str,   # one sentence, mechanism stated
"dependent_variable": str,   # what we're trying to predict
"predictor":           str,   # the signal, defined precisely
"sample":             str,   # universe + date range, including OOS
"null":               str   # what would falsify the claim
}
​
Rejection criteria you must apply to your own output before emitting:
- If the mechanism is "factor X has predicted Y" with no economic
story, reject and try again.
- If the predictor's definition references information that would
not have been available at decision time, reject and try again.
- If the sample omits a regime the claim should hold in, reject
and try again.
"""
​
def propose(literature_excerpts: list[str]) -> dict:
   user_msg = {
       "recent_hypotheses": recent_hypotheses(days=60),
       "recent_critiques":  recent_critiques(days=60),
       "literature":        literature_excerpts,
  }
   resp = client.messages.create(
       model="claude-opus-4-7",
       system=[{"type": "text", "text": SYSTEM,
                "cache_control": {"type": "ephemeral"}}],
       max_tokens=1024,
       messages=[{"role": "user",
                  "content": json.dumps(user_msg)}],
  )
   return json.loads(resp.content[0].text)

The Critic and Replicator are structurally similar — different system prompts, different tool access, same JSON-in / JSON-out discipline. The full set of prompts is on my GitHub; I will not paste all four here because the post would double in length and the prompts are not the load-bearing piece.

6. Validating the Critic

The Critic is a control on the rest of the pipeline. A reader is entitled to ask how I know it works, since using one LLM to validate another LLM’s output is exactly the circularity Amodei et al. [3] flag under scalable supervision.

The answer is a small but explicit validation suite. I seeded 25 notebooks with known defects across six categories: one-step look-ahead in a feature, sample-boundary drift, omitted transaction cost, regime cherry-picking, an unstable to-be-tuned parameter, and silent feature-name collision. Each defect was injected at a severity calibrated to a plausible human error, not an obvious one. The Critic was run blind on each notebook, alongside 25 syntactically-similar clean controls.

Defect classSeededCaughtMissedFalse positives (on clean controls)
Look-ahead5500
Sample-boundary drift5411
Cost omission5500
Regime cherry-picking5322
Unstable parameter3211
Feature-name collision2110
Total252054

An 80% catch rate on its own is not good enough — five missed severe defects across 25 notebooks would, if unaddressed, ship five strategies built on broken foundations. That is why the point-in-time data wrapper, the Implementer’s feature-schema requirement, the Replicator’s independent reimplementation, and the human gate exist alongside the Critic. Each catches a different defect class, and the failures are largely uncorrelated. The validation exercise is repeated whenever the Critic’s prompt is materially changed.

Two caveats. First, this exercise probably understates real-world false-positive rates, because syntactically-clean controls do not have the idiosyncrasies of real notebooks. Second, it does not test the most dangerous failure mode (confidently wrong synthesis); that is governed by the quote-the-cell-output constraint discussed in §8.

7. What it changed: 12 weeks on FX carry

Before the numbers, the operational definition of “promoted to candidate” — the endpoint that does the work in the table below. A candidate is a strategy that has cleared all of the following gates:

  1. Positive net-of-cost out-of-sample IR over the full Proposer-defined sample.
  2. No unresolved severe finding from the Critic (severity-1 issues must be fixed and re-run; severity-2 issues must be explicitly waived in writing with reasoning).
  3. Stable sign of IR in at least six of the eight rows of the Replicator’s robustness panel.
  4. No single regime contributes more than 40% of total backtest P&L.
  5. Independent reimplementation by the Replicator (see §3) produces an IR within ±15% of the original.
  6. A human-written one-paragraph economic rationale that the candidate’s mechanism is plausible, written before viewing the final composite-U score.

A candidate is not a deployed strategy. It is a strategy that has earned the right to a further month of paper trading and live-data review before being considered for any risk allocation. In the period under discussion, neither of the two candidates has yet been promoted to risk; that is a separate decision on a separate timescale.

I ran this stack against an FX-carry research workstream from late January through mid-April 2026, alongside a personal baseline of comparable hours from the equivalent period in 2025. The work was on conditional carry — under what regimes does the standard high-minus-low carry portfolio in G10 actually pay, and can we identify the regime ex ante.

MetricBaseline (2025)Agentic stack (2026)Ratio
Hypotheses formally tested11383.5×
Time from hypothesis to first backtest~2 days~3 hours~5×
Hypotheses that survived Criticn/a14 of 38 (37%)—
Survived robustness paneln/a4 of 14 (29%)—
Promoted to candidate (human gate)122×
Researcher hours / week~22~180.8×
API spend / week (USD)~0~$340—
Sandbox compute / week (USD)~$15~$251.7×

Measurement caveats. The comparison is not a randomised productivity experiment. It is a within-person case study with obvious confounds: different calendar periods, different available frontier models, possible learning effects on my part, a different specific workstream, and a subjective promotion threshold (whose criteria are at least now written down). I report it because the direction and magnitude were large enough to matter operationally, not because it proves a general law about agentic research productivity. The 2× candidate-yield figure should be read as an order of magnitude, not a point estimate; if the same exercise produces a 1.4× or 3× result on a different workstream, I would not be surprised. The cost figures above are included so a reader can judge total spend, not just throughput — a 2× lift at 10× spend is a different proposition from 2× at 1.2×.

What the stack visibly bought me, beyond raw throughput:

  • More diverse hypotheses. With a low cost per hypothesis I tested several that I would normally have ruled out at the back-of-the-envelope stage. One of the two promoted candidates came from this bucket.
  • Better robustness coverage. The Replicator runs the same eight-row sensitivity panel on every survivor. I almost never did this by hand for marginal-looking ideas; now it is free.
  • Better research log. I have a typed, searchable record of 38 hypotheses, their results, their critiques, and the exact code. The log itself has caught two cases where I started to re-propose something I had already rejected.

What it did not buy me:

  • Better economic intuition. The Proposer’s hypotheses are competent but unsurprising; they correspond closely to what a thoughtful junior would produce. The novel angle in one of the two promoted candidates came from a conversation I had at a conference, not from the stack.
  • Faster judgment at the human gate. The gate took roughly the same time per candidate as before — perhaps slightly longer, because I was reviewing better-documented work.

The first of these is, I think, fundamental to the current generation of models. The second is fine — judgment should be slow.

8. Failure modes I actually saw

Three of these came up repeatedly enough to deserve naming.

Plausible-feature contamination. The Implementer would invent a feature, name it something innocuous like carry_zscore_lookback, and quietly construct it using a rolling window that included the contemporaneous observation. The Critic caught most of these. The point-in-time data wrapper caught the rest. Without both layers, I would have shipped at least one of these.

Backtest period drift. The Implementer, given freedom over the sample, would sometimes anchor the start date a few months after a known drawdown. Never the full move — that would have been obvious — but enough to materially flatter the result. The fix was to require the Proposer to fix the sample as part of the hypothesis schema, and to have the Critic flag any deviation. After this change the failure stopped.

Confident wrong synthesis. The Critic, on long notebooks, would occasionally produce a confident-sounding summary that contradicted the actual numbers in the notebook. This is the single failure mode that scared me most, because it is the hardest to catch by glance. The mitigation is to require the Critic to quote specific cell outputs verbatim in its findings, with line references. After that change, hallucinated summaries dropped to roughly zero — the constraint of having to cite a concrete output is, empirically, enough to keep the model honest.

I do not claim these are the only failure modes. They are the ones that showed up at a rate I could measure.

9. What this means in practice

If you take only one thing from this post, take this: the value of agentic workflows in quant research is mostly in the structure, not the models. The exact LLM matters at the margin. The role separation, the typed handoffs, the research log, the point-in-time data wrapper, the search-intensity term in the objective, and the human gate at the right two points — those are what convert raw model capability into research that actually deserves to be looked at twice.

The fully autonomous research agent — Proposer to deployed strategy with no human in the loop — is, as far as I can tell, not yet a viable target. The judgment step is where the value-add of the senior researcher lives, and the current generation of models is not close to substituting for it. They are close enough to substitute for the work that surrounds it, and that is a meaningful change.

What I would do if I were standing up this stack from scratch, in order:

  1. Build the point-in-time data wrapper first. Everything downstream depends on it.
  2. Build the research-log DB second. Typed artifacts are the single biggest determinant of quality.
  3. Write the Proposer / Implementer / Critic / Replicator prompts third. Iterate them against your own taste; expect to rewrite them three times.
  4. Build the Critic validation suite fourth — before relying on the Critic as a control. If you cannot measure its catch rate, you do not know what it is doing.
  5. Build the human-gate UI last, and make it pleasant to use. If the gate is cumbersome, you will start waving things through, and the whole system collapses.

The repository accompanying this post — prompts, sandbox image, log schema, gate UI, and the seeded-defect notebook set — is at the usual place. As always, the system is set up so you can run the entire loop against the free FRED and AlphaVantage data tiers; you do not need to subscribe to anything to reproduce the structural conclusions, only the FX-carry specifics.


References

[1] Wu, Q. et al. (2023). “AutoGen: Enabling Next-Gen LLM Applications via Multi-Agent Conversation.” arXiv:2308.08155.

[2] Hong, S. et al. (2023). “MetaGPT: Meta Programming for a Multi-Agent Collaborative Framework.” arXiv:2308.00352.

[3] Amodei, D., Olah, C., Steinhardt, J., Christiano, P., Schulman, J., and Mané, D. (2016). “Concrete Problems in AI Safety.” arXiv:1606.06565.

[4] White, H. (2000). “A Reality Check for Data Snooping.” Econometrica 68(5), 1097–1126.

[5] Bailey, D. H., Borwein, J., López de Prado, M., and Zhu, Q. J. (2016). “The Probability of Backtest Overfitting.” Journal of Computational Finance 20(4), 39–69.

[6] Harvey, C. R., Liu, Y., and Zhu, H. (2016). “…and the Cross-Section of Expected Returns.” Review of Financial Studies 29(1), 5–68.

Career Opportunity for Quant Traders

Career Opportunity for Quant Traders as Strategy Managers

We are looking for 3-4 traders (or trading teams) to showcase as Strategy Managers on our Algorithmic Trading Platform.  Ideally these would be systematic quant traders, since that is the focus of our fund (although they don’t have to be).  So far the platform offers a total of 10 strategies in equities, options, futures and f/x.  Five of these are run by external Strategy Managers and five are run internally.

The goal is to help Strategy Managers build a track record and gain traction with a potential audience of over 100,000 members.  After a period of 6-12 months we will offer successful managers a position as a PM at Systematic Strategies and offer their strategies in our quantitative hedge fund.  Alternatively, we will assist the manager is raising external capital in order to establish their own fund.

If you are interested in the possibility (or know a talented rising star who might be), details are given below.

Manager Platform

New Algotrading Platform

Fig1


Systematic Strategies is pleased to announce the launch of its new Algo Trading Platform.  This will allow subscribers to follow a selection of our best strategies in equities, futures and options, for a low monthly subscription fee.

There is no minimum account size, and accounts of up to $250,000 can be traded on the platform.

The strategies are fully systematic and trades are executed automatically in your existing brokerage account, or you can open an account at one of our supported brokers, which include  Interactive Brokers, NinjaTrader, CQG, Gain Capital, AMP, Garwood, and many others.


Fig2


Find Strategies

Short LineFig3


Find Strategies


Short Line

FAQ1 FAQ2


More


Short Line

SYSTEMATIC STRATEGIES LLC

Systematic Strategies is an alternative investments firm utilizing quantitative modeling techniques to develop profitable trading strategies for deployment into global markets. Systematic Strategies seeks qualified investors as defined in Regulation D of the Securities Act of 1933. For information please contact us at info@ systematic-strategies.com or visit www.systematic-strategies.com.


RISK DISCLOSURE

This web site and the information contained herein is not and must not be construed as an offer to sell securities. Certain statements included in this web site, including, without limitation, statements regarding investment goals, strategies, and statements as to the manager’s expectations or opinions are forward-looking statements within the meaning of Section 27A of the Securities Act of 1933 (the “Securities Act”) and Section 21E of the Securities Exchange Act of 1944 (the “Exchange Act”) and are subject to risks and uncertainties. The factors discussed herein could cause actual results and development to be materially different from those expressed in or implied by such forward-looking statements. Accordingly, the information in this web site cannot be construed as to be guaranteed.

Algorithmic Trading on Collective 2


Regular readers will recall my mentioning out VIX Futures scalping strategy which we ran on the Collective2 site for a while:


VIX HFT Scalper


The strategy, while performing very well, proved difficult for subscribers to implement, given the latencies involved in routing orders via the Collective 2 web site.  So we began thinking about slower strategies that investors could follow more easily, placing less reliance on the fill rate for limit orders.

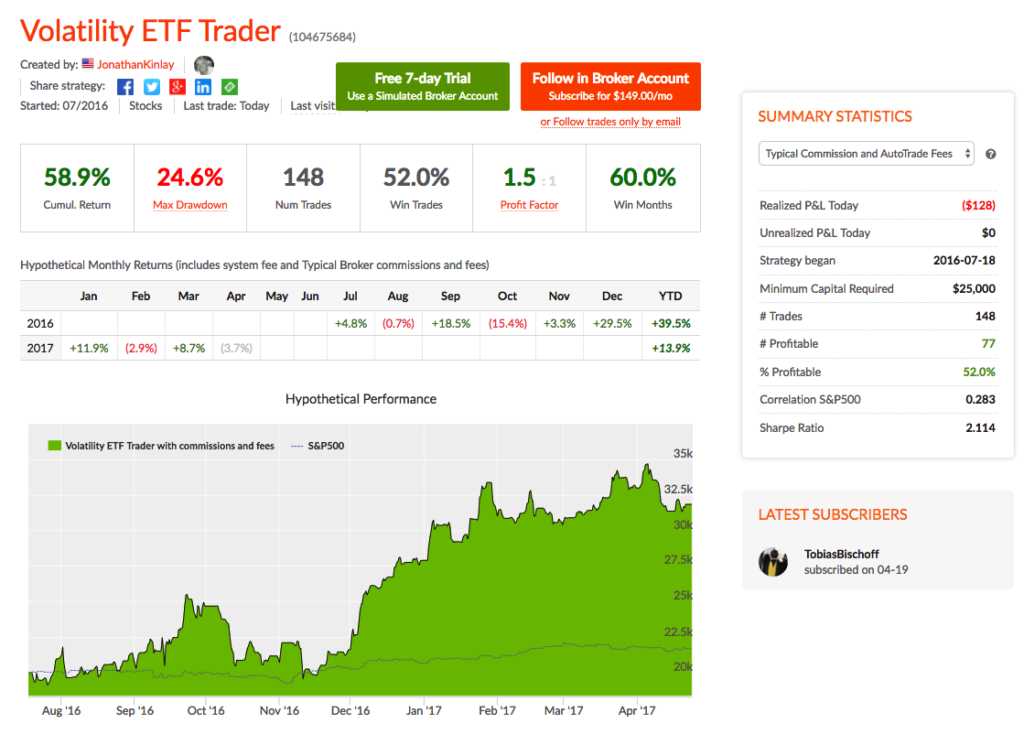
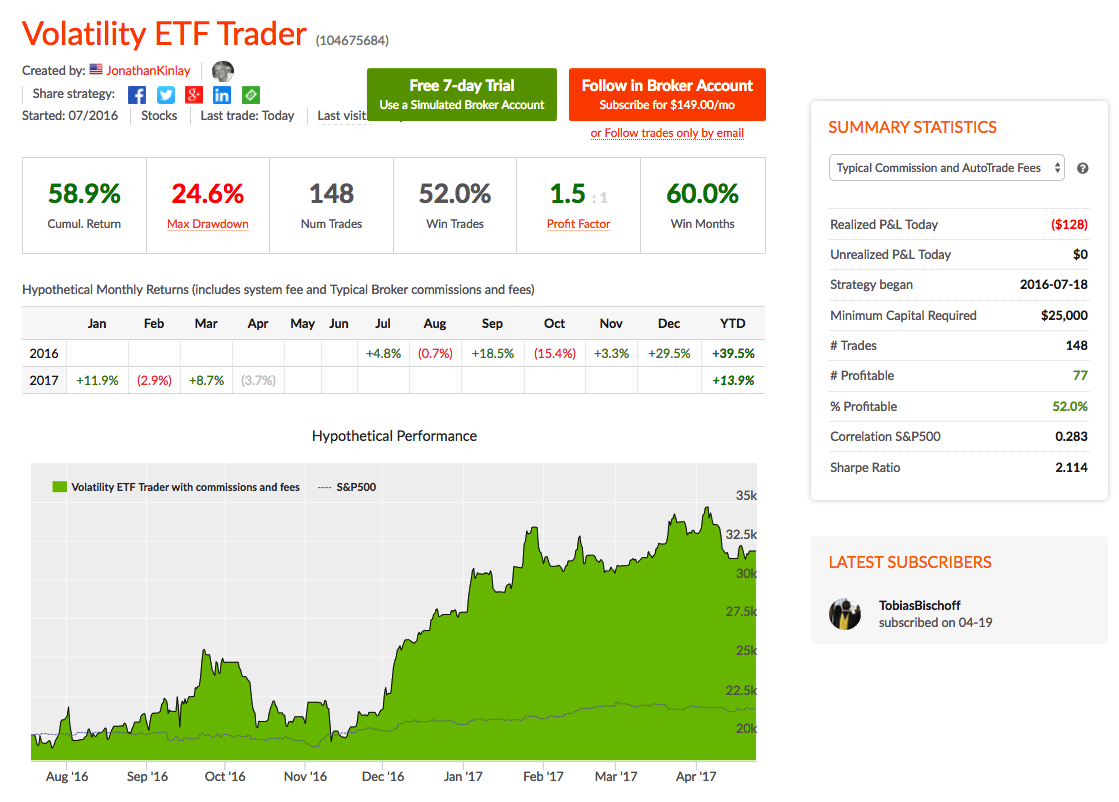
Our VIX ETF Trader strategy has been running on Collective 2 for several months now and is being traded successfully by several subscribers.  The performance so far has been quite good, with net returns of 58.9% from July 2016 and a Sharpe ratio over 2, which is not at all bad for a low frequency strategy.  The strategy enters and exits using a mix of  limit and stop orders, so although some slippage is incurred the trade entries and exits work much more smoothly overall.

Having let the strategy settle for several months trading only the ProShares Short VIX Short-Term Futures ETF (SVXY)we are now ready to ramp things up.  From today the strategy will also trade several other VIX ETF products including the VelocityShares Daily Inverse VIX ST ETN (XIV), ProShares Ultra VIX Short-Term Futures (UVXY) and VelocityShares Daily 2x VIX ST ETN (TVIX).  All of the trades in these products are entered and exited using market or stop orders, and so will be easy for subscribers to follow.  For now we are keeping the required account size pegged at $25,000 although we will review that going forward.  My guess is that a capital allocation should be more than sufficient to trade the product in the kind of size we use on the Collective 2 versions of the strategies, especially if the account uses portfolio margin rather than standard Reg-T.

With the addition of the new products to the portfolio mix, we anticipate the strategy Sharpe ratio with rise to over 3 in the year ahead.


VIX ETF Strategy


The advantage of using a site like Collective 2 from the investor’s viewpoint is that, firstly, you get to see a lot of different trading styles and investment strategies.  You can select the strategies in a wide range of asset classes that fit your own investment preferences and trade several of them live in your own brokerage account.  (Setting up your account for live trading is straightforward, as described on the C2 site).  A major advantage of investing this way is that it doesn’t entail the commitment of capital that is typically required for a hedge fund or managed account investment:  you can trade the strategies in much smaller size, to fit your budget.

From our perspective, we find it a useful way to showcase some of the strategies we trade in our hedge fund, so that if investors want to they can move up to more advanced, but similar investment products.  We plan to launch new strategies on Collective 2 in the near futures , including an equity portfolio strategy and a CTA futures strategy.

If you would like more information, contact us for further details.


A Primer on Genetic Programming

Posted by androidMarvin:

Genetic programming is an approach to letting the computer generate its own program code, rather than have a person write the program. It doesn’t specifically “find patterns” or rules within data structures. It starts with a number of randomly-constructed (as long as they are mathematically valid) sample programs, evaluates how close each one is to achieving what the desired result program should achieve, then steadily modifies the best matches to the desired target program in order to improve their match to the desired target; the original random attempts “evolve” towards a better match by natural selection, the best ones being selected to act as the basis for the next generation of attempts.

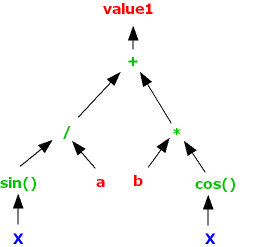
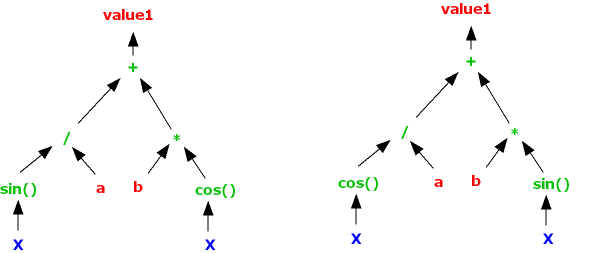
A tree representing a candidate formula could be represented as follows:

Genetic programming

It basically shows the mathematical operations that will be used in the formula, the order in which they are applied, and what values they act on. When the EL Verifier is analysing a statement like

value1 = sin( X ) / a + b * cos( X )

it has to see work out what order the parts of the statement should be evaluated in, which a person sees immediately; effectively, the Verifier constructs the tree diagram above, so that it knows that it has to generate code to make the computer :

  1. take the value of variable X and pass it through a call to the sin() functio
  2. take that result, and divide it by the value of a
  3. take the value of variable X and pass it through a call to the cos() functio
  4. take that result and multiply it by the value of variable
  5. take the result of step 2 and the result of step 4 and add the
  6. that result is the value of Y for the input value of X

SSALGOTRADING AD

Tradestation optimiser would take a single such tree, defining a fixed formula, and attempt to fit it to the data by varying the values of variables a and b. A Genetic Programming optimiser could do the same, but it also has the freedom to change the mathematical operators and the merge points in the tree, and change the shape of the tree to make the formula more or less complex as well; it can adjust both the parameters to the equation and the equation itself in order to evolve it to a better result.

For a mathematical curve fit, a GP optimiser would evaluate each individual tree by applying all the measured X values to the tree’s inputs, compare each output to the measured Y values, and sum a measure of the error over all the data; that sum would be the measure of how well the current tree matches the measure data. The “genetic” part of the name derives from the way it tries to evolve the population of trees its using to find the best.

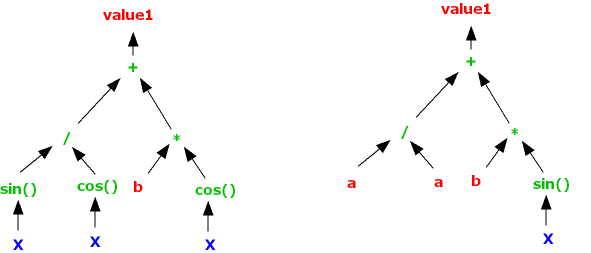
The main evolution technique is “crossover”. When two parent animals create offspring, each offspring will get part of its DNA from one parent and part from the other; improvement of the species happens if some of the offspring get DNA component combinations that suit the environment better than their parents are suited. The GP optimiser emulates this process by selecting two parent trees, and swapping a section of one of those trees with a section of tree from the other parent, to create two offspring. Eg given parent trees

GP

representing equations

value1 = sin( X )/a + b * cos( X )

and

value1 = cos( X ) / a + b * sin( X )

the offspring might be

GP

representing equations

value1 = sin( X )/cos( X ) + b * cos( X )

and

value1 = a / a + b * sin( X )

Those specific changes are unlikely to both be an improvement, but that’s the way with random processes; the changes made aren’t guided by any sort of principle, its just a case of “change something, anything, and see if its any better”.

A secondary change process that can be used is “mutation”, in which something about a single tree is simply changed, not swapped. This is intended to introduce diversity, so that if none of the current trees is a particularly good performer, there’s a chance that something radically better might be brought into the pool.

The push trying to steer the evolution towards a better result comes from deciding which parents are allowed to create offspring. The original idea was that all the current trees were ranked in sorted order of their fitness, the worst ones were removed from the population to be replaced by new offspring, amd the trees that were the best performing are selected to be parents – so the weak die, and the strongest breed, hoping their offspring will be at least as good as the parents.

One reservation I have about a product like Adaptrade Builder is that it doesn’t follow this original pattern. It chooses “a few” (2 by default) trees to be considered as parents, by entering a “tournament” and the best tree in the tournament is selected as a parent. This seems to me to reduce the bias towards breeding strength with strength, but I’m no expert.

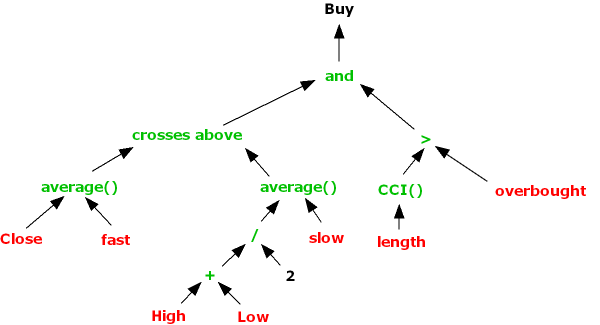
Rather than being simply mathematical, Builder seems to generate tests for entry and exit orders. It takes arithmetic and comparison operators for granted, and allows trees to be built from technical indicators rather than mathematical functions like sin() and cos(). So where an EL programmer might write

if average( Close, fast ) crosses above Average( ( High + Low )/2, slow ) and CCI( length ) > overbought then buy

Builder would have a tree

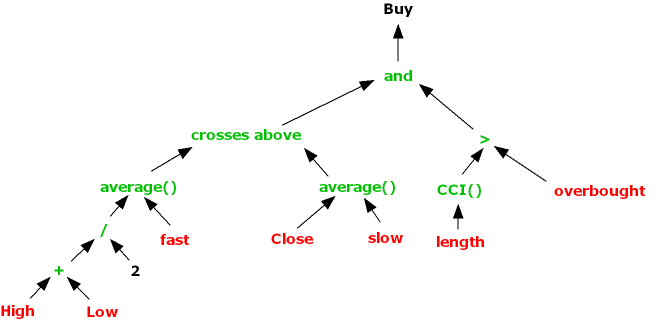
Genetic programming

from which an offspring might be generated as :

Genetic programming

to use a Buy test

if average( ( High + Low )/2, fast ) crosses above Average( Close, slow ) and CCI( length ) > overbought then buy

The structure of the test to go long has changed, but in a random rather than the guided way a human might do when trying to develop a strategy.