In a previous post I looked at ways of modeling the relationship between the CBOE VIX Index and the Year 1 and Year 2 CBOE Correlation Indices:
http://jonathankinlay.com/2017/08/modeling-volatility-correlation/
The question was put to me whether the VIX and correlation indices might be cointegrated.
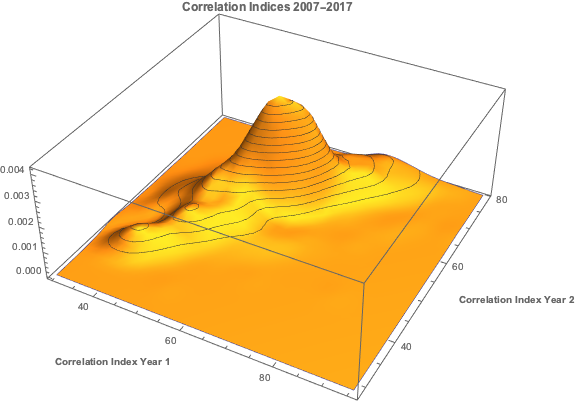
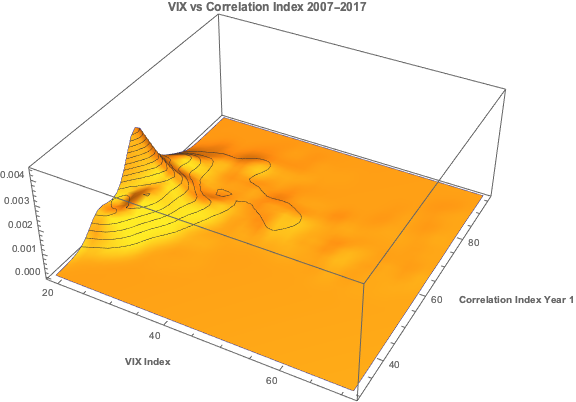
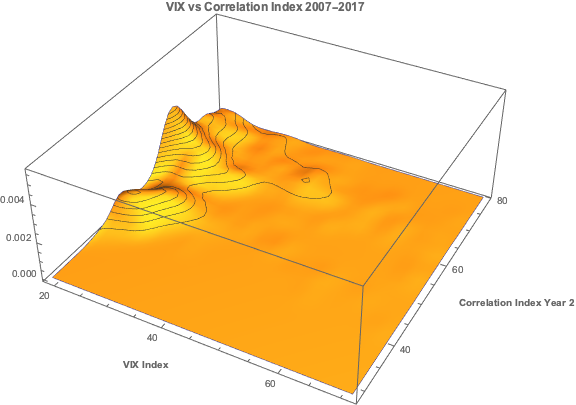
Let’s begin by looking at the pattern of correlation between the three indices:

If you recall from my previous post, we were able to fit a linear regression model with the Year 1 and Year 2 Correlation Indices that accounts for around 50% in the variation in the VIX index. While the model certainly has its shortcomings, as explained in the post, it will serve the purpose of demonstrating that the three series are cointegrated. The standard Dickey-Fuller test rejects the null hypothesis of a unit root in the residuals of the linear model, confirming that the three series are cointegrated, order 1.


Vector Autoregression
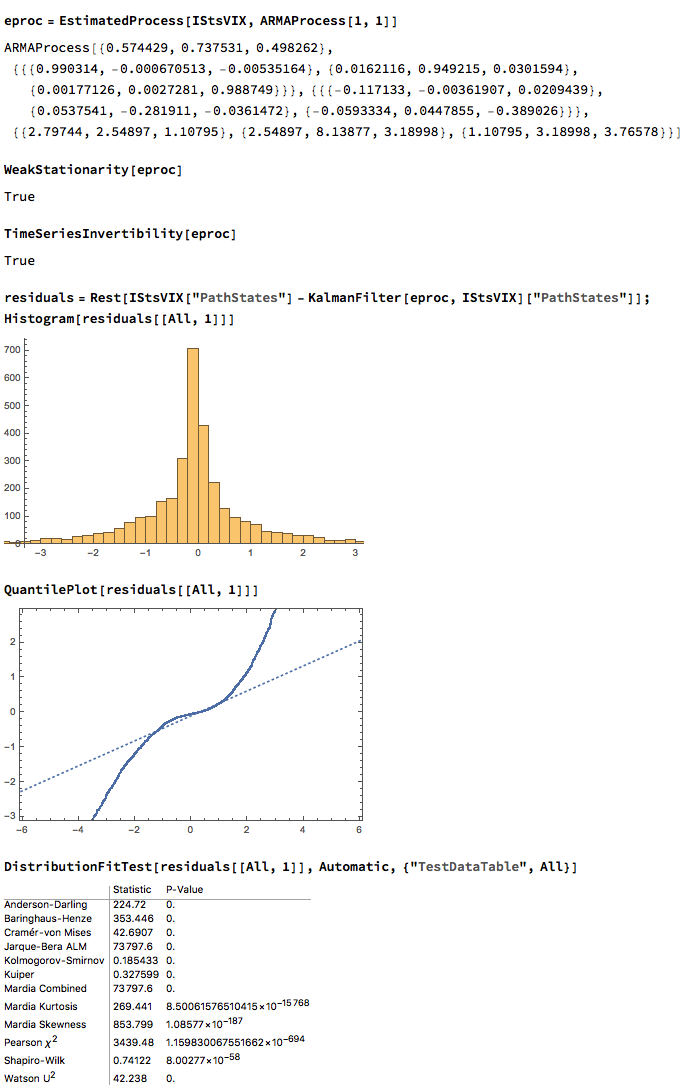
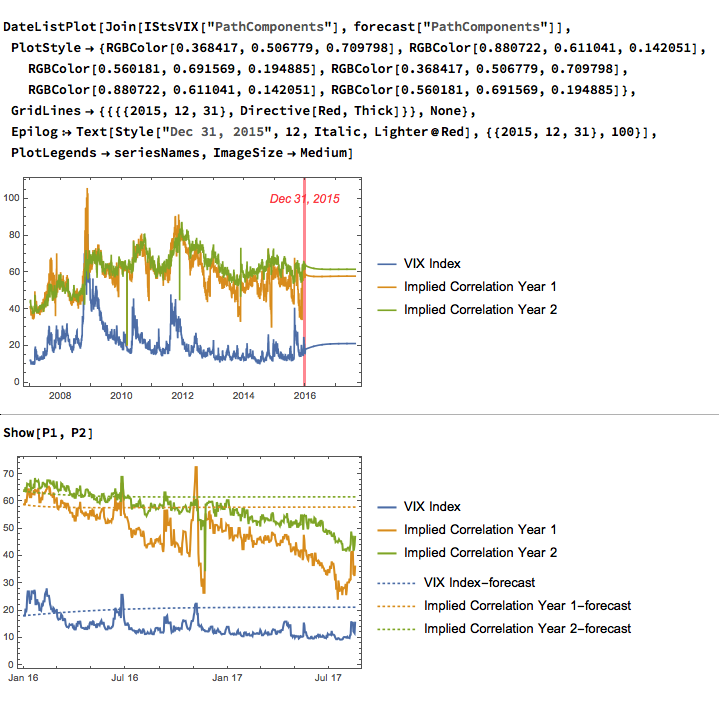
We can attempt to take the modeling a little further by fitting a VAR model. We begin by splitting the data into an in-sample period from Jan 2007 to Dec 2015 and an out-of-sample test period from Jan 2016 to Aug 2017. We then fit a vector autoregression model to the in-sample data:
When we examine how the model performs on the out-of-sample data, we find that it fails to pick up on much of the variation in the series – the forecasts are fairly flat and provide quite poor predictions of the trends in the three series over the period from 2016-2017:
Conclusion
The VIX and Correlation Indices are not only highly correlated, but also cointegrated, in the sense that a linear combination of the series is stationary.
One can fit a weakly stationary VAR process model to the three series, but the fit is quite poor and forecasts from the model don’t appear to add much value. It is conceivable that a more comprehensive model involving longer lags would improve forecasting performance.