Trading Market Sentiment

Text and sentiment analysis has become a very popular topic in quantitative research over the last decade, with applications ranging from market research and political science, to e-commerce.  In this post I am going to outline an approach to the subject, together with some core techniques, that have applications in investment strategy.

In the early days of the developing field of market sentiment analysis, the supply of machine readable content was limited to mainstream providers of financial news such as Reuters or Bloomberg. Over time this has changed with the entry of new competitors in the provision of machine readable news, including, for example, Ravenpack or more recent arrivals like Accern.  Providers often seek to sell not only the raw news feed service, but also their own proprietary sentiment indicators that are claimed to provide additional insight into how individual stocks, market sectors, or the overall market are likely to react to news.  There is now what appears to be a cottage industry producing white papers seeking to demonstrate the value of these services, often accompanied by some impressive pro-forma performance statistics for the accompanying strategies, which include long-only, long/short, market neutral and statistical arbitrage.

For the purpose of demonstration I intend to forego the blandishments of these services, although many are no doubt are excellent, since the reader is perhaps unlikely to have access to them.  Instead, in what follows I will focus on a single news source, albeit a highly regarded one:  the Wall Street Journal.  This is, of course, a simplification intended for illustrative purposes only – in practice one would need to use a wide variety of news sources and perhaps subscribe to a machine readable news feed service.  But similar principles and techniques can be applied to any number of news feeds or online sites.

SSALGOTRADING AD

The WSJ News Archive

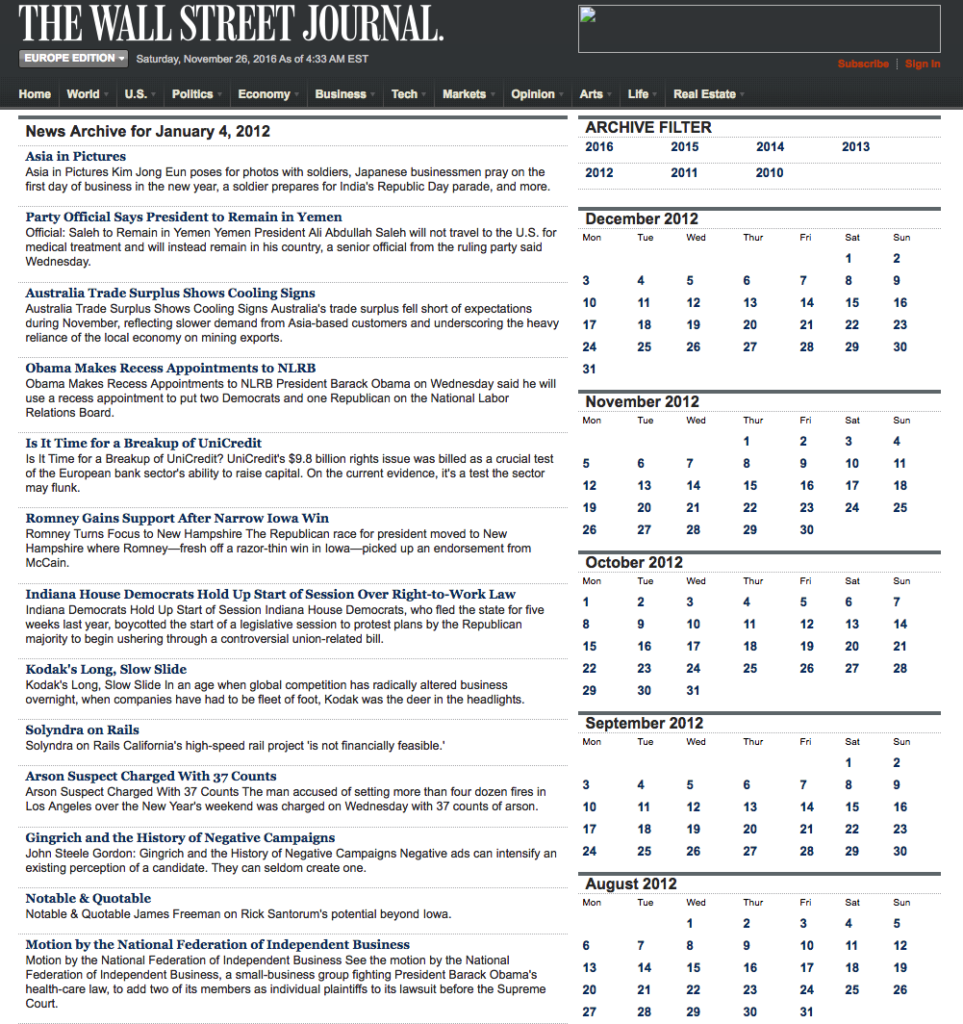
We are going to access the Journal’s online archive, which presents daily news items in a convenient summary format, an example of which is shown below. The archive runs from the beginning of 2012 through to the current day, providing ample data for analysis.  In what follows, I am going to make two important assumptions, neither of which is likely to be 100% accurate – but which will not detract too much from the validity of the research, I hope.  The first assumption is that the news items shown in each daily archive were reported prior to the market open at 9:30 AM.  This is likely to be true for the great majority of the stories, but there are no doubt important exceptions.  Since we intend to treat the news content of each archive as antecedent to the market action during the corresponding trading session, exceptions are likely to introduce an element of look-ahead bias.  The second assumption is that the archive for each day is shown in the form in which it would have appeared on the day in question.  In reality, there are likely to have been revisions to some of the stories made subsequent to their initial publication. So, here too, we must allow for the possibility of look-ahead bias in the ensuing analysis.

fig1


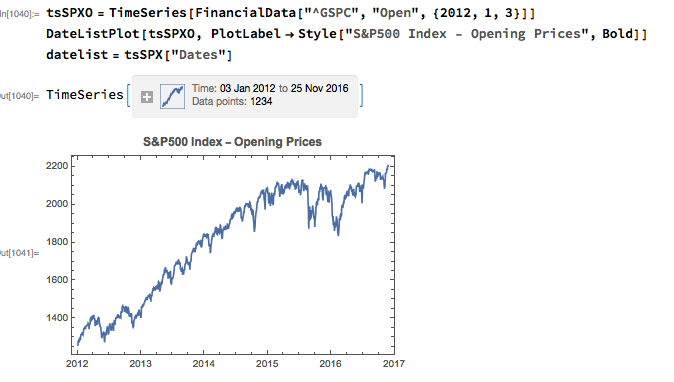
With those caveats out of the way, let’s proceed.  We are going to be using broad market data for the S&P 500 index in the analysis to follow, so the first step is to download daily price series for the index.  Note that we begin with daily opening prices, since we intend to illustrate the application of news sentiment analysis with a theoretical day-trading strategy that takes positions at the start of each trading session, exiting at market close.

fig2

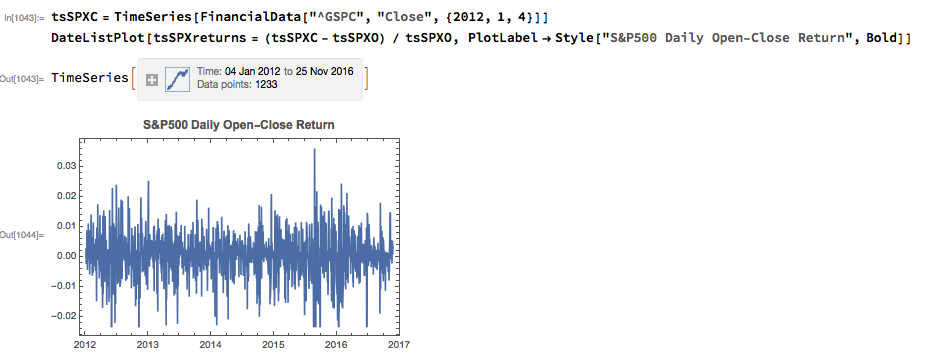
From there we calculate the intraday return in the index, from market open to close, as follows:

fig3

Text Analysis & Classification

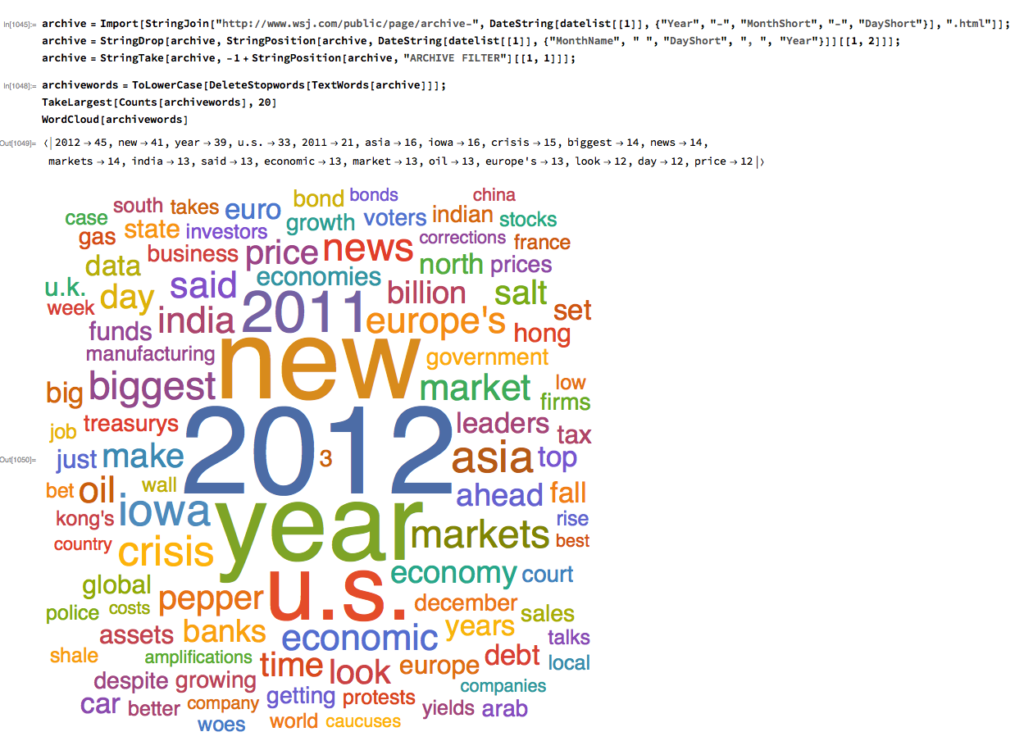
Next we turn to the task of reading the news archive and categorizing its content.  Mathematica makes the importation of html pages very straightforward,  and we can easily crop the raw text string to exclude page headers and footers.  The approach I am going to take is to derive a sentiment indicator based on an analysis of the sentiment of each word in the daily archive.  Before we can do that we must first convert the text into individuals words, stripping out standard stop-words such as “the” and “in” and converting all the text to lower case.  Naturally one can take this pre-processing a great deal further, by identifying and separating out proper nouns, for example.  Once the text processing stage is complete we can quickly summarize the content, for example by looking at the most common words, or by representing the entire archive in the form of a word cloud.  Given that we are using the archive for the first business day of 2012, it is perhaps unsurprising that we find that “2012”, “new” and “year” feature so prominently!

fig4


The subject of sentiment analysis is a complex one and I only touch on it here.  For those interested in the subject I can recommend The Text Mining Handbook, by Feldman and Sanger, which is a standard work on the topic.  Here I am going to employ a machine learning classifier provided with Mathematica 11.  It is not terribly sophisticated (or, at least, has not been developed with financial applications especially in mind), but will serve for the purposes of this article.  For those unfamiliar with the functionality, the operation of the sentiment classification algorithm is straightforward enough.  For instance:

fig5

We apply the algorithm to classify each word in the daily news archive and arrive at a sentiment indicator based on the proportion of words that are classified as “positive”.  The sentiment reading for the archive for Jan-3, 2012, for example, turns out to be 67.4%:

fig6

Sentiment Index Analytics

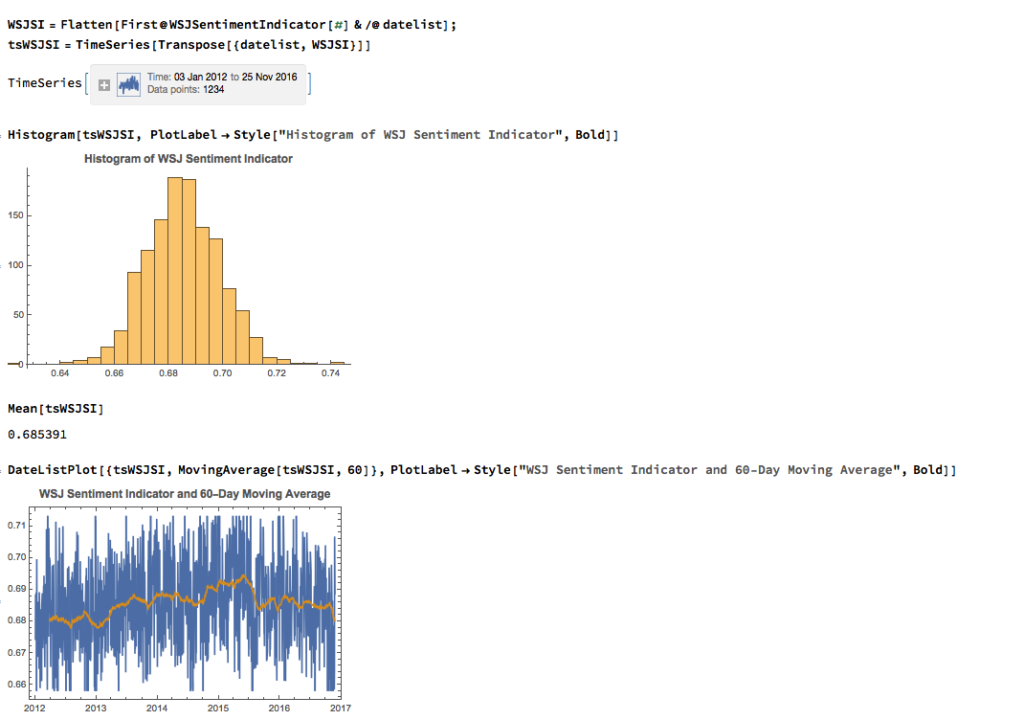
We can automate the process of classifying the entire WSJ archive with just a few lines of code, producing a time series for the daily sentiment indicator, which has an average daily value of  68.5%  – the WSJ crowd tends to be bullish, clearly!  Note how the 60-day moving average of the indicator rises steadily over the period from 2012 through Q1 2015, then abruptly reverses direction, declining steadily thereafter – even somewhat precipitously towards the end of 2016.

fig7


fig8

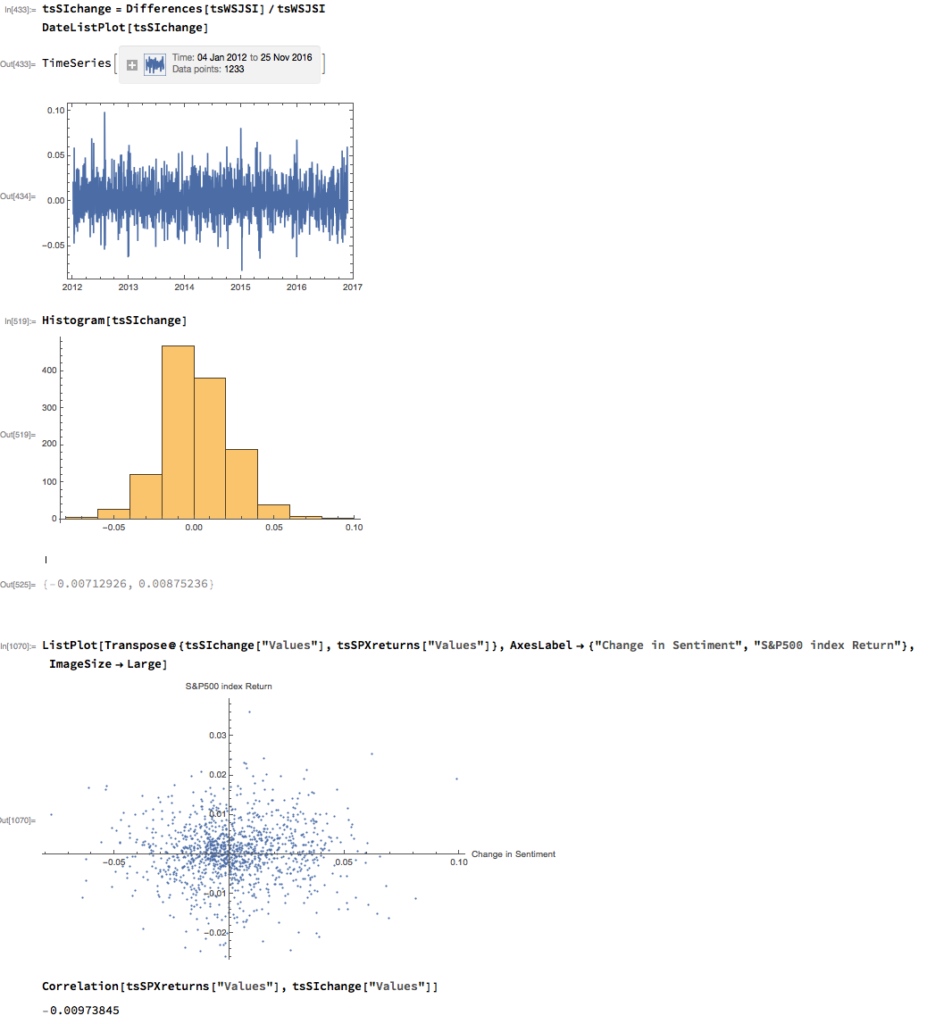
As with most data series in investment research, we are less interested in the level of a variable, such as a stock price, than we are in the changes in level.   So the next step is to calculate the daily percentage change in the sentiment indicator and examine the correlation with the corresponding intraday return in the S&P 500 Index.  At first glance our sentiment indicator appears to have very little predictive power  – the correlation between indicator changes and market returns is negligibly small overall – but we shall later see that this is not the last word.


fig9


Conditional Distributions

Thus far the results appear discouraging; but as is often the case with this type of analysis we need to look more closely at the conditional distribution of returns.  Specifically, we will examine the conditional distribution of S&P 500 Index returns when changes in the sentiment index are in the upper and lower quantiles of the distribution. This will enable us to isolate the impact of changes in market sentiment at times when the swings in sentiment are strongest.  In the analysis below, we begin by examining the upper and lower third of the distribution of changes in sentiment:

fig10

The analysis makes clear that the distribution of S&P 500 Index returns is very different on days when the change in market sentiment is large and positive vs. large and negative. The difference is not just limited to the first moment of the conditional distribution, where the difference in the mean return is large and statistically significant, but also in the third moment.  The much larger, negative skewness means that there is a greater likelihood of a large decline in the market on days in which there is a sizable drop in market sentiment, than on days in which sentiment significantly improves.  In other words, the influence of market sentiment changes is manifest chiefly through the mean and skewness of the conditional distributions of market returns.

A News Trading Algorithm

We can capitalize on these effects using a simple trading strategy in which we increase the capital allocated to a long-SPX position on days when market sentiment improves, while reducing exposure on days when market sentiment falls.  We increase the allocation by a factor – designated the leverage factor – on days when the change in the sentiment indicator is in the upper 1/3 of the distribution, while reducing the allocation by 1/leveragefactor on days when the change in the sentiment indicator falls in lower 1/3 of the distribution.  The allocation on other days is 100%.  The analysis runs as follows:

fig13 fig14

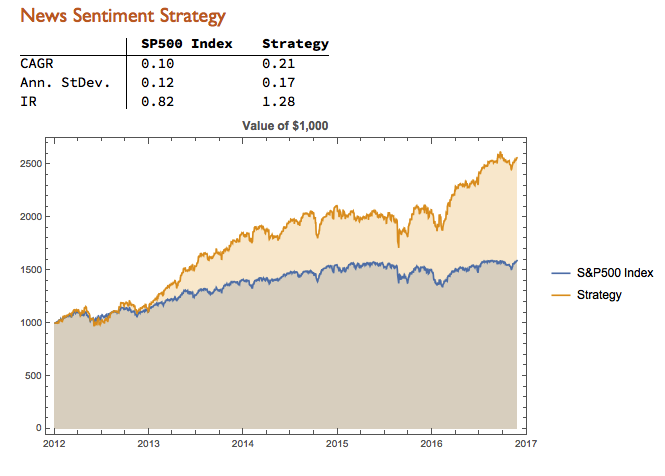
It turns out that, using a leverage factor of 2.0, we can increase the CAGR from 10% to 21% over the period from 2012-2016 using the conditional distribution approach.  This performance enhancement comes at a cost, since the annual volatility of the news sentiment strategy is 17% compared to only 12% for the long-only strategy. However, the overall net result is positive, since the risk-adjusted rate of return increases from 0.82 to 1.28.

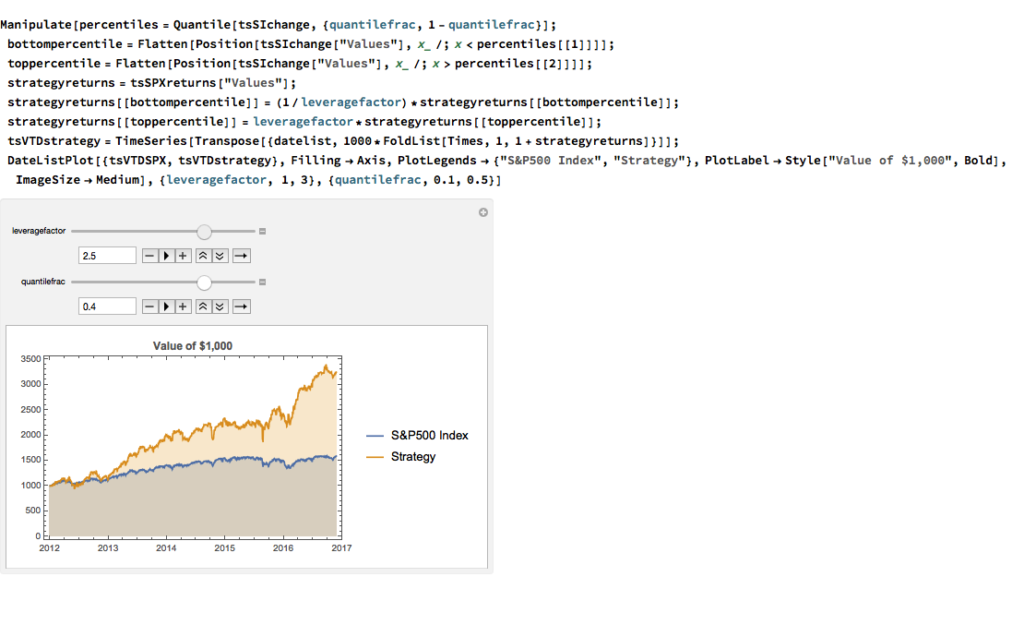
We can explore the robustness of the result, comparing different quantile selections and leverage factors using Mathematica’s interactive Manipulate function:

fig12

Conclusion

We have seen that a simple market sentiment indicator can be created quite easily from publicly available news archives, using a standard machine learning sentiment classification algorithm.  A market sentiment algorithm constructed using methods as straightforward as this appears to provide the capability to differentiate the conditional distribution of market returns on days when changes in market sentiment are significantly positive or negative.  The differences in the higher moments of the conditional distribution appears to be as significant as the differences in the mean.  In principle, we can use the insight provided by the sentiment indicator to enhance a long-only day-trading strategy, increasing leverage and allocation on days when changes to market sentiment are positive and reducing them on days when sentiment declines.  The performance enhancements resulting from this approach appear to be significant.

Several caveats apply.  The S&P 500 index is not tradable, of course, and it is not uncommon to find trading strategies that produce interesting theoretical results.  In practice one would be obliged to implement the strategy using a tradable market proxy, such as a broad market ETF or futures contract.  The strategy described here, which enters and exits positions daily, would incur substantial trading costs, that would be further exacerbated by the use of leverage.

Of course there are many other uses one can make of news data, in particular with firm-specific news and sentiment analytics, that fall outside the scope of this article.  Hopefully, however, the methodology described here will provide a sign-post towards further, more practically useful research.


High Frequency Scalping Strategies

HFT scalping strategies enjoy several highly desirable characteristics, compared to low frequency strategies.  A case in point is our scalping strategy in VIX futures, currently running on the Collective2 web site:

  • The strategy is highly profitable, with a Sharpe Ratio in excess of 9 (net of transaction costs of $14 prt)
  • Performance is consistent and reliable, being based on a large number of trades (10-20 per day)
  • The strategy has low, or negative correlation to the underlying equity and volatility indices
  • There is no overnight risk


VIX HFT Scalper


Background on HFT Scalping Strategies

The attractiveness of such strategies is undeniable.  So how does one go about developing them?

It is important for the reader to familiarize himself with some of the background to  high frequency trading in general and scalping strategies in particular.  Specifically, I would recommend reading the following blog posts:

http://jonathankinlay.com/2015/05/high-frequency-trading-strategies/

http://jonathankinlay.com/2014/05/the-mathematics-of-scalping/


Execution vs Alpha Generation in HFT Strategies

The key to understanding HFT strategies is that execution is everything.  With low frequency strategies a great deal of work goes into researching sources of alpha, often using highly sophisticated mathematical and statistical techniques to identify and separate the alpha signal from the background noise.  Strategy alpha accounts for perhaps as much as 80% of the total return in a low frequency strategy, with execution making up the remaining 20%.  It is not that execution is unimportant, but there are only so many basis points one can earn (or save) in a strategy with monthly turnover.  By contrast, a high frequency strategy is highly dependent on trade execution, which may account for 80% or more of the total return.  The algorithms that generate the strategy alpha are often very simple and may provide only the smallest of edges.  However, that very small edge, scaled up over thousands of trades, is sufficient to produce a significant return. And since the risk is spread over a large number of very small time increments, the rate of return can become eye-wateringly high on a risk-adjusted basis:  Sharpe Ratios of 10, or more, are commonly achieved with HFT strategies.

In many cases an HFT algorithm seeks to estimate the conditional probability of an uptick or downtick in the underlying, leaning on the bid or offer price accordingly.  Provided orders can be positioned towards the front of the queue to ensure an adequate fill rate, the laws of probability will do the rest.  So, in the HFT context, much effort is expended on mitigating latency and on developing techniques for establishing and maintaining priority in the limit order book.  Another major concern is to monitor order book dynamics for signs that book pressure may be moving against any open orders, so that they can be cancelled in good time, avoiding adverse selection by informed traders, or a buildup of unwanted inventory.

In a high frequency scalping strategy one is typically looking to capture an average of between 1/2 to 1 tick per trade.  For example, the VIX scalping strategy illustrated here averages around $23 per contract per trade, i.e. just under 1/2 a tick in the futures contract.  Trade entry and exit is effected using limit orders, since there is no room to accommodate slippage in a trading system that generates less than a single tick per trade, on average. As with most HFT strategies the alpha algorithms are only moderately sophisticated, and the strategy is highly dependent on achieving an acceptable fill rate (the proportion of limit orders that are executed).  The importance of achieving a high enough fill rate is clearly illustrated in the first of the two posts referenced above.  So what is an acceptable fill rate for a HFT strategy?

Fill Rates

I’m going to address the issue of fill rates by focusing on a critical subset of the problem:  fills that occur at the extreme of the bar, also known as “extreme hits”. These are limit orders whose prices coincide with the highest (in the case of a sell order) or lowest (in the case of a buy order) trade price in any bar of the price series. Limit orders at prices within the interior of the bar are necessarily filled and are therefore uncontroversial.  But limit orders at the extremities of  the bar may or may not be filled and it is therefore these orders that are the focus of attention.

By default, most retail platform backtest simulators assume that all limit orders, including extreme hits, are filled if the underlying trades there.  In other words, these systems typically assume a 100% fill rate on extreme hits.  This is highly unrealistic:  in many cases the high or low of a bar forms a turning point that the price series visits only fleetingly before reversing its recent trend, and does not revisit for a considerable time.  The first few orders at the front of the queue will be filled, but many, perhaps the majority of, orders further down the priority order will be disappointed.  If the trader is using a retail trading system rather than a HFT platform to execute his trades, his limit orders are almost always guaranteed to rest towards the back of the queue, due to the relatively high latency  of his system.  As a result, a great many of his limit orders – in particular, the extreme hits – will not be filled.

The consequences of missing a large number of trades due to unfilled limit orders are likely to be catastrophic for any HFT strategy. A simple test that is readily available  in most backtest systems is to change the underlying assumption with regard to the fill rate on extreme hits – instead of assuming that 100% of such orders are filled, the system is able to test the outcome if limit orders are filled only if the price series subsequently exceeds the limit price.  The outcome produced under this alternative scenario is typically extremely adverse, as illustrated in first blog post referenced previously.


Fig4

In reality, of course, neither assumption is reasonable:  it is unlikely that either 100% or 0% of a strategy’s extreme hits will be filled – the actual fill rate will likely lie somewhere between these two outcomes.   And this is the critical issue:  at some level of fill rate the strategy will move from profitability into unprofitability.  The key to implementing a HFT scalping strategy successfully is to ensure that the execution falls on the right side of that dividing line.

Implementing HFT Scalping Strategies in Practice

One solution to the fill rate problem is to spend millions of dollars building HFT infrastructure.  But for the purposes of this post let’s assume that the trader is confined to using a retail trading platform like Tradestation or Interactive Brokers.  Are HFT scalping systems still feasible in such an environment?  The answer, surprisingly, is a qualified yes – by using a technique that took me many years to discover.

To illustrate the method I will use the following HFT scalping system in the E-Mini S&P500 futures contract.  The system trades the E-Mini futures on 3 minute bars, with an average hold time of 15 minutes.  The average trade is very low – around $6, net of commissions of $8 prt.  But the strategy appears to be highly profitable ,due to the large number of trades – around 50 to 60 per day, on average.


fig-4

fig-3

So far so good.  But the critical issue is the very large number of extreme hits produced by the strategy.  Take the trading activity on 10/18 as an example (see below).  Of 53 trades that day, 25 (47%) were extreme hits, occurring at the high or low price of the 3-minute bar in which the trade took place.


fig5


Overall, the strategy extreme hit rate runs at 34%, which is extremely high.  In reality, perhaps only 1/4 or 1/3 of these orders will actually execute – meaning that remainder, amounting to around 20% of the total number of orders, will fail.  A HFT scalping strategy cannot hope to survive such an outcome.  Strategy profitability will be decimated by a combination of missed, profitable trades and  losses on trades that escalate after an exit order fails to execute.

So what can be done in such a situation?

Manual Override, MIT and Other Interventions

One approach that will not work is to assume naively that some kind of manual oversight will be sufficient to correct the problem.  Let’s say the trader runs two versions of the system side by side, one in simulation and the other in production.  When a limit order executes on the simulation system, but fails to execute in production, the trader might step in, manually override the system and execute the trade by crossing the spread.  In so doing the trader might prevent losses that would have occurred had the trade not been executed, or force the entry into a trade that later turns out to be profitable.  Equally, however, the trader might force the exit of a trade that later turns around and moves from loss into profit, or enter a trade that turns out to be a loser.  There is no way for the trader to know, ex-ante, which of those scenarios might play out.  And the trader will have to face the same decision perhaps as many as twenty times a day.  If the trader is really that good at picking winners and cutting losers he should scrap his trading system and trade manually!

An alternative approach would be to have the trading system handle the problem,  For example, one could program the system to convert limit orders to market orders if a trade occurs at the limit price (MIT), or after x seconds after the limit price is touched.  Again, however, there is no way to know in advance whether such action will produce a positive outcome, or an even worse outcome compared to leaving the limit order in place.

In reality, intervention, whether manual or automated, is unlikely to improve the trading performance of the system.  What is certain, however,  is that by forcing the entry and exit of trades that occur around the extreme of a price bar, the trader will incur additional costs by crossing the spread.  Incurring that cost for perhaps as many as 1/3 of all trades, in a system that is producing, on average less than half a tick per trade, is certain to destroy its profitability.

Successfully Implementing HFT Strategies on a Retail Platform

For many years I assumed that the only solution to the fill rate problem was to implement scalping strategies on HFT infrastructure.  One day, I found myself asking the question:  what would happen if we slowed the strategy down?  Specifically, suppose we took the 3-minute E-Mini strategy and ran it on 5-minute bars?

My first realization was that the relative simplicity of alpha-generation algorithms in HFT strategies is an advantage here.  In a low frequency context, the complexity of the alpha extraction process mitigates its ability to generalize to other assets or time-frames.  But HFT algorithms are, by and large, simple and generic: what works on 3-minute bars for the E-Mini futures might work on 5-minute bars in E-Minis, or even in SPY.  For instance, if the essence of the algorithm is something as simple as: “buy when the price falls by more than x% below its y-bar moving average”, that approach might work on 3-minute, 5-minute, 60-minute, or even daily bars.

So what happens if we run the E-mini scalping system on 5-minute bars instead of 3-minute bars?

Obviously the overall profitability of the strategy is reduced, in line with the lower number of trades on this slower time-scale.   But note that average trade has increased and the strategy remains very profitable overall.

fig8 fig9

More importantly, the average extreme hit rate has fallen from 34% to 22%.

fig6

Hence, not only do we get fewer, slightly more profitable trades, but a much lower proportion of them occur at the extreme of the 5-minute bars.  Consequently the fill-rate issue is less critical on this time frame.

Of course, one can continue this process.  What about 10-minute bars, or 30-minute bars?  What one tends to find from such experiments is that there is a time frame that optimizes the trade-off between strategy profitability and fill rate dependency.

However, there is another important factor we need to elucidate.  If you examine the trading record from the system you will see substantial variation in the extreme hit rate from day to day (for example, it is as high as 46% on 10/18, compared to the overall average of 22%).  In fact, there are significant variations in the extreme hit rate during the course of each trading day, with rates rising during slower market intervals such as from 12 to 2pm.  The important realization that eventually occurred to me is that, of course, what matters is not clock time (or “wall time” in HFT parlance) but trade time:  i.e. the rate at which trades occur.

Wall Time vs Trade Time

What we need to do is reconfigure our chart to show bars comprising a specified number of trades, rather than a specific number of minutes.  In this scheme, we do not care whether the elapsed time in a given bar is 3-minutes, 5-minutes or any other time interval: all we require is that the bar comprises the same amount of trading activity as any other bar.  During high volume periods, such as around market open or close, trade time bars will be shorter, comprising perhaps just a few seconds.  During slower periods in the middle of the day, it will take much longer for the same number of trades to execute.  But each bar represents the same level of trading activity, regardless of how long a period it may encompass.

How do you decide how may trades per bar you want in the chart?

As a rule of thumb, a strategy will tolerate an extreme hit rate of between 15% and 25%, depending on the daily trade rate.  Suppose that in its original implementation the strategy has an unacceptably high hit rate of 50%.  And let’s say for illustrative purposes that each time-bar produces an average of 1, 000 contracts.  Since volatility scales approximately with the square root of time, if we want to reduce the extreme hit rate by a factor of 2, i.e. from 50% to 25%, we need to increase the average number of trades per bar by a factor of 2^2, i.e. 4.  So in this illustration we would need volume bars comprising 4,000 contracts per bar.  Of course, this is just a rule of thumb – in practice one would want to implement the strategy of a variety of volume bar sizes in a range from perhaps 3,000 to 6,000 contracts per bar, and evaluate the trade-off between performance and fill rate in each case.

Using this approach, we arrive at a volume bar configuration for the E-Mini scalping strategy of 20,000 contracts per bar.  On this “time”-frame, trading activity is reduced to around 20-25 trades per day, but with higher win rate and average trade size.  More importantly, the extreme hit rate runs at a much lower average of 22%, which means that the trader has to worry about maybe only 4 or 5 trades per day that occur at the extreme of the volume bar.  In this scenario manual intervention is likely to have a much less deleterious effect on trading performance and the strategy is probably viable, even on a retail trading platform.

(Note: the results below summarize the strategy performance only over the last six months, the time period for which volume bars are available).


fig7


fig10 fig11

Concluding Remarks

We have seen that is it feasible in principle to implement a HFT scalping strategy on a retail platform by slowing it down, i.e. by implementing the strategy on bars of lower frequency.  The simplicity of many HFT alpha generation algorithms often makes them robust to generalization across time frames (and sometimes even across assets).  An even better approach is to use volume bars, or trade-time, to implement the strategy.  You can estimate the appropriate bar size using the square root of time rule to adjust the bar volume to produce the requisite fill rate.  An extreme hit rate if up to 25% may be acceptable, depending on the daily trade rate, although a hit rate in the range of 10% to 15% would typically be ideal.

Finally, a word about data.  While necessary compromises can be made with regard to the trading platform and connectivity, the same is not true for market data, which must be of the highest quality, both in terms of timeliness and completeness. The reason is self evident, especially if one is attempting to implement a strategy in trade time, where the integrity and latency of market data is crucial. In this context, using the data feed from, say, Interactive Brokers, for example, simply will not do – data delivered in 500ms packets in entirely unsuited to the task.  The trader must seek to use the highest available market data feed that he can reasonably afford.

That caveat aside, one can conclude that it is certainly feasible to implement high volume scalping strategies, even on a retail trading platform, providing sufficient care is taken with the modeling and implementation of the system.

Stochastic Calculus in Mathematica

Wolfram Research introduced random processes in version 9 of Mathematica and for the first time users were able to tackle more complex modeling challenges such as those arising in stochastic calculus.  The software’s capabilities in this area have grown and matured over the last two versions to a point where it is now feasible to teach stochastic calculus and the fundamentals of financial engineering entirely within the framework of the Wolfram Language.  In this post we take a lightening tour of some of the software’s core capabilities and give some examples of how it can be used to create the building blocks required for a complete exposition of the theory behind modern finance.

SSALGOTRADING AD

fig1 fig2

fig3 fig4 fig5 fig6 fig7 fig8 fig9

Conclusion

Financial Engineering has long been a staple application of Mathematica, an area in which is capabilities in symbolic logic stand out.  But earlier versions of the software lacked the ability to work with Ito calculus and model stochastic processes, leaving the user to fill in the gaps by other means.  All that changed in version 9 and it is now possible to provide the complete framework of modern financial theory within the context of the Wolfram Language.

The advantages of this approach are considerable.  The capabilities of the language make it easy to provide interactive examples to illustrate theoretical concepts and develop the student’s understanding of them through experimentation.  Furthermore, the student is not limited merely to learning and applying complex formulae for derivative pricing and risk, but can fairly easily derive the results for themselves.  As a consequence, a course in stochastic calculus taught using Mathematica can be broader in scope and go deeper into the theory than is typically the case, while at the same time reinforcing understanding and learning by practical example and experimentation.