Developing Trading Strategies With Synthetic Data

One of the main criticisms levelled at systematic trading over the last few years is that the over-use of historical market data has tended to produce curve-fitted strategies that perform poorly out of sample in a live trading environment. This is indeed a valid criticism – given enough attempts one is bound to arrive eventually at a strategy that performs well in backtest, even on a holdout data sample. But that by no means guarantees that the strategy will continue to perform well going forward.

The solution to the problem has been clear for some time: what is required is a method of producing synthetic market data that can be used to build a strategy and test it under a wide variety of simulated market conditions. A strategy built in this way is more likely to survive the challenge of live trading than one that has been developed using only a single historical data path.

The problem, however, has been in implementation. Up until now all the attempts to produce credible synthetic price data have failed, for one reason or another, as I described in an earlier post:

I have been able to devise a completely new algorithm for generating artificial price series that meet all of the key requirements, as follows:

  • Computational simplicity & efficiency. Important if we are looking to mass-produce synthetic series for a large number of assets, for a variety of different applications. Some deep learning methods would struggle to meet this requirement, even supposing that transfer learning is possible.
  • The ability to produce price series that are internally consistent (i.e High > Low, etc) in every case .
  • Should be able to produce a range of synthetic series that vary widely in their correspondence to the original price series. In some case we want synthetic price series that are highly correlated to the original; in other cases we might want to test our investment portfolio or risk control systems under extreme conditions never before seen in the market.
  • The distribution of returns in the synthetic series should closely match the historical series, being non-Gaussian and with “fat-tails”.
  • The ability to incorporate long memory effects in the sequence of returns.
  • The ability to model GARCH effects in the returns process.

This means that we are now in a position to develop trading strategies without any direct reference to the underlying market data. Consequently we can then use all of the real market data for out-of-sample back-testing.

Developing a Trading Strategy for the S&P 500 Index Using Synthetic Market Data

To illustrate the procedure I am going to use daily synthetic price data for the S&P 500 Index over the period from Jan 1999 to July 2022. Details of the the characteristics of the synthetic series are given in the post referred to above.

This image has an empty alt attribute; its file name is Fig3-12.png

Because we want to create a trading strategy that will perform under market conditions close to those currently prevailing, I will downsample the synthetic series to include only those that correlate quite closely, i.e. with a minimum correlation of 0.75, with the real price data.

Why do this? Surely if we want to make a strategy as robust as possible we should use all of the synthetic data series for model development?

The reason is that I believe that some of the more extreme adverse scenarios generated by the algorithm may occur quite rarely, perhaps once in every few decades. However, I am principally interested in a strategy that I can apply under current market conditions and I am prepared to take my chances that the worst-case scenarios are unlikely to come about any time soon. This is a major design decision, one that you may disagree with. Of course, one could make use of every available synthetic data series in the development of the trading model and by doing so it is likely that you would produce a model that is more robust. But the training could take longer and the performance during normal market conditions may not be as good.

Having generated the price series, the process I am going to follow is to use genetic programming to develop trading strategies that will be evaluated on all of the synthetic data series simultaneously. I will then use the performance of the aggregate portfolio, i.e. the outcome of all of the trades generated by the strategy when applied to all of the synthetic series, to assess the overall performance. In order to be considered, candidate strategies have to perform well under all of the different market scenarios, or at least the great majority of them. This ensures that the strategy is likely to prove more robust across different types of market conditions, rather than on just the single type of market scenario observed in the real historical series.

As usual in these cases I will reserve a portion (10%) of each data series for testing each strategy, and a further 10% sample for out-of-sample validation. This isn’t strictly necessary: since the real data series has not be used directly in the development of the trading system, we can later test the strategy on all of the historical data and regard this as an out-of-sample backtest.

To implement the procedure I am going to use Mike Bryant’s excellent Adaptrade Builder software.

This is an exemplar of outstanding software engineering and provides a broad range of features for generating trading strategies of every kind. One feature of Builder that is particularly useful in this context is its ability to construct strategies and test them on up to 20 data series concurrently. This enables us to develop a strategy using all of the synthetic data series simultaneously, showing the performance of each individual strategy as well for as the aggregate portfolio.

After evolving strategies for 50 generations we arrive at the following outcome:

The equity curve for the aggregate portfolio is shown in blue, while the equity curves for the strategy applied to individual synthetic data series are shown towards the bottom of the chart. Of course, the performance of the aggregate portfolio appears much superior to any of the individual strategies, because it is effectively the arithmetic sum of the individual equity curves. And just because the aggregate portfolio appears to perform well both in-sample and out-of-sample, that doesn’t imply that the strategy works equally well for every individual market scenario. In some scenarios it performs better than in others, as can be observed from the individual equity curves.

But, in any case, our objective here is not to create a stock portfolio strategy, but rather to trade a single asset – the S&P 500 Index. The role of the aggregate portfolio is simply to suggest that we may have found a strategy that is sufficiently robust to work well across a variety of market conditions, as represented by the various synthetic price series.

Builder generates code for the strategies it evolves in a number of different languages and in this case we take the EasyLanguage code for the fittest strategy #77 and apply it to a daily chart for the S&P 500 Index – i.e. the real data series – in Tradestation, with the following results:

The strategy appears to work well “out-of-the-box”, i,e, without any further refinement. So our quest for a robust strategy appears to have been quite successful, given that none of the 23-year span of real market data on which the strategy was tested was used in the development process.

We can take the process a little further, however, by “optimizing” the strategy. Traditionally this would mean finding the optimal set of parameters that produces the highest net profit on the test data. But this would be curve fitting in the worst possible sense, and is not at all what I am suggesting.

Instead we use a procedure known as Walk Forward Optimization (WFO), as described in this post:

The goal of WFO is not to curve-fit the best parameters, which would entirely defeat the object of using synthetic data. Instead, its purpose is to test the robustness of the strategy. We accomplish this by using a sequence of overlapping in-sample and out-of-sample periods to evaluate how well the strategy stands up, assuming the parameters are optimized on in-sample periods of varying size and start date and tested of similarly varying out-of-sample periods. A strategy that fails a cluster of such tests is unlikely to prove robust in live trading. A strategy that passes a test cluster at least demonstrates some capability to perform well in different market regimes.

To some extent we might regard such a test as unnecessary, given that the strategy has already been observed to perform well under several different market conditions, encapsulated in the different synthetic price series, in addition to the real historical price series. Nonetheless, we conduct a WFO cluster test to further evaluate the robustness of the strategy.

As the goal of the procedure is not to maximize the theoretical profitability of the strategy, but rather to evaluate its robustness, we select a criterion other than net profit as the factor to optimize. Specifically, we select the sum of the areas of the strategy drawdowns as the quantity to minimize (by maximizing the inverse of the sum of drawdown areas, which amounts to the same thing). This requires a little explanation.

If we look at the strategy drawdown periods of the equity curve, we observe several periods (highlighted in red) in which the strategy was underwater:

The area of each drawdown represents the length and magnitude of the drawdown and our goal here is to minimize the sum of these areas, so that we reduce both the total duration and severity of strategy drawdowns.

In each WFO test we use different % of OOS data and a different number of runs, assessing the performance of the strategy on a battery of different criteria:

x

These criteria not only include overall profitability, but also factors such as parameter stability, profit consistency in each test, the ratio of in-sample to out-of-sample profits, etc. In other words, this WFO cluster analysis is not about profit maximization, but robustness evaluation, as assessed by these several different metrics. And in this case the strategy passes every test with flying colors:

Other than validating the robustness of the strategy’s performance, the overall effect of the procedure is to slightly improve the equity curve by diminishing the magnitude and duration of the drawdown periods:

Conclusion

We have shown how, by using synthetic price series, we can build a robust trading strategy that performs well under a variety of different market conditions, including on previously “unseen” historical market data. Further analysis using cluster WFO tests strengthens the assessment of the strategy’s robustness.

Intraday Stock Index Forecasting

In a previous post I discussed modelling stock prices processes as Geometric brownian Motion processes:

Understanding Stock Price Range Forecasts

To recap briefly, we assume a process of the form:

Where S0 is the initial stock price at time t = 0.

The mean of such a process is:

and standard deviation:

In the post I showed how to estimate such a process with daily stock prices, using these to provide a forecast range of prices over a one-month horizon. This is potentially useful, for example, in choosing which strikes to select in an option hedge.

Of course, there is nothing to prevent you from using the same technique over different timescales. Here I use the MATH-TWS package to connect Mathematica to the IB TWS platform via the C++ api, to extract intraday prices for the S&P 500 Index at 1-minute intervals. These are used to estimate a short-term GBM process, which provides forecasts of the mean and variance of the index at the 4 PM close.

We capture the data using:

then create a time series of the intraday prices and plot them:

If we want something a little fancier we can create a trading chart, including technical indicators of our choice, for instance:

The charts can be updated in real time from IB, using MATHTWS.

From there we estimate a GBM process using 1-minute close prices:

and then simulate a number of price paths towards the 4 PM close (the mean price path is shown in black):

This indicates that the expected value of the SPX index at the close will be around 4450, which we could estimate directly from:

Where u is the estimated drift of the GBM process.

Similarly we can look at the projected terminal distribution of the index at 4pm to get a sense of the likely range of closing prices, which may assist a decision to open or close certain option (hedge) positions:

Of course, all this is predicated on the underlying process continuing on its current trajectory, with drift and standard deviation close to those seen in the process in the preceding time interval. But trends change, as do volatilities, which means that our forecasts may be inaccurate. Furthermore, the drift in asset processes tends to be dominated by volatility, especially at short time horizons.

So the best way to think of this is as a conditional expectation, i.e. “If the stock price continues on its current trajectory, then our expectation is that the closing price will be in the following range…”.

For more on MATH-TWS see:

MATH-TWS: Connecting Wolfram Mathematica to IB TWS

Trading Market Sentiment

Text and sentiment analysis has become a very popular topic in quantitative research over the last decade, with applications ranging from market research and political science, to e-commerce.  In this post I am going to outline an approach to the subject, together with some core techniques, that have applications in investment strategy.

In the early days of the developing field of market sentiment analysis, the supply of machine readable content was limited to mainstream providers of financial news such as Reuters or Bloomberg. Over time this has changed with the entry of new competitors in the provision of machine readable news, including, for example, Ravenpack or more recent arrivals like Accern.  Providers often seek to sell not only the raw news feed service, but also their own proprietary sentiment indicators that are claimed to provide additional insight into how individual stocks, market sectors, or the overall market are likely to react to news.  There is now what appears to be a cottage industry producing white papers seeking to demonstrate the value of these services, often accompanied by some impressive pro-forma performance statistics for the accompanying strategies, which include long-only, long/short, market neutral and statistical arbitrage.

For the purpose of demonstration I intend to forego the blandishments of these services, although many are no doubt are excellent, since the reader is perhaps unlikely to have access to them.  Instead, in what follows I will focus on a single news source, albeit a highly regarded one:  the Wall Street Journal.  This is, of course, a simplification intended for illustrative purposes only – in practice one would need to use a wide variety of news sources and perhaps subscribe to a machine readable news feed service.  But similar principles and techniques can be applied to any number of news feeds or online sites.

SSALGOTRADING AD

The WSJ News Archive

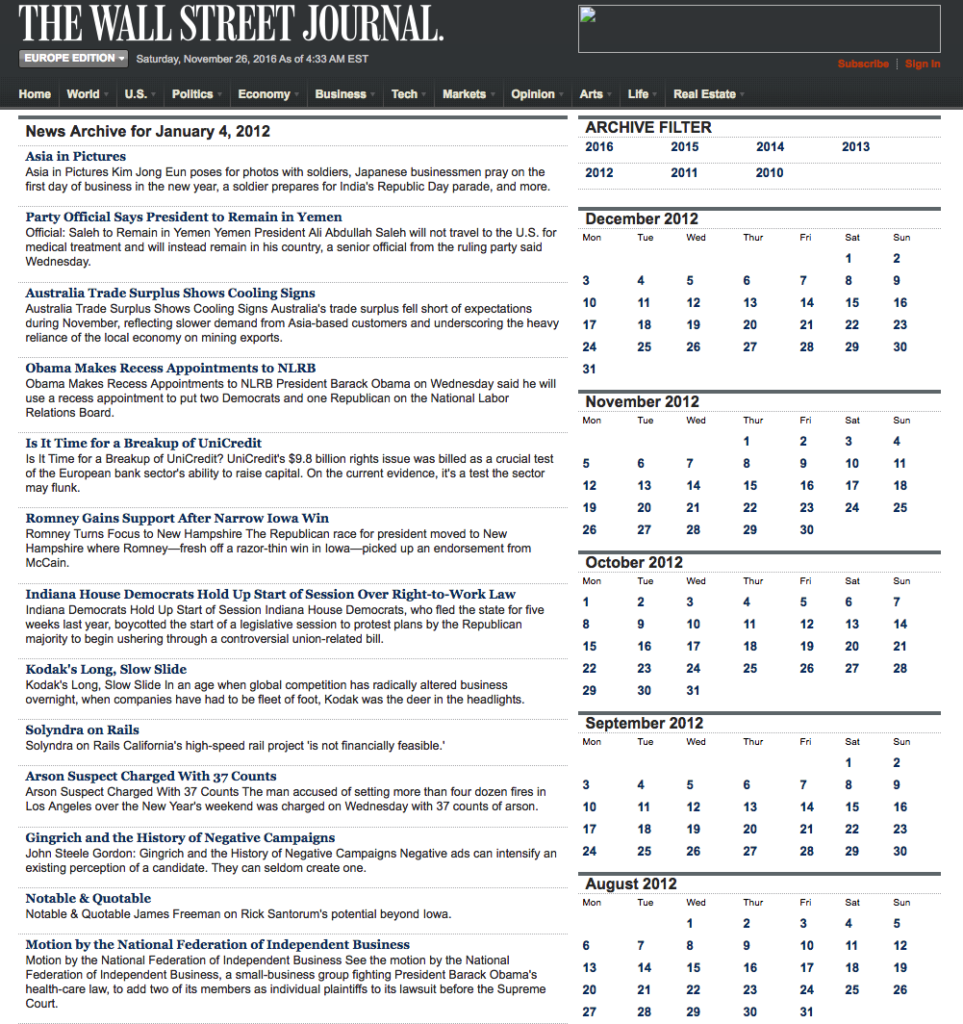
We are going to access the Journal’s online archive, which presents daily news items in a convenient summary format, an example of which is shown below. The archive runs from the beginning of 2012 through to the current day, providing ample data for analysis.  In what follows, I am going to make two important assumptions, neither of which is likely to be 100% accurate – but which will not detract too much from the validity of the research, I hope.  The first assumption is that the news items shown in each daily archive were reported prior to the market open at 9:30 AM.  This is likely to be true for the great majority of the stories, but there are no doubt important exceptions.  Since we intend to treat the news content of each archive as antecedent to the market action during the corresponding trading session, exceptions are likely to introduce an element of look-ahead bias.  The second assumption is that the archive for each day is shown in the form in which it would have appeared on the day in question.  In reality, there are likely to have been revisions to some of the stories made subsequent to their initial publication. So, here too, we must allow for the possibility of look-ahead bias in the ensuing analysis.

fig1


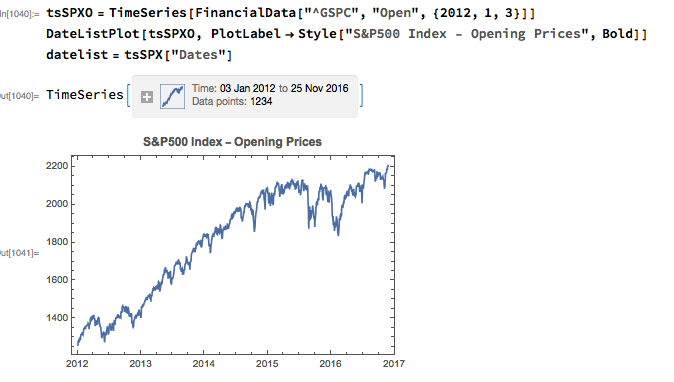
With those caveats out of the way, let’s proceed.  We are going to be using broad market data for the S&P 500 index in the analysis to follow, so the first step is to download daily price series for the index.  Note that we begin with daily opening prices, since we intend to illustrate the application of news sentiment analysis with a theoretical day-trading strategy that takes positions at the start of each trading session, exiting at market close.

fig2

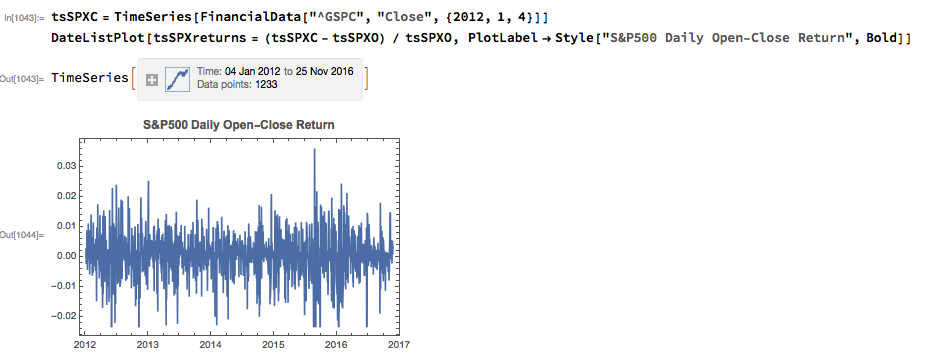
From there we calculate the intraday return in the index, from market open to close, as follows:

fig3

Text Analysis & Classification

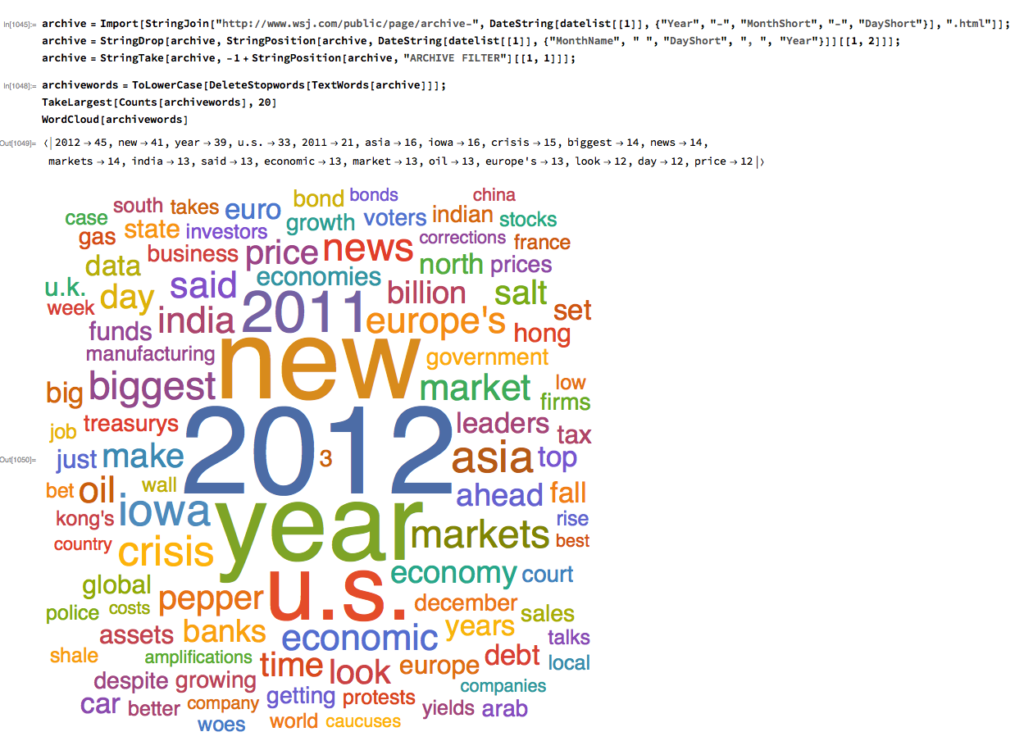
Next we turn to the task of reading the news archive and categorizing its content.  Mathematica makes the importation of html pages very straightforward,  and we can easily crop the raw text string to exclude page headers and footers.  The approach I am going to take is to derive a sentiment indicator based on an analysis of the sentiment of each word in the daily archive.  Before we can do that we must first convert the text into individuals words, stripping out standard stop-words such as “the” and “in” and converting all the text to lower case.  Naturally one can take this pre-processing a great deal further, by identifying and separating out proper nouns, for example.  Once the text processing stage is complete we can quickly summarize the content, for example by looking at the most common words, or by representing the entire archive in the form of a word cloud.  Given that we are using the archive for the first business day of 2012, it is perhaps unsurprising that we find that “2012”, “new” and “year” feature so prominently!

fig4


The subject of sentiment analysis is a complex one and I only touch on it here.  For those interested in the subject I can recommend The Text Mining Handbook, by Feldman and Sanger, which is a standard work on the topic.  Here I am going to employ a machine learning classifier provided with Mathematica 11.  It is not terribly sophisticated (or, at least, has not been developed with financial applications especially in mind), but will serve for the purposes of this article.  For those unfamiliar with the functionality, the operation of the sentiment classification algorithm is straightforward enough.  For instance:

fig5

We apply the algorithm to classify each word in the daily news archive and arrive at a sentiment indicator based on the proportion of words that are classified as “positive”.  The sentiment reading for the archive for Jan-3, 2012, for example, turns out to be 67.4%:

fig6

Sentiment Index Analytics

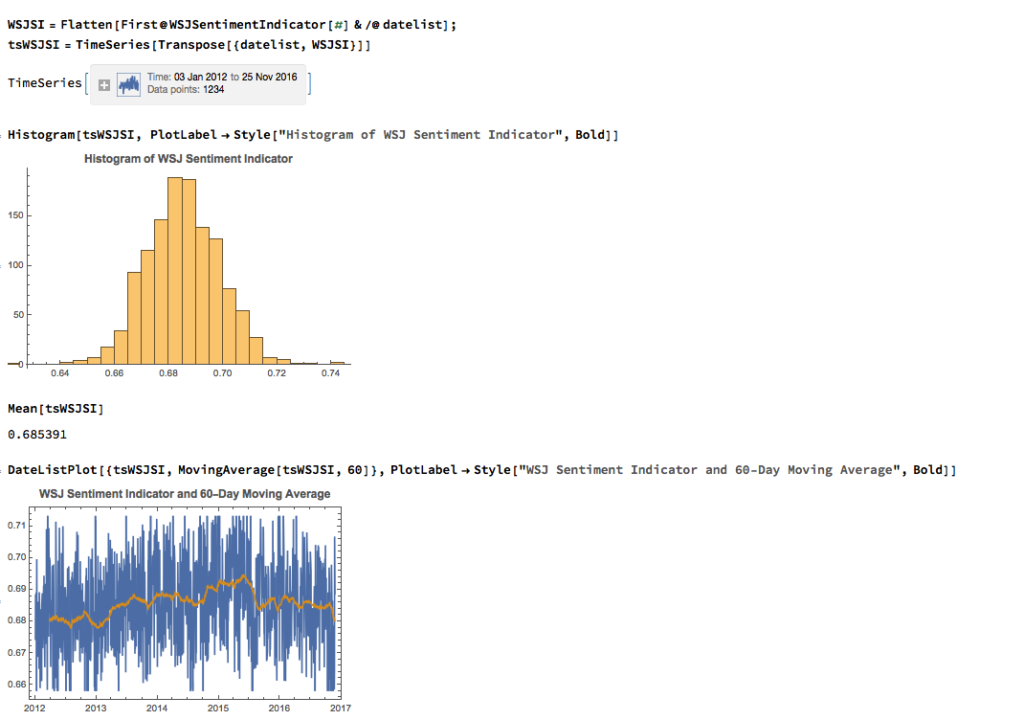
We can automate the process of classifying the entire WSJ archive with just a few lines of code, producing a time series for the daily sentiment indicator, which has an average daily value of  68.5%  – the WSJ crowd tends to be bullish, clearly!  Note how the 60-day moving average of the indicator rises steadily over the period from 2012 through Q1 2015, then abruptly reverses direction, declining steadily thereafter – even somewhat precipitously towards the end of 2016.

fig7


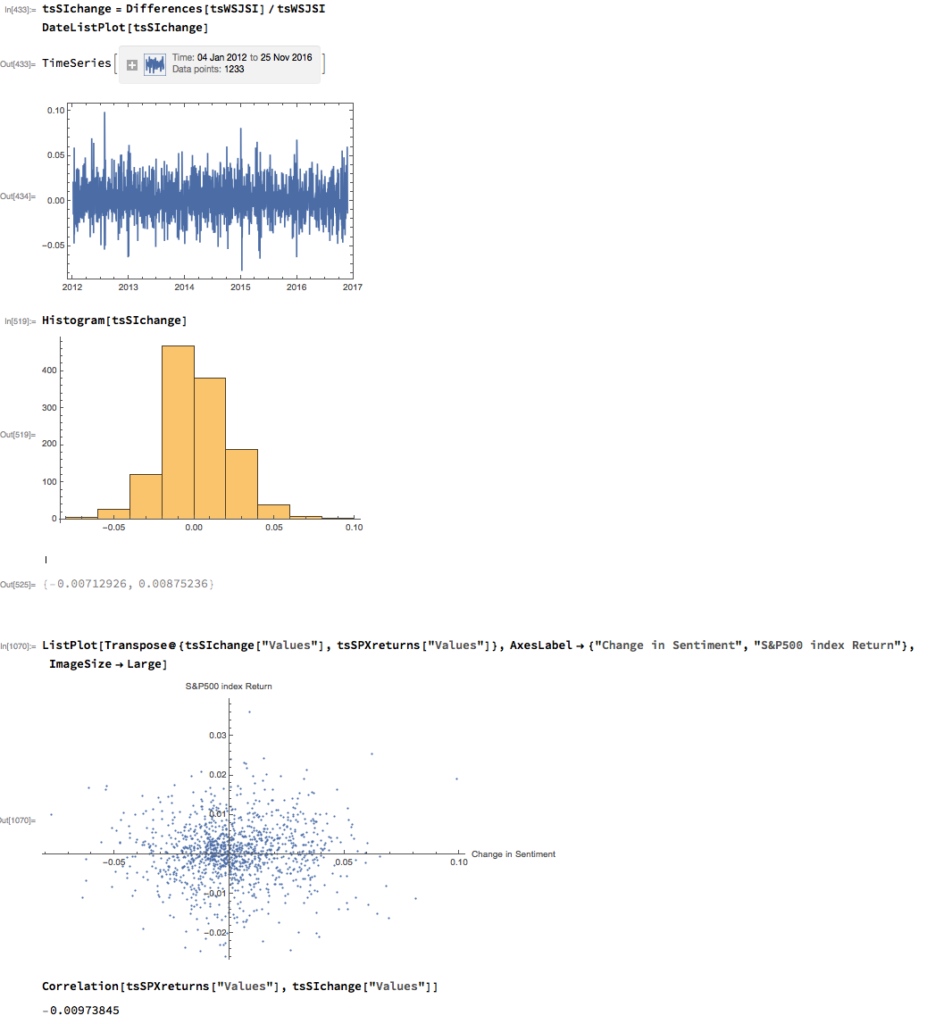
fig8

As with most data series in investment research, we are less interested in the level of a variable, such as a stock price, than we are in the changes in level.   So the next step is to calculate the daily percentage change in the sentiment indicator and examine the correlation with the corresponding intraday return in the S&P 500 Index.  At first glance our sentiment indicator appears to have very little predictive power  – the correlation between indicator changes and market returns is negligibly small overall – but we shall later see that this is not the last word.


fig9


Conditional Distributions

Thus far the results appear discouraging; but as is often the case with this type of analysis we need to look more closely at the conditional distribution of returns.  Specifically, we will examine the conditional distribution of S&P 500 Index returns when changes in the sentiment index are in the upper and lower quantiles of the distribution. This will enable us to isolate the impact of changes in market sentiment at times when the swings in sentiment are strongest.  In the analysis below, we begin by examining the upper and lower third of the distribution of changes in sentiment:

fig10

The analysis makes clear that the distribution of S&P 500 Index returns is very different on days when the change in market sentiment is large and positive vs. large and negative. The difference is not just limited to the first moment of the conditional distribution, where the difference in the mean return is large and statistically significant, but also in the third moment.  The much larger, negative skewness means that there is a greater likelihood of a large decline in the market on days in which there is a sizable drop in market sentiment, than on days in which sentiment significantly improves.  In other words, the influence of market sentiment changes is manifest chiefly through the mean and skewness of the conditional distributions of market returns.

A News Trading Algorithm

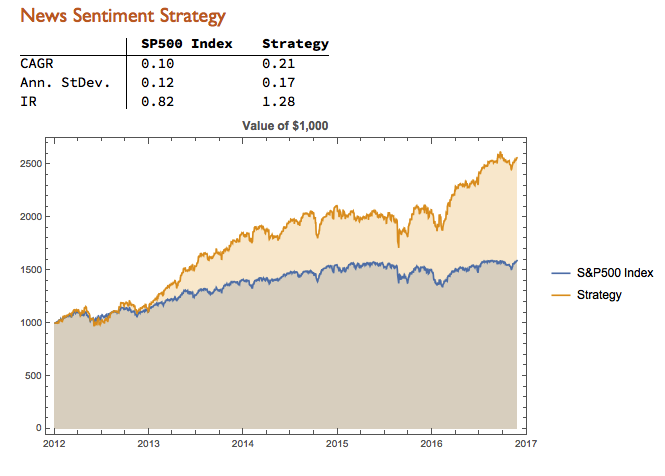
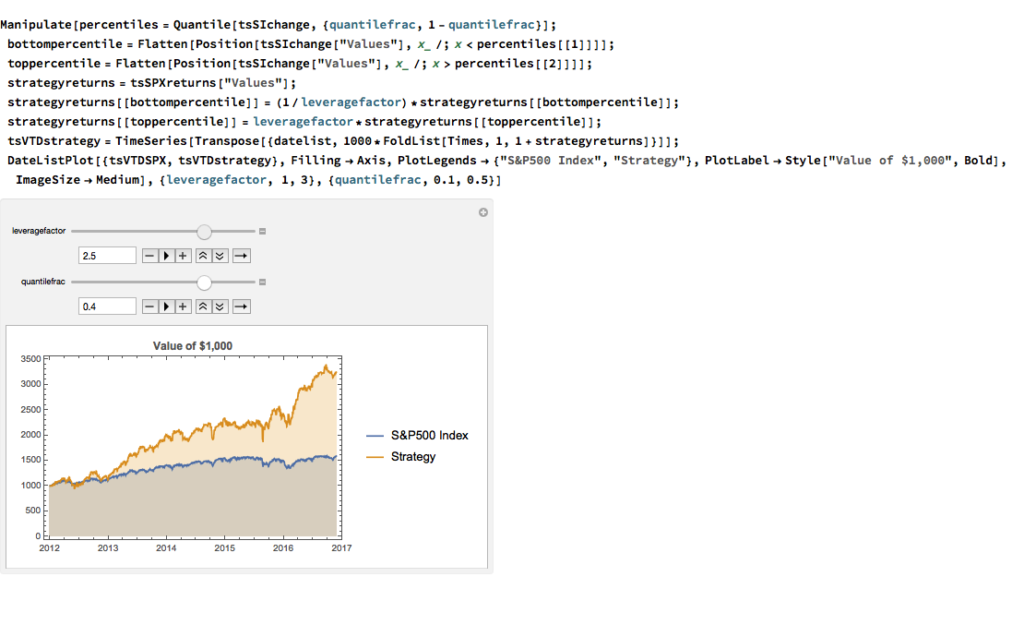
We can capitalize on these effects using a simple trading strategy in which we increase the capital allocated to a long-SPX position on days when market sentiment improves, while reducing exposure on days when market sentiment falls.  We increase the allocation by a factor – designated the leverage factor – on days when the change in the sentiment indicator is in the upper 1/3 of the distribution, while reducing the allocation by 1/leveragefactor on days when the change in the sentiment indicator falls in lower 1/3 of the distribution.  The allocation on other days is 100%.  The analysis runs as follows:

fig13 fig14

It turns out that, using a leverage factor of 2.0, we can increase the CAGR from 10% to 21% over the period from 2012-2016 using the conditional distribution approach.  This performance enhancement comes at a cost, since the annual volatility of the news sentiment strategy is 17% compared to only 12% for the long-only strategy. However, the overall net result is positive, since the risk-adjusted rate of return increases from 0.82 to 1.28.

We can explore the robustness of the result, comparing different quantile selections and leverage factors using Mathematica’s interactive Manipulate function:

fig12

Conclusion

We have seen that a simple market sentiment indicator can be created quite easily from publicly available news archives, using a standard machine learning sentiment classification algorithm.  A market sentiment algorithm constructed using methods as straightforward as this appears to provide the capability to differentiate the conditional distribution of market returns on days when changes in market sentiment are significantly positive or negative.  The differences in the higher moments of the conditional distribution appears to be as significant as the differences in the mean.  In principle, we can use the insight provided by the sentiment indicator to enhance a long-only day-trading strategy, increasing leverage and allocation on days when changes to market sentiment are positive and reducing them on days when sentiment declines.  The performance enhancements resulting from this approach appear to be significant.

Several caveats apply.  The S&P 500 index is not tradable, of course, and it is not uncommon to find trading strategies that produce interesting theoretical results.  In practice one would be obliged to implement the strategy using a tradable market proxy, such as a broad market ETF or futures contract.  The strategy described here, which enters and exits positions daily, would incur substantial trading costs, that would be further exacerbated by the use of leverage.

Of course there are many other uses one can make of news data, in particular with firm-specific news and sentiment analytics, that fall outside the scope of this article.  Hopefully, however, the methodology described here will provide a sign-post towards further, more practically useful research.


Trading With Indices

In this post I want to discuss ways to make use of signals from relevant market indices in your trading.  These signals can add value regardless of whether you trade algorithmically or manually.  The techniques described here are one of the most widely applicable in the quantitative analyst’s arsenal.

Let’s motivate the discussion by looking an example of a simple trading system trading the VIX on weekly bars.  Performance results for the system are summarized in the chart and table below.  The system outperforms the buy and hold return by a substantial margin, with a profit factor of over 3 and a win rate exceeding 82%.  What’s not to like?

VIX EC

VIX Performance

Well, for one thing, this isn’t really a trading system – because the VIX Index itself isn’t tradable. So the performance results are purely notional (and, if you didn’t already notice, no slippage or commission is included).

It is very easy to build high-performing trading system in indices – because they are not traded products,  index prices are often stale and tend to “follow” the price action in the equivalent traded market.

This particular system for the VIX Index took me less than ten minutes to develop and comprises only a few lines of code.  The system makes use of a simple RSI indicator to decide when to buy or sell the index.  I optimized the indicator parameters (separately for long and short) over the period to 2012, and tested it out-of-sample on the data from 2013-2016.

inputs:
Price( Close ) ,
Length( 14 ) ,
OverSold( 30 ) ;

variables:
RSIValue( 0 );

RSIValue = RSI( Price, Length );
if CurrentBar > 1 and RSIValue crosses over OverSold then
Buy ( !( “RsiLE” ) ) next bar at market;

.

The daily system I built for the S&P 500 Index is a little more sophisticated than the VIX model, and produces the following results.

SP500 EC

SP500 Perf


Using Index Trading Systems

We have seen that its trivially easy to build profitable trading systems for index products.  But since they can’t be traded, what’s the point?

The analyst might be tempted by the idea of using the signals generated by an index trading system to trade a corresponding market, such as VIX or eMini futures.  However, this approach is certain to fail.  Index prices lag the prices of equivalent futures products, where traders first monetize their view on the market.  So using an index strategy directly to trade a cash or futures market would be like trying to trade using prices delayed by a few seconds, or minutes – a recipe for losing money.

SSALGOTRADING AD

Nor is it likely that a trading system developed for an index product will generalize to a traded market.  What I mean by this is that if you were to take an index strategy, such as the VIX RSI strategy, transfer it to VIX futures and tweak the parameters in the hope of producing a profitable system, you are likely to be disappointed. As I have shown, you can produce a profitable index trading system using the simplest and most antiquated trading concepts (such as the RSI index) that long ago ceased to offer any predictive value in actual traded markets.  Index markets are actually inefficient – the prices of index products often fail to fully reflect all relevant, available information in a timely way. Such simple inefficiencies are easily revealed by indicators such as moving averages.  Traded markets, by contrast, are highly efficient and, with the exception of HFT, it is going to take a great deal more than a simple moving average to provide insight into the few inefficiencies that do arise.

bullbear

Strategies in index products are best thought of, not as trading strategies, but rather as a means of providing broad guidance as to the general condition of the market and its likely direction over the longer term.  To take the VIX index strategy as an example, you can see that each “trade” spans several weeks.  So one might regard a “buy” signal from the VIX index system as an indication that volatility is expected to rise over the next month or two.  A trader might use that information to lean on the side of being long volatility, perhaps even avoiding any short volatility positions altogether for the next several weeks.  Following the model’s guidance in that way would would certainly have helped many equity and volatility traders during the market sell off during August 2015, for example:


Vix Example

The S&P 500 Index model is one I use to provide guidance as to market conditions for the current trading day.  It is a useful input to my thinking as to how aggressive I want my trading models to be during the upcoming session. If the index model suggests a positive tone to the market, with muted volatility, I might be inclined to take a more aggressive stance.  If the model starts trading to the short side, however, I am likely to want to be much more cautious.    Yesterday (May 16, 2016), for example, the index model took an early long trade, providing confirmation of the positive tenor to the market and encouraging me to trade volatility to the short side more aggressively.


SP500 Example


In general, I would tend to classify index trading systems as “decision support” tools that provide a means of shading opinion on the market, or perhaps providing a means of calibrating trading models to the anticipated market conditions. However, they can be used in a more direct way, short of actual trading.  For example, one of our volatility trading systems uses the trading signals from a trading system designed for the VVIX volatility-of-volatility index.  Another approach is to use the signals from an index trading system as an indicator of the market regime in a regime switching model.

Designing Index Trading Models

Whereas it is profitability that is typically the primary design criterion for an actual trading system, given the purpose of an index trading system there are other criteria that are at least as important.

It should be obvious from these few illustrations that you want to design your index model to trade less frequently than the system you are intending to trade live: if you are swing-trading the eminis on daily bars, it doesn’t help to see 50 trades a day from your index system.  What you want is an indication as to whether the market action over the next several days is likely to be positive or negative.  This means that, typically, you will design your index system using bar frequencies at least as long as for your live system.

Another way to slow down the signals coming from your index trading system is to design it for very high accuracy – a win rate of  70%, or higher.  It is actually quite easy to do this:  I have systems that trade the eminis on daily bars that have win rates of over 90%.  The trick is simply that you have to be prepared to wait a long time for the trade to come good.  For a live system that can often be a problem – no-one like to nurse an underwater position for days or weeks on end.  But for an index trading system it matters far less and, in fact, it helps:  because you want trading signals over longer horizons than the time intervals you are using in your live trading system.

Since the index system doesn’t have to trade live, it means of course that the usual trading costs and frictions do not apply.  The advantage here is that you can come up with concepts for trading systems that would be uneconomic in the real world, but which work perfectly well in the frictionless world of index trading.  The downside, however, is that this might lead you to develop index systems that trade far too frequently.  So, even though they should not apply, you might seek to introduce trading costs in order to penalize higher frequency trading systems and benefit systems that trade less frequently.

Designing index trading systems in an area in which genetic programming algorithms excel.  There are two main reasons for this.  Firstly, as I have previously discussed, simple technical indicators of the kind employed by GP modeling systems work well in index markets.  Secondly, and more importantly, you can use the GP system to tailor an index trading system to meet the precise criteria you have in mind, such as the % win rate, trading frequency, etc.

An outstanding product that I can highly recommend in this context is Mike Bryant’s Adaptrade Builder.  Builder is a superb piece of software whose power and ease of use reflects Mike’s engineering background and systems development expertise.


Adaptrade


Designing a Scalable Futures Strategy

I have been working on a higher frequency version of the eMini S&P 500 futures strategy, based on 3-minute bar intervals, which is designed to trade a couple of times a week, with hold periods of 2-3 days.  Even higher frequency strategies are possible, of course, but my estimation is that a hold period of under a week provides the best combination of liquidity and capacity.  Furthermore, the strategy is of low enough frequency that it is not at all latency sensitive – indeed, in the performance analysis below I have assumed that the market must trade through the limit price before the system enters a trade (relaxing the assumption and allowing the system to trade when the market touches the limit price improves the performance).

The other important design criteria are the high % of profitable trades and Kelly f (both over 95%).  This enables the investor to employ money management techniques, such a fixed-fractional allocation for example, in order to scale the trade size up from 1 to 10 contracts, without too great a risk of a major drawdown in realized P&L.

The end result is a strategy that produces profits of $80,000 to $100,000 a year on a 10 contract position, with an annual rate of return of 30% and a Sharpe ratio in excess of 2.0.

Furthermore, of the 682 trades since Jan 2010, only 29 have been losers.

Annual P&L (out of sample)

Annual PL


Equity Curve

EC

Strategy Performance

Perf 1

What’s the Downside?

Everything comes at a price, of course.  Firstly, the strategy is long-only and, by definition, will perform poorly in falling markets, such as we saw in 2008.  That’s a defensible investment thesis, of course – how many $billions are invested in buy and hold strategies? – and, besides, as one commentator remarked, the trick is to develop multiple strategies for different market regimes (although, sensible as that sounds, one is left with the difficulty of correctly identifying the market regime).

The second drawback is revealed by the trade chart below, which plots the drawdown experienced during each trade.  The great majority of these drawdowns are unrealized, and in most cases the trade recovers to make a profit.  However, there are some very severe cases, such as Sept 2014, when the strategy experienced a drawdown of $85,000 before recovering to make a profit on the trade.  For most investors, the agony of risking an entire year’s P&L just to make a few hundred dollars would be too great.

SSALGOTRADING AD

It should be pointed out that the by the time the drawdown event took place the strategy had already produced many hundreds of thousands of dollars of profit.  So, one could take the view that by that stage the strategy was playing with “house money” and could well afford to take such a risk.

One obvious “solution” to the drawdown problem is to use some kind of stop loss. Unfortunately, the effect is simply to convert an unrealized drawdown into a realized loss.  For some, however, it might be preferable to take a hit of $40,000 or $50,000 once every few years, rather than suffer the  uncertainty of an even larger potential loss.  Either way, despite its many pleasant characteristics, this is not a strategy for investors with weak stomachs!

Trade