The Misunderstood Art of Market Timing:

How to Beat Buy-and-Hold with Less Risk

Market timing has a very bad press and for good reason: the inherent randomness of markets makes reliable forecasting virtually impossible.  So why even bother to write about it?  The answer is, because market timing has been mischaracterized and misunderstood.  It isn’t about forecasting.  If fact, with notable exceptions, most of trading isn’t about forecasting.  It’s about conditional expectations.

Conditional expectations refer to the expected value of a random variable (such as future stock returns) given certain known information or conditions.

In the context of trading and market timing, it means that rather than attempting to forecast absolute price levels, we base our expectations for future returns on current observable market conditions.

For example, let’s say historical data shows that when the market has declined a certain percentage from its recent highs (condition), forward returns over the next several days tend to be positive on average (expectation). A trading strategy could use this information to buy the dip when that condition is met, not because it is predicting that the market will rally, but because history suggests a favorable risk/reward ratio for that trade under those specific circumstances.

The key insight is that by focusing on conditional expectations, we don’t need to make absolute predictions about where the market is heading. We simply assess whether the present conditions have historically been associated with positive expected returns, and use that probabilistic edge to inform our trading decisions.

This is a more nuanced and realistic approach than binary forecasting, as it acknowledges the inherent uncertainty of markets while still allowing us to make intelligent, data-driven decisions. By aligning our trades with conditional expectations, we can put the odds in our favor without needing a crystal ball.

So, when a market timing algorithm suggests buying the market, it isn’t making a forecast about what the market is going to do next.  Rather, what it is saying is, if the market behaves like this then, on past experience, the following trade is likely to be profitable.  That is a very different thing from forecasting the market.

A good example of a simple market-timing algorithm is “buying the dips”.  It’s so simple that you don’t need a computer algorithm to do it.  But a computer algorithm helps by determining what comprises a dip and the level at which profits should be taken.

One of my favorites market timing strategies is the following algorithm, which I originally developed to trade the SPY ETF.  The equity curve from inception of the ETF in 1993 looks like this:

The algorithm combines a few simple technical indicators to determine what constitutes a dip and the level at which profits should be taken.  The entry and exit orders are also very straightforward, buying and selling at the market open, which can be achieved by participating in the opening auction.  This is very convenient:  a signal is generated after the close on day 1 and is then executed as a MOA (market opening auction) order in the opening auction on day 2.  The opening auction is by no means the most liquid period of the trading session, but in an ETF like SPY the volumes are such that the market impact is likely to be negligible for the great majority of investors.  This is not something you would attempt to do in an illiquid small-cap stock, however, where entries and exits are more reliably handled using a VWAP algorithm; but for any liquid ETF or large-cap stock the opening auction will typically be fine.

Another aspect that gives me confidence in the algorithm is that it generalizes well to other assets and even other markets.  Here, for example, is the equity curve for the exact same algorithm implemented in the XLG ETF in the period from 2010:

And here is the equity curve for the same strategy (with the same parameters) in AAPL, over the same period:

Remarkably, the strategy also works in E-mini futures too, which is highly unusual:  typically the market dynamics of the futures market are so different from the spot market that strategies don’t transfer well.  But in this case, it simply works:

The reason the strategy is effective is due to the upward drift in equities and related derivatives.  If you tried to apply a similar strategy to energy or currency markets, it would fail. The strategy’s “secret sauce” is the combination of indicators it uses to determine the short-term low in the ETF that constitutes a good buying opportunity, and then figure out the right level at which to sell.

Does the algorithm always work?  If by that you mean “is every trade profitable?” the answer is no.  Around 61% of trades are profitable, so there are many instances where trades are closed at a loss.  But the net impact of using the market-timing algorithm is very positive, when compared to the buy-and-hold benchmark, as we shall see shortly. 

Because the underlying thesis is so simple (i.e. equity markets have positive drift), we can say something about the long-term prospects for the strategy.  Equity markets haven’t changed their fundamental tendency to appreciate over the 31-year period from inception of the SPY ETF in 1993, which is why the strategy has performed well throughout that time.  Could one envisage market conditions in which the strategy will perform poorly?  Yes – any prolonged period of flat to downward trending prices in equities will result in poor performance.  But we haven’t seen those conditions since the early 1970’s and, arguably, they are unlikely to return, since the fundamental change brought about by abandonment of the gold standard in 1973. 

The abandonment of the gold standard and the subsequent shift to fiat currencies has given central banks, particularly the U.S. Federal Reserve, unprecedented power to expand the money supply and support asset prices during times of crisis. This ‘Fed Put’ has been a major factor underpinning the multi-decade bull market in stocks.

In addition, the increasing dominance of the U.S. as the world’s primary economic and military superpower since the end of the Cold War has made U.S. financial assets a uniquely attractive destination for global capital, creating sustained demand for U.S. equities.

Technological innovation, particularly with respect to the internet and advances in computing, has also unleashed a wave of productivity and wealth creation that has disproportionately benefited the corporate sector and equity holders. This trend shows no signs of abating and may even be accelerating with the advent of artificial intelligence.

While risks certainly remain and occasional cyclical bear markets are inevitable, the combination of accommodative monetary policy, the U.S.’s global hegemony, and technological progress create a powerful set of economic forces that are likely to continue propelling equity prices higher over the long-term, albeit with significant volatility along the way.Strategy Performance in Bear Markets

Note that the conditions I am referring to are something unlike anything we have seen in the last 50 years, not just a (serious) market pullback.  If we look at the returns in the period from 2000-2002, for example, we see that the strategy held up very well, out-performing the benchmark by 54% over the three-year period of the market crash.  Likewise, in 2008 credit crisis, the strategy was able to eke out a small gain, beating the benchmark by over 38%.  In fact, the strategy is positive in all but one of the 31 years from inception.

Let’s take a look at the compound returns from the strategy vs. the buy-and-hold benchmark:

At first sight, it appears that the benchmark significantly out-performs the strategy, albeit suffering from much larger drawdowns.  But that doesn’t give an accurate picture of relative performance.  To see why, let’s look at the overall performance characteristics:

Now we see that, while the strategy CAGR is 3.50% below the buy-and-hold return, its annual volatility is less than half that of the benchmark, giving the strategy a superior Sharpe Ratio. 

To make a valid comparison between the strategy and its benchmark we therefore need to equalize the annual volatility of both, and we can achieve this by leveraging the strategy by a factor of approximately 2.32.  When we do that, we obtain the following results:

Now that the strategy and benchmark volatilities have been approximately equalized through leverage, we see that the strategy substantially outperforms buy-and-hold by around 355 basis points per year and with far smaller drawdowns.

In general, we see that the strategy outperformed the benchmark in fewer than 50% of annual periods since 1993. However, the size of the outperformance in years when it beat the benchmark was frequently very substantial:

Market timing can work.  To understand why, we need to stop thinking in terms of forecasting and think instead about conditional returns.  When we do that, we arrive at the insight that market timing works because it relies on the positive drift in equity markets, which has been one of the central features of that market over the last 50 years and is likely to remain so in the foreseeable future. We have confidence in that prediction, because we understand the economic factors that have continued to drive the upward drift in equities over the last half-century.

After that, it is simply a question of the mechanics – how to time the entries and exits.  This article describes just one approach amongst a great number of possibilities.

One of the many benefits of market timing is that it has a tendency to side-step the worst market conditions and can produce positive returns even in the most hostile environments: periods such as 2000-2002 and 2008, for example, as we have seen.

Finally, don’t forget that, as we are sitting out of the market approximately 40% of the time our overall risk is much lower – less than half that of the benchmark.  So, we can afford to leverage our positions without taking on more overall risk than when we buy and hold.  This clearly demonstrates the ability of the strategy to produce higher rates of risk-adjusted return.

A Practical Application of Regime Switching Models to Pairs Trading

In the previous post I outlined some of the available techniques used for modeling market states.  The following is an illustration of how these techniques can be applied in practice.    You can download this post in pdf format here.

SSALGOTRADING AD

The chart below shows the daily compounded returns for a single pair in an ETF statistical arbitrage strategy, back-tested over a 1-year period from April 2010 to March 2011.

The idea is to examine the characteristics of the returns process and assess its predictability.

Pairs Trading

The initial impression given by the analytics plots of daily returns, shown in Fig 2 below, is that the process may be somewhat predictable, given what appears to be a significant 1-order lag in the autocorrelation spectrum.  We also see evidence of the
customary non-Gaussian “fat-tailed” distribution in the error process.

Regime Switching

An initial attempt to fit a standard Auto-Regressive Moving Average ARMA(1,0,1) model  yields disappointing results, with an unadjusted  model R-squared of only 7% (see model output in Appendix 1)

However, by fitting a 2-state Markov model we are able to explain as much as 65% in the variation in the returns process (see Appendix II).
The model estimates Markov Transition Probabilities as follows.

P(.|1)       P(.|2)

P(1|.)       0.93920      0.69781

P(2|.)     0.060802      0.30219

In other words, the process spends most of the time in State 1, switching to State 2 around once a month, as illustrated in Fig 3 below.

Markov model
In the first state, the  pairs model produces an expected daily return of around 65bp, with a standard deviation of similar magnitude.  In this state, the process also exhibits very significant auto-regressive and moving average features.

Regime 1:

Intercept                   0.00648     0.0009       7.2          0

AR1                            0.92569    0.01897   48.797        0

MA1                         -0.96264    0.02111   -45.601        0

Error Variance^(1/2)           0.00666     0.0007

In the second state, the pairs model  produces lower average returns, and with much greater variability, while the autoregressive and moving average terms are poorly determined.

Regime 2:

Intercept                    0.03554    0.04778    0.744    0.459

AR1                            0.79349    0.06418   12.364        0

MA1                         -0.76904    0.51601     -1.49   0.139

Error Variance^(1/2)           0.01819     0.0031

CONCLUSION
The analysis in Appendix II suggests that the residual process is stable and Gaussian.  In other words, the two-state Markov model is able to account for the non-Normality of the returns process and extract the salient autoregressive and moving average features in a way that makes economic sense.

How is this information useful?  Potentially in two ways:

(i)     If the market state can be forecast successfully, we can use that information to increase our capital allocation during periods when the process is predicted to be in State 1, and reduce the allocation at times when it is in State 2.

(ii)    By examining the timing of the Markov states and considering different features of the market during the contrasting periods, we might be able to identify additional explanatory factors that could be used to further enhance the trading model.

Markov model

Momentum Strategies

A few weeks ago I wrote an extensive post on a simple momentum strategy in E-Mini Futures. The basic idea is to buy the S&P500 E-Mini futures when the contract makes a new intraday high. This is subject to the qualification that the Internal Bar Strength fall below a selected threshold level. In order words, after a period of short-term weakness – indicated by the low reading of the Internal Bar Strength – we buy when the futures recover to make a new intraday high, suggesting continued forward momentum.

IBS is quite a useful trading indicator, which you can learn more about in the blog post:

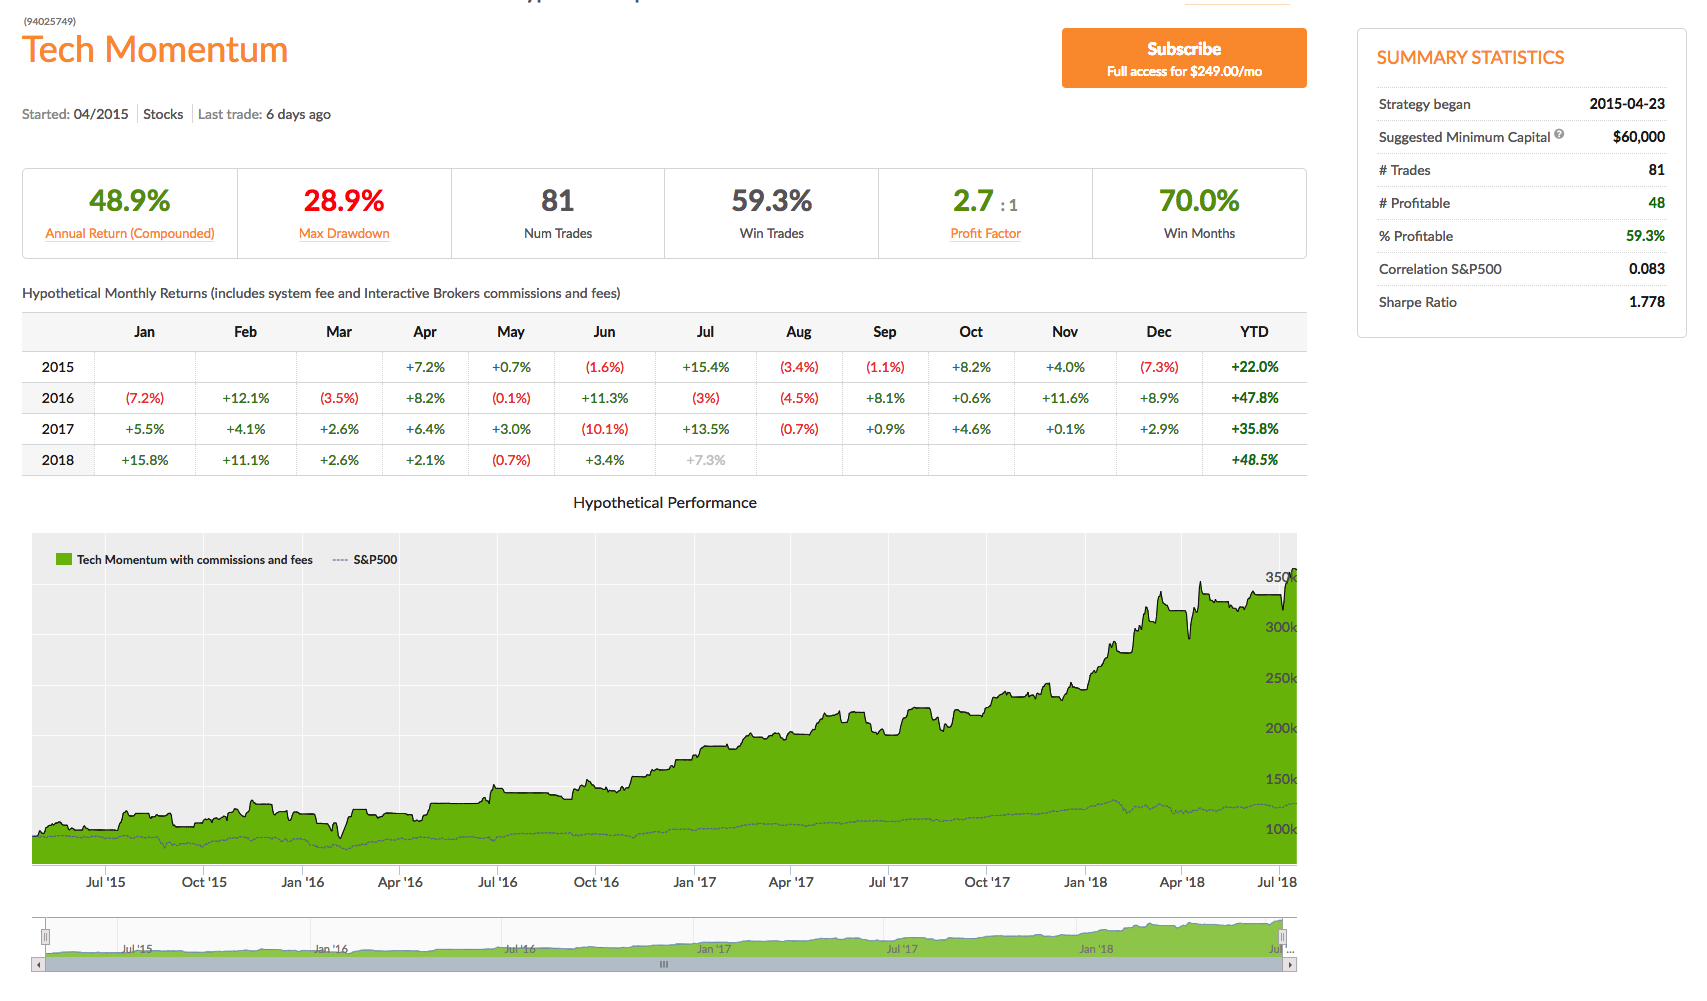
A characteristic of momentum strategies is that they can often be applied successfully across several markets, usually with simple tweaks to the strategy parameters. As a case in point, take our Tech Momentum strategy, listed on the Systematic Strategies Algotrading platform which you can find out more about here:

This swing trading strategy applies similar momentum concepts to exploits long and short momentum effects in technology sector ETFs, focusing on the PROSHARES ULTRAPRO QQQ (TQQQ) and PROSHARES ULTRAPRO SHORT QQQ (SQQQ). Does it work? The results speak for themselves:

In four years of live trading the strategy has produced a compound annual return of 48.9%, with a Sharpe Ratio of 1.78 and Sortino Ratio of 2.98. 2018 is proving to be a banner year for the strategy, which is up by more than 48% YTD.

A very attractive feature of this momentum approach is that it is almost completely uncorrelated with the market and with a beta of just over 1 is hardly more risky than the market portfolio.

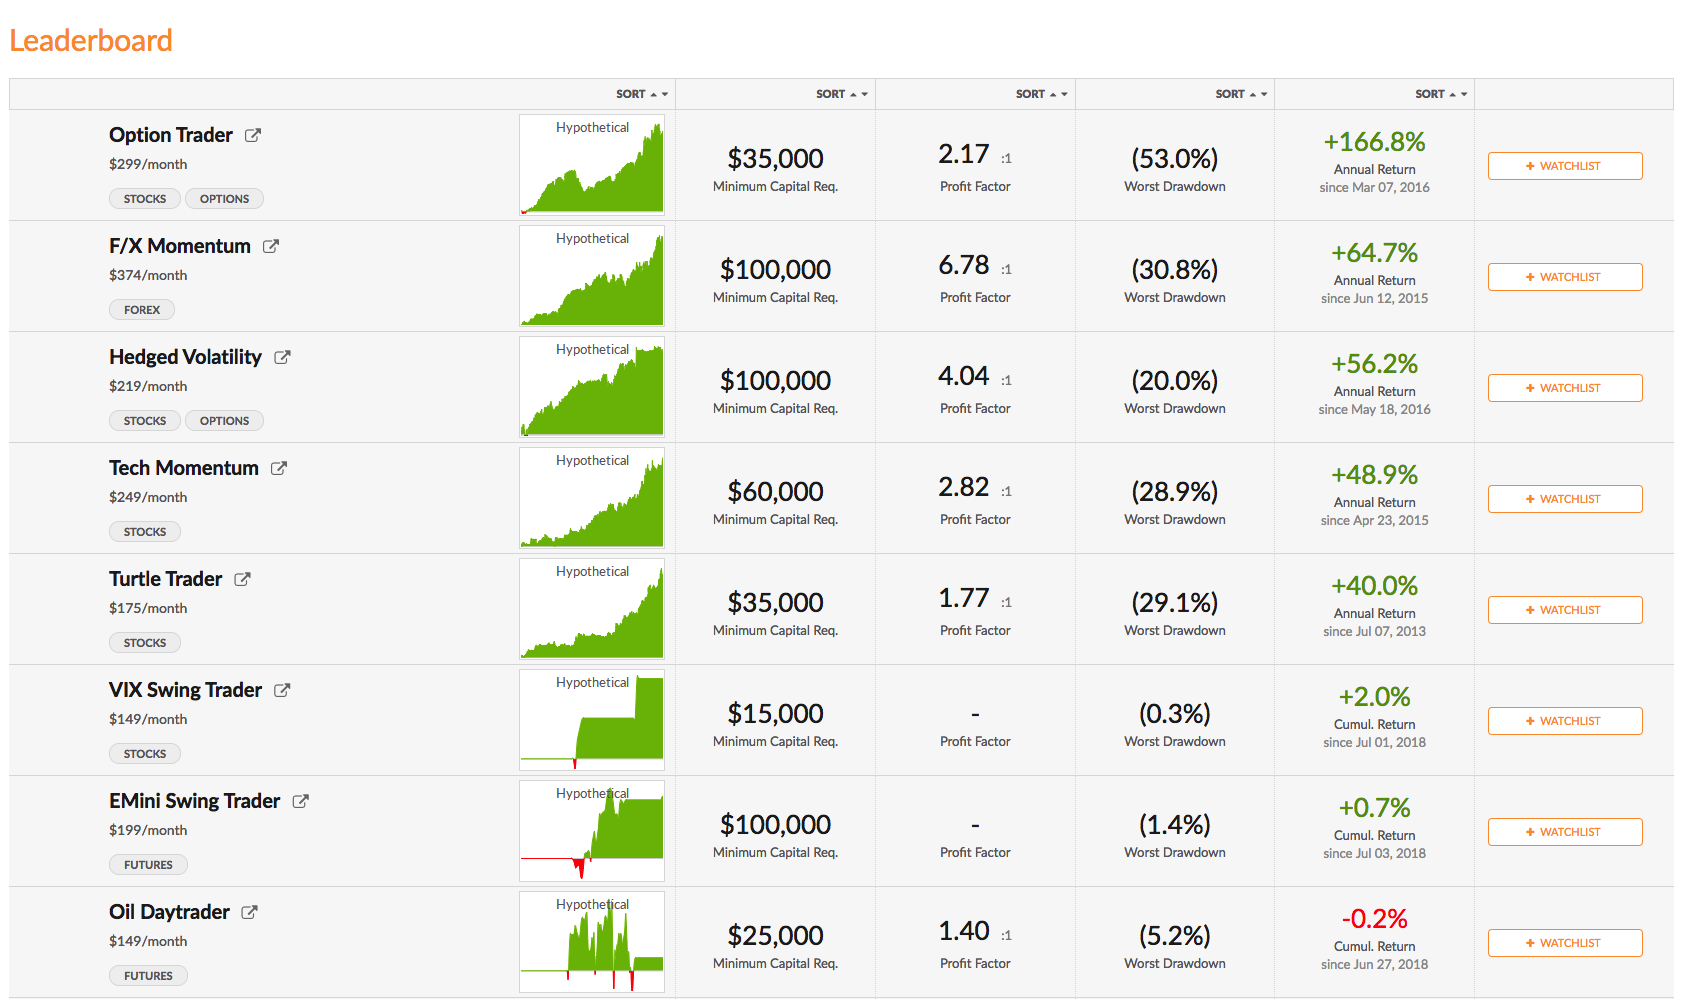
You can find out more about the Tech Momentum and other momentum strategies and how to trade them live in your own account on our Strategy Leaderboard:

A Tactical Equity Strategy

We have created a long-only equity strategy that aims to beat the S&P 500 total return benchmark by using tactical allocation algorithms to invest in equity ETFs.   One of the principal goals of the strategy is to protect investors’ capital during periods of severe market stress such as in the downturns of 2000 and 2008.  The strategy times the allocation of capital to equity ETFs or short-duration Treasury securities when investment opportunities are limited.

SSALGOTRADING AD

Systematic Strategies is a hedge fund rather than an RIA, so we have no plans to offer the product to the public.  However, we are currently holding exploratory discussions with Registered Investment Advisors about how the strategy might be made available to their clients.

For more background, see this post on Seeking Alpha: http://tiny.cc/ba3kny


Slide1


Slide2

Tactical Mutual Fund Strategies

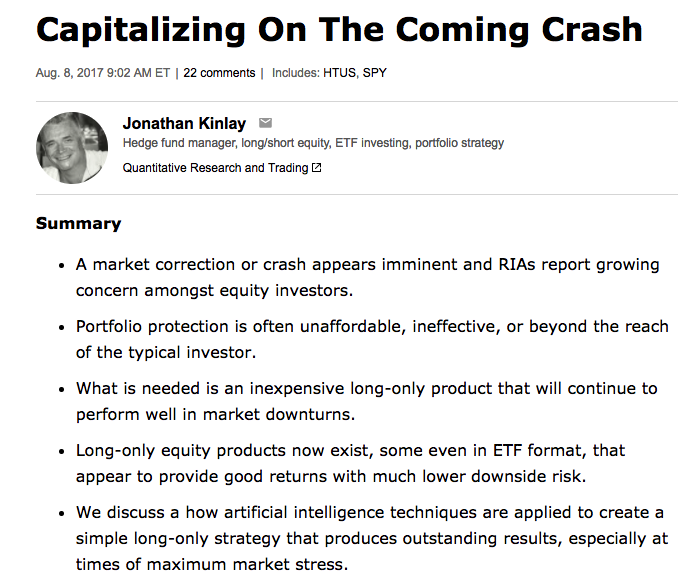
A recent blog post of mine was posted on Seeking Alpha (see summary below if you missed it).

Capital

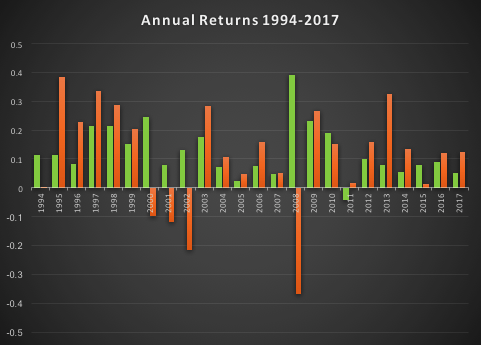
The essence of the idea is simply that one can design long-only, tactical market timing strategies that perform robustly during market downturns, or which may even be positively correlated with volatility.  I used the example of a LOMT (“Long-Only Market-Timing”) strategy that switches between the SPY ETF and 91-Day T-Bills, depending on the current outlook for the market as characterized by machine learning algorithms.  As I indicated in the article, the LOMT handily outperforms the buy-and-hold strategy over the period from 1994 -2017 by several hundred basis points:

Fig6


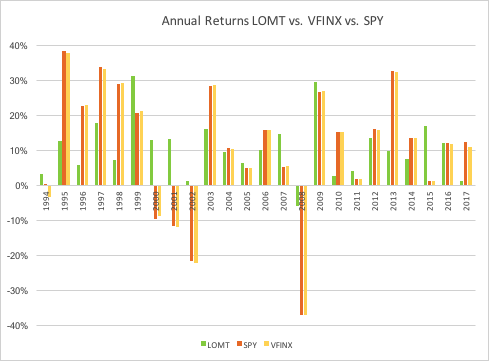
Of particular note is the robustness of the LOMT strategy performance during the market crashes in 2000/01 and 2008, as well as the correction in 2015:


Fig7


The Pros and Cons of Market Timing (aka “Tactical”) Strategies

One of the popular choices the investor concerned about downsize risk is to use put options (or put spreads) to hedge some of the market exposure.  The problem, of course, is that the cost of the hedge acts as a drag on performance, which may be reduced by several hundred basis points annually, depending on market volatility.    Trying to decide when to use option insurance and when to maintain full market exposure is just another variation on the market timing problem.

The point of tactical strategies is that, unlike an option hedge, they will continue to produce positive returns – albeit at a lower rate than the market portfolio – during periods when markets are benign, while at the same time offering much superior returns during market declines, or crashes.   If the investor is concerned about the lower rate of return he is likely to achieve during normal years, the answer is to make use of leverage.

SSALGOTRADING AD

Market timing strategies like Hull Tactical or the LOMT have higher risk-adjusted rates of return (Sharpe Ratios) than the market portfolio.  So the investor can make use of margin money to scale up his investment to about the same level of risk as the market index.  In doing so he will expect to earn a much higher rate of return than the market.

This is easy to do with products like LOMT or Hull Tactical, because they make use of marginable securities such as ETFs.   As I point out in the sections following, one of the shortcomings of applying the market timing approach to mutual funds, however, is that they are not marginable (not initially, at least), so the possibilities for using leverage are severely restricted.

Market Timing with Mutual Funds

An interesting suggestion from one Seeking Alpha reader was to apply the LOMT approach to the Vanguard 500 Index Investor fund (VFINX), which has a rather longer history than the SPY ETF.  Unfortunately, I only have ready access to data from 1994, but nonetheless applied the LOMT model over that time period.  This is an interesting challenge, since none of the VFINX data was used in the actual construction of the LOMT model.  The fact that the VFINX series is highly correlated with SPY is not the issue – it is typically the case that strategies developed for one asset will fail when applied to a second, correlated asset.  So, while it is perhaps hard to argue that the entire VFIX is out-of-sample, the performance of the strategy when applied to that series will serve to confirm (or otherwise) the robustness and general applicability of the algorithm.

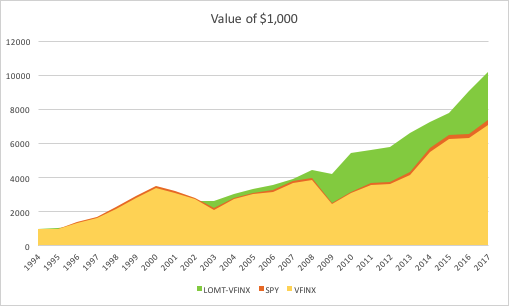
The results turn out as follows:


Fig21


Fig22


Fig23


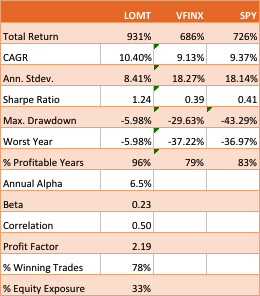
The performance of the LOMT strategy implemented for VFINX handily outperforms the buy-and-hold portfolios in the SPY ETF and VFINX mutual fund, both in terms of return (CAGR) and well as risk, since strategy volatility is less than half that of buy-and-hold.  Consequently the risk adjusted return (Sharpe Ratio) is around 3x higher.

That said, the VFINX variation of LOMT is distinctly inferior to the original version implemented in the SPY ETF, for which the trading algorithm was originally designed.   Of particular significance in this context is that the SPY version of the LOMT strategy produces substantial gains during the market crash of 2008, whereas the VFINX version of the market timing strategy results in a small loss for that year.  More generally, the SPY-LOMT strategy has a higher Sortino Ratio than the mutual fund timing strategy, a further indication of its superior ability to manage  downside risk.

Given that the objective is to design long-only strategies that perform well in market downturns, one need not pursue this particular example much further , since it is already clear that the LOMT strategy using SPY is superior in terms of risk and return characteristics to the mutual fund alternative.

Practical Limitations

There are other, practical issues with apply an algorithmic trading strategy a mutual fund product like VFINX. To begin with, the mutual fund prices series contains no open/high/low prices, or volume data, which are often used by trading algorithms.  Then there are the execution issues:  funds can only be purchased or sold at market prices, whereas many algorithmic trading systems use other order types to enter and exit positions (stop and limit orders being common alternatives). You can’t sell short and  there are restrictions on the frequency of trading of mutual funds and penalties for early redemption.  And sales loads are often substantial (3% to 5% is not uncommon), so investors have to find a broker that lists the selected funds as no-load for the strategy to make economic sense.  Finally, mutual funds are often treated by the broker as ineligible for margin for an initial period (30 days, typically), which prevents the investor from leveraging his investment in the way that he do can quite easily using ETFs.

For these reasons one typically does not expect a trading strategy formulated using a stock or ETF product to transfer easily to another asset class.  The fact that the SPY-LOMT strategy appears to work successfully on the VFINX mutual fund product  (on paper, at least) is highly unusual and speaks to the robustness of the methodology.  But one would be ill-advised to seek to implement the strategy in that way.  In almost all cases a better result will be produced by developing a strategy designed for the specific asset (class) one has in mind.

A Tactical Trading Strategy for the VFINX Mutual Fund

A better outcome can possibly be achieved by developing a market timing strategy designed specifically for the VFINX mutual fund.  This strategy uses only market orders to enter and exit positions and attempts to address the issue of frequent trading by applying a trading cost to simulate the fees that typically apply in such situations.  The results, net of imputed fees, for the period from 1994-2017 are summarized as follows:


Fig24


Fig18

Overall, the CAGR of the tactical strategy is around 88 basis points higher, per annum.  The risk-adjusted rate of return (Sharpe Ratio) is not as high as for the LOMT-SPY strategy, since the annual volatility is almost double.  But, as I have already pointed out, there are unanswered questions about the practicality of implementing the latter for the VFINX, given that it seeks to enter trades using limit orders, which do not exist in the mutual fund world.

The performance of the tactical-VFINX strategy relative to the VFINX fund falls into three distinct periods: under-performance in the period from 1994-2002, about equal performance in the period 2003-2008, and superior relative performance in the period from 2008-2017.

Only the data from 1/19934 to 3/2008 were used in the construction of the model.  Data in the period from 3/2008 to 11/2012 were used for testing, while the results for 12/2012 to 8/2017 are entirely out-of-sample. In other words, the great majority of the period of superior performance for the tactical strategy was out-of-sample.  The chief reason for the improved performance of the tactical-VFINX strategy is the lower drawdown suffered during the financial crisis of 2008, compared to the benchmark VFINX fund.  Using market-timing algorithms, the tactical strategy was able identify the downturn as it occurred and exit the market.  This is quite impressive since, as perviously indicated, none of the data from that 2008 financial crisis was used in the construction of the model.

In his Seeking Alpha article “Alpha-Winning Stars of the Bull Market“, Brad Zigler identifies the handful of funds that have outperformed the VFINX benchmark since 2009, generating positive alpha:

Fig20


What is notable is that the annual alpha of the tactical-VINFX strategy, at 1.69%, is higher than any of those identified by Zigler as being “exceptional”. Furthermore, the annual R-squared of the tactical strategy is higher than four of the seven funds on Zigler’s All-Star list.   Based on Zigler’s performance metrics, the tactical VFINX strategy would be one of the top performing active funds.

But there is another element missing from the assessment. In the analysis so far we have assumed that in periods when the tactical strategy disinvests from the VFINX fund the proceeds are simply held in cash, at zero interest.  In practice, of course, we would invest any proceeds in risk-free assets such as Treasury Bills.   This would further boost the performance of the strategy, by several tens of basis points per annum, without any increase in volatility.  In other words, the annual CAGR and annual Alpha, are likely to be greater than indicated here.

Robustness Testing

One of the concerns with any backtest – even one with a lengthy out-of-sample period, as here – is that one is evaluating only a single sample path from the price process.  Different evolutions could have produced radically different outcomes in the past, or in future. To assess the robustness of the strategy we apply Monte Carlo simulation techniques to generate a large number of different sample paths for the price process and evaluate the performance of the strategy in each scenario.

Three different types of random variation are factored into this assessment:

  1. We allow the observed prices to fluctuate by +/- 30% with a probability of about 1/3 (so, roughly, every three days the fund price will be adjusted up or down by that up to that percentage).
  2. Strategy parameters are permitted to fluctuate by the same amount and with the same probability.  This ensures that we haven’t over-optimized the strategy with the selected parameters.
  3. Finally, we randomize the start date of the strategy by up to a year.  This reduces the risk of basing the assessment on the outcome from encountering a lucky (or unlucky) period, during which the market may be in a strong trend, for example.

In the chart below we illustrate the outcome from around 1,000 such randomized sample paths, from which it can be seen that the strategy performance is robust and consistent.

Fig 19


Limitations to the Testing Procedure

We have identified one way in which this assessment understates the performance of the tactical-VFINX strategy:  by failing to take into account the uplift in returns from investing in interest-bearing Treasury securities, rather than cash, at times when the strategy is out of the market.  So it is only reasonable to point out other limitations to the test procedure that may paint a too-optimistic picture.

The key consideration here is the frequency of trading.  On average, the tactical-VFINX strategy trades around twice a month, which is more than normally permitted for mutual funds.  Certainly, we have factored in additional trading costs to account for early redemptions charges. But the question is whether or not the strategy would be permitted to trade at such frequency, even with the payment of additional fees.  If not, then the strategy would have to be re-tooled to work on long average holding periods, no doubt adversely affecting its performance.

Conclusion

The purpose of this analysis was to assess whether, in principle, it is possible to construct a market timing strategy that is capable of outperforming a VFINX fund benchmark.  The answer appears to be in the affirmative.  However, several practical issues remain to be addressed before such a strategy could be put into production successfully.  In general, mutual funds are not ideal vehicles for expressing trading strategies, including tactical market timing strategies.  There are latent inefficiencies in mutual fund markets – the restrictions on trading and penalties for early redemption, to name but two – that create difficulties for active approaches to investing in such products – ETFs are much superior in this regard.  Nonetheless, this study suggest that, in principle, tactical approaches to mutual fund investing may deliver worthwhile benefits to investors, despite the practical challenges.

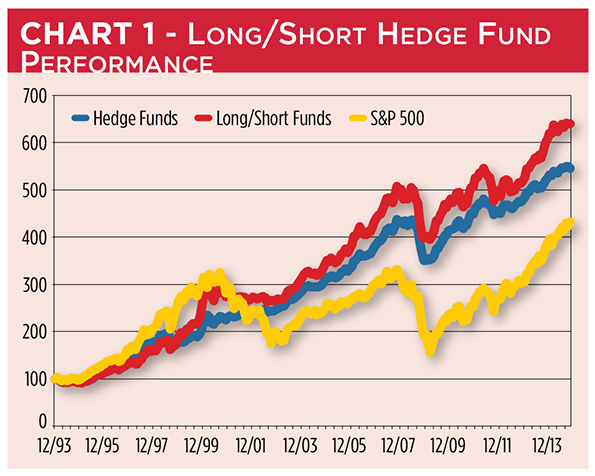
ETFs vs. Hedge Funds – Why Not Combine Both?

Grace Kim, Brand Director at DarcMatter, does a good job of setting out the pros and cons of ETFs vs hedge funds for the family office investor in her LinkedIn post.

She points out that ETFs now offer as much liquidity as hedge funds, both now having around $2.96 trillion in assets.  So, too, are her points well made about the low cost, diversification and ease of investing in ETFs compared to hedge funds.

But, of course, the point of ETF investing is to mimic the return in some underlying market – to gain beta exposure, in the jargon – whereas hedge fund investing is all about alpha – the incremental return that is achieved over and above the return attributable to market risk factors.

SSALGOTRADING AD

But should an investor be forced to choose between the advantages of diversification and liquidity of ETFs on the one hand and the (supposedly) higher risk-adjusted returns of hedge funds, on the other?  Why not both?

Diversified Long/Short ETF Strategies

In fact, there is nothing whatever to prevent an investment strategist from constructing a hedge fund strategy using ETFs.  Just as one can enjoy the hedging advantages of a long/short equity hedge fund portfolio, so, too, can one employ the same techniques to construct long/short ETF portfolios.  Compared to a standard equity L/S portfolio, an ETF L/S strategy can offer the added benefit of exposure to (or hedge against) additional risk factors, including currency, commodity or interest rate.

For an example of this approach ETF long/short portfolio construction, see my post on Developing Long/Short ETF Strategies.  As I wrote in that article:

My preference for ETFs is due primarily to the fact that  it is easier to achieve a wide diversification in the portfolio with a more limited number of securities: trading just a handful of ETFs one can easily gain exposure, not only to the US equity market, but also international equity markets, currencies, real estate, metals and commodities.

More Exotic Hedge Fund Strategies with ETFs

But why stop at vanilla long/short strategies?  ETFs are so varied in terms of the underlying index, leverage and directional bias that one can easily construct much more sophisticated strategies capable of tapping the most obscure sources of alpha.

Take our very own Volatility ETF strategy for example.  The strategy constructs hedged positions, not by being long/short, but by being short/short or long/long volatility and inverse volatility products, like SVXY and UVXY, or VXX and XIV.  The strategy combines not only strategic sources of alpha that arise from factors such as convexity in the levered ETF products, but also short term alpha signals arising from temporary misalignments in the relative value of comparable ETF products.  These can be exploited by tactical, daytrading algorithms of a kind more commonly applied in the context of high frequency trading.

For more on this see for example Investing in Levered ETFs – Theory and Practice.

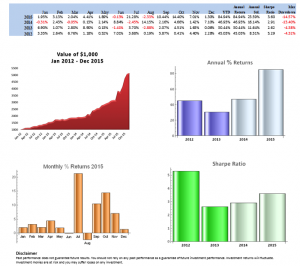
Does the approach work?  On the basis that a picture is worth a thousand words, let me answer that question as follows:

Systematic Strategies Volatility ETF Strategy

Perf Summary Dec 2015

Conclusion

There is no reason why, in considering the menu of ETF and hedge fund strategies, it should be a case of either-or.  Investors can combine the liquidity, cost and diversification advantages of ETFs with the alpha generation capabilities of well-constructed hedge fund strategies.

Investing in Leveraged ETFs – Theory and Practice

Summary

Leveraged ETFs suffer from decay, or “beta slippage.” Researchers have attempted to exploit this effect by shorting pairs of long and inverse leveraged ETFs.

The results of these strategies look good if you assume continuous compounding, but are often poor when less frequent compounding is assumed.

In reality, the trading losses incurred in rebalancing the portfolio, which requires you to sell low and buy high, overwhelm any benefit from decay, making the strategies unprofitable in practice.

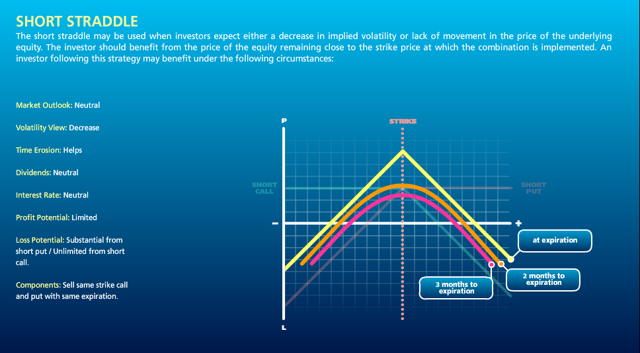
A short levered ETF strategy has similar characteristics to a short straddle option position, with positive Theta and negative Gamma, and will experience periodic, large drawdowns.

It is possible to develop leveraged ETF strategies producing high returns and Sharpe ratios with relative value techniques commonly used in option trading strategies.

SSALGOTRADING AD

Decay in Leveraged ETFs

Leveraged ETFs continue to be much discussed on Seeking Alpha.

One aspect in particular that has caught analysts’ attention is the decay, or “beta slippage” that leveraged ETFs tend to suffer from.

Seeking Alpha contributor Fred Picard in a 2013 article (“What You Need To Know About The Decay Of Leveraged ETFs“) described the effect using the following hypothetical example:

To understand what is beta-slippage, imagine a very volatile asset that goes up 25% one day and down 20% the day after. A perfect double leveraged ETF goes up 50% the first day and down 40% the second day. On the close of the second day, the underlying asset is back to its initial price:

(1 + 0.25) x (1 – 0.2) = 1

And the perfect leveraged ETF?

(1 + 0.5) x (1 – 0.4) = 0.9

Nothing has changed for the underlying asset, and 10% of your money has disappeared. Beta-slippage is not a scam. It is the normal mathematical behavior of a leveraged and rebalanced portfolio. In case you manage a leveraged portfolio and rebalance it on a regular basis, you create your own beta-slippage. The previous example is simple, but beta-slippage is not simple. It cannot be calculated from statistical parameters. It depends on a specific sequence of gains and losses.

Fred goes on to make the point that is the crux of this article, as follows:

At this point, I’m sure that some smart readers have seen an opportunity: if we lose money on the long side, we make a profit on the short side, right?

Shorting Leveraged ETFs

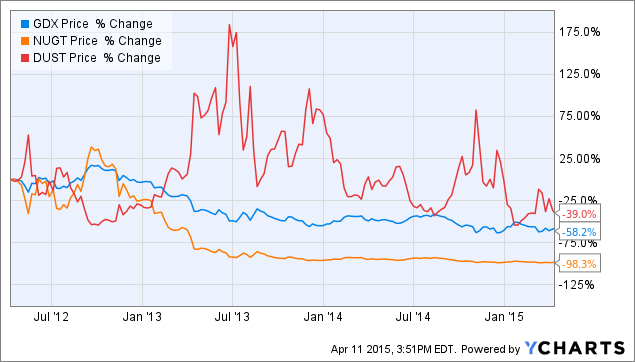
Taking his cue from Fred’s article, Seeking Alpha contributor Stanford Chemist (“Shorting Leveraged ETF Pairs: Easier Said Than Done“) considers the outcome of shorting pairs of leveraged ETFs, including the Market Vectors Gold Miners ETF (NYSEARCA:GDX), the Direxion Daily Gold Miners Bull 3X Shares ETF (NYSEARCA:NUGT) and the Direxion Daily Gold Miners Bear 3X Shares ETF (NYSEARCA:DUST).

His initial finding appears promising:

Therefore, investing $10,000 each into short positions of NUGT and DUST would have generated a profit of $9,830 for NUGT, and $3,900 for DUST, good for an average profit of 68.7% over 3 years, or 22.9% annualized.

At first sight, this appears to a nearly risk-free strategy; after all, you are shorting both the 3X leveraged bull and 3X leveraged bear funds, which should result in a market neutral position. Is there easy money to be made?

Source: Standford Chemist

Not so fast! Stanford Chemist applies the same strategy to another ETF pair, with a very different outcome:

“What if you had instead invested $10,000 each into short positions of the Direxion Russell 1000 Financials Bullish 3X ETF (NYSEARCA:FAS) and the Direxion Russell 1000 Financials Bearish 3X ETF (NYSEARCA:FAZ)?

The $10,000 short position in FAZ would have gained you $8,680. However, this would have been dwarfed by the $28,350 loss that you would have sustained in shorting FAS. In total, you would be down $19,670, which translates into a loss of 196.7% over three years, or 65.6% annualized.

No free lunch there.

The Rebalancing Issue

Stanford Chemist puts his finger on one of the key issues: rebalancing. He explains as follows:

So what happened to the FAS-FAZ pair? Essentially, what transpired was that as the underlying asset XLF increased in value, the two short positions became unbalanced. The losing side (short FAS) ballooned in size, making further losses more severe. On the other hand, the winning side (short FAZ) shrunk, muting the effect of further gains.

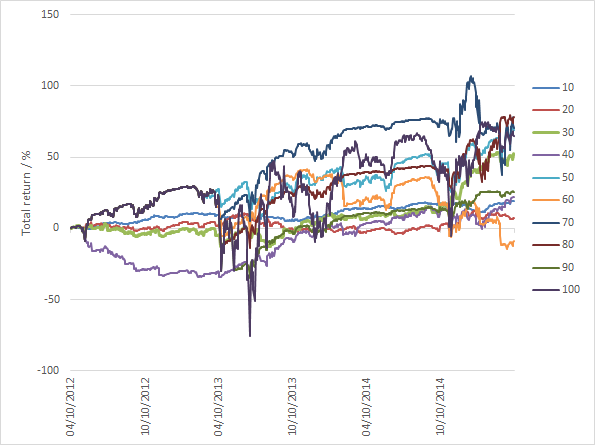
To counteract this effect, the portfolio needs to be rebalanced. Stanford Chemist looks at the implications of rebalancing a short NUGT-DUST portfolio whenever the market value of either ETF deviates by more than N% from its average value, where he considers N% in the range from 10% to 100%, in increments of 10%.

While the annual portfolio return was positive in all but one of these scenarios, there was very considerable variation in the outcomes, with several of the rebalanced portfolios suffering very large drawdowns of as much as 75%:

Source: Stanford Chemist

The author concludes:

The results of the backtest showed that profiting from this strategy is easier said than done. The total return performances of the strategy over the past three years was highly dependent on the rebalancing thresholds chosen. Unfortunately, there was also no clear correlation between the rebalancing period used and the total return performance. Moreover, the total return profiles showed that large drawdowns do occur, meaning that despite being ostensibly “market neutral”, this strategy still bears a significant amount of risk.

Leveraged ETF Pairs – Four Case Studies

Let’s press pause here and review a little financial theory. As you recall, it is possible to express a rate of return in many different ways, depending on how interest is compounded. The most typical case is daily compounding:

R = (Pt – Pt-1) / Pt

Where Pt is the price on day t, and Pt-1 is the price on day t-1, one day prior.

Another commonly used alternative is continuous compounding, also sometimes called log-returns:

R = Ln(Pt) – Ln(Pt-1)

Where Ln(Pt) is the natural log of the price on day t, Pt

When a writer refers to a rate of return, he should make clear what compounding basis the return rate is quoted on, whether continuous, daily, monthly or some other frequency. Usually, however, the compounding basis is clear from the context. Besides, it often doesn’t make a large difference anyway. But with leveraged ETFs, even microscopic differences can produce substantially different outcomes.

I will illustrate the effect of compounding by reference to examples of portfolios comprising short positions in the following representative pairs of leveraged ETFs:

  • Direxion Daily Energy Bull 3X Shares ETF (NYSEARCA:ERX)
  • Direxion Daily Energy Bear 3X Shares ETF (NYSEARCA:ERY)
  • Direxion Daily Gold Miners Bull 3X ETF
  • Direxion Daily Gold Miners Bear 3X ETF
  • Direxion Daily S&P 500 Bull 3X Shares ETF (NYSEARCA:SPXL)
  • Direxion Daily S&P 500 Bear 3X Shares ETF (NYSEARCA:SPXS)
  • Direxion Daily Small Cap Bull 3X ETF (NYSEARCA:TNA)
  • Direxion Daily Small Cap Bear 3X ETF (NYSEARCA:TZA)

The findings in relation to these pairs are mirrored by results for other leveraged ETF pairs.

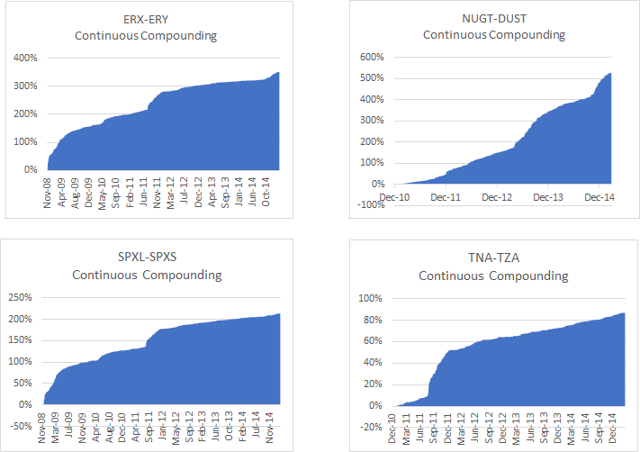
First, let’s look the returns in the ETF portfolios measured using continuous compounding.

Source: Yahoo! Finance

The portfolio returns look very impressive, with CAGRs ranging from around 20% for the short TNA-TZA pair, to over 124% for the short NUGT-DUST pair. Sharpe ratios, too, appear abnormally large, ranging from 4.5 for the ERX-ERY short pair to 8.4 for NUGT-DUST.

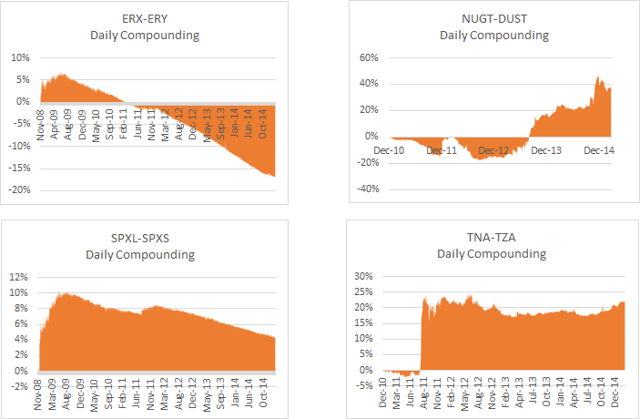
Now let’s look at the performance of the same portfolios measured using daily compounding.

Source: Yahoo! Finance

It’s an altogether different picture. None of the portfolios demonstrate an attract performance record and indeed in two cases the CAGR is negative.

What’s going on?

Stock Loan Costs

Before providing the explanation, let’s just get one important detail out of the way. Since you are shorting both legs of the ETF pairs, you will be faced with paying stock borrow costs. Borrow costs for leveraged ETFs can be substantial and depending on market conditions amount to as much as 10% per annum, or more.

In computing the portfolio returns in both the continuous and daily compounding scenarios I have deducted annual stock borrow costs based on recent average quotes from Interactive Brokers, as follows:

  • ERX-ERY: 14%
  • NUGT-DUST: 16%
  • SXPL-SPXS: 8%
  • TNA-TZA: 8%

It’s All About Compounding and Rebalancing

The implicit assumption in the computation of the daily compounded returns shown above is that you are rebalancing the portfolios each day. That is to say, it is assumed that at the end of each day you buy or sell sufficient quantities of shares of each ETF to maintain an equal $ value in both legs.

In the case of continuously compounded returns the assumption you are making is that you maintain an equal $ value in both legs of the portfolio at every instant. Clearly that is impossible.

Ok, so if the results from low frequency rebalancing are poor, while the results for instantaneous rebalancing are excellent, it is surely just a question of rebalancing the portfolio as frequently as is practically possible. While we may not be able to achieve the ideal result from continuous rebalancing, the results we can achieve in practice will reflect how close we can come to that ideal, right?

Unfortunately, not.

Because, while we have accounted for stock borrow costs, what we have ignored in the analysis so far are transaction costs.

Transaction Costs

With daily rebalancing transaction costs are unlikely to be a critical factor – one might execute a single trade towards the end of the trading session. But in the continuous case, it’s a different matter altogether.

Let’s use the SPXL-SPXS pair as an illustration. When the S&P 500 index declines, the value of the SPXL ETF will fall, while the value of the SPXS ETF will rise. In order to maintain the same $ value in both legs you will need to sell more shares in SPXL and buy back some shares in SPXS. If the market trades up, SPXL will increase in value, while the price of SPXS will fall, requiring you to buy back some SPXL shares and sell more SPXS.

In other words, to rebalance the portfolio you will always be trying to sell the ETF that has declined in price, while attempting to buy the inverse ETF that has appreciated. It is often very difficult to execute a sale in a declining stock at the offer price, or buy an advancing stock at the inside bid. To be sure of completing the required rebalancing of the portfolio, you are going to have to buy at the ask price and sell at the bid price, paying the bid-offer spread each time.

Spreads in leveraged ETF products tend to be large, often several pennies. The cumulative effect of repeatedly paying the bid-ask spread, while taking trading losses on shares sold at the low or bought at the high, will be sufficient to overwhelm the return you might otherwise hope to make from the ETF decay.

And that’s assuming the best case scenario that shares are always available to short. Often they may not be: so that, if the market trades down and you need to sell more SPXL, there may be none available and you will be unable to rebalance your portfolio, even if you were willing to pay the additional stock loan costs and bid-ask spread.

A Lose-Lose Proposition

So, in summary: if you rebalance infrequently you will avoid excessive transaction costs; but the $ imbalance that accrues over the course of a trading day will introduce a market bias in the portfolio. That can hurt portfolio returns very badly if you get caught on the wrong side of a major market move. The results from daily rebalancing for the illustrative pairs shown above indicate that this is likely to happen all too often.

On the other hand, if you try to maintain market neutrality in the portfolio by rebalancing at high frequency, the returns you earn from decay will be eaten up by transaction costs and trading losses, as you continuously sell low and buy high, paying the bid-ask spread each time.

Either way, you lose.

Ok, what about if you reverse the polarity of the portfolio, going long both legs? Won’t that avoid the very high stock borrow costs and put you in a better position as regards the transaction costs involved in rebalancing?

Yes, it will. Because, you will be selling when the market trades up and buying when it falls, making it much easier to avoid paying the bid-ask spread. You will also tend to make short term trading profits by selling high and buying low. Unfortunately, you may not be surprised to learn, these advantages are outweighed by the cost of the decay incurred in both legs of the long ETF portfolio.

In other words: you can expect to lose if you are short; and lose if you are long!

An Analogy from Option Theory

To anyone with a little knowledge of basic option theory, what I have been describing should sound like familiar territory.

Being short the ETF pair is like being short an option (actually a pair of call and put options, called a straddle). You earn decay, or Theta, for those familiar with the jargon, by earning the premium on the options you have sold; but at the risk of being short Gamma – which measures your exposure to a major market move.

Source: Interactive Brokers

You can hedge out the portfolio’s Gamma exposure by trading the underlying securities – the ETF pair in this case – and when you do that you find yourself always having to sell at the low and buy at the high. If the options are fairly priced, the option decay is enough, but not more, to compensate for the hedging cost involved in continuously trading the underlying.

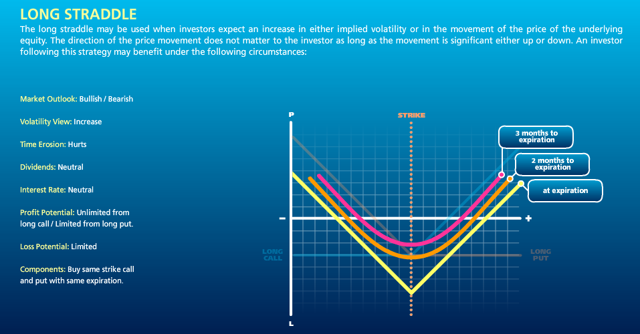
Conversely, being long the ETF pair is like being long a straddle on the underling pair. You now have positive Gamma exposure, so your portfolio will make money from a major market move in either direction. However, the value of the straddle, initially the premium you paid, decays over time at a rate Theta (also known as the “bleed”).

Source: Interactive Brokers

You can offset the bleed by performing what is known as Gamma trading. When the market trades up your portfolio delta becomes positive, i.e. an excess $ value in the long ETF leg, enabling you to rebalance your position by selling excess deltas at the high. Conversely, when the market trades down, your portfolio delta becomes negative and you rebalance by buying the underlying at the current, reduced price. In other words, you sell at the high and buy at the low, typically making money each time. If the straddle is fairly priced, the profits you make from Gamma trading will be sufficient to offset the bleed, but not more.

Typically, the payoff from being short options – being short the ETF pair – will show consistent returns for sustained periods, punctuated by very large losses when the market makes a significant move in either direction.

Conversely, if you are long options – long the ETF pair – you will lose money most of the time due to decay and occasionally make a very large profit.

In an efficient market in which securities are fairly priced, neither long nor short option strategy can be expected to dominate the other in the long run. In fact, transaction costs will tend to produce an adverse outcome in either case! As with most things in life, the house is the player most likely to win.

Developing a Leveraged ETF Strategy that Works

Investors shouldn’t be surprised that it is hard to make money simply by shorting leveraged ETF pairs, just as it is hard to make money by selling options, without risking blowing up your account.

And yet, many traders do trade options and often manage to make substantial profits. In some cases traders are simply selling options, hoping to earn substantial option premiums without taking too great a hit when the market explodes. They may get away with it for many years, before blowing up. Indeed, that has been the case since 2009. But who would want to be an option seller here, with the market at an all-time high? It’s simply far too risky.

The best option traders make money by trading both the long and the short side. Sure, they might lean in one direction or the other, depending on their overall market view and the opportunities they find. But they are always hedged, to some degree. In essence what many option traders seek to do is what is known as relative value trading – selling options they regard as expensive, while hedging with options they see as being underpriced. Put another way, relative value traders try to buy cheap Gamma and sell expensive Theta.

This is how one can thread the needle in leveraged ETF strategies. You can’t hope to make money simply by being long or short all the time – you need to create a long/short ETF portfolio in which the decay in the ETFs you are short is greater than in the ETFs you are long. Such a strategy is, necessarily, tactical: your portfolio holdings and net exposure will likely change from long to short, or vice versa, as market conditions shift. There will be times when you will use leverage to increase your market exposure and occasions when you want to reduce it, even to the point of exiting the market altogether.

If that sounds rather complicated, I’m afraid it is. I have been developing and trading arbitrage strategies of this kind since the early 2000s, often using sophisticated option pricing models. In 2012 I began trading a volatility strategy in ETFs, using a variety of volatility ETF products, in combination with equity and volatility index futures.

I have reproduced the results from that strategy below, to give some indication of what is achievable in the ETF space using relative value arbitrage techniques.

Source: Systematic Strategies, LLC

Source: Systematic Strategies LLC

Conclusion

There are no free lunches in the market. The apparent high performance of strategies that engage systematically in shorting leveraged ETFs is an illusion, based on a failure to quantify the full costs of portfolio rebalancing.

The payoff from a short leveraged ETF pair strategy will be comparable to that of a short straddle position, with positive decay (Theta) and negative Gamma (exposure to market moves). Such a strategy will produce positive returns most of the time, punctuated by very large drawdowns.

The short Gamma exposure can be mitigated by continuously rebalancing the portfolio to maintain dollar neutrality. However, this will entail repeatedly buying ETFs as they trade up and selling them as they decline in value. The transaction costs and trading losses involved in continually buying high and selling low will eat up most, if not all, of the value of the decay in the ETF legs.

A better approach to trading ETFs is relative value arbitrage, in which ETFs with high decay rates are sold and hedged by purchases of ETFs with relatively low rates of decay.

An example given of how this approach has been applied successfully in volatility ETFs since 2012.

ETF Pairs Trading with the Kalman Filter

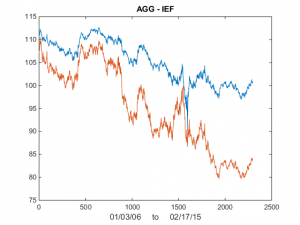
I was asked by a reader if I could illustrate the application of the Kalman Filter technique described in my previous post with an example. Let’s take the ETF pair AGG IEF, using daily data from Jan 2006 to Feb 2015 to estimate the model.  As you can see from the chart in Fig. 1, the pair have been highly correlated over the last several years.

Fig 1Fig 1.  AGG and IEF Daily Prices 2006-2015

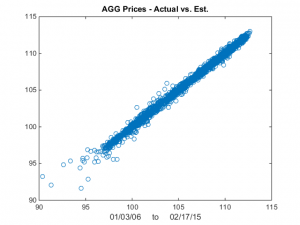
We now estimate the beta-relationship between the ETF pair with the Kalman Filter, using the Matlab code given below, and plot the estimated vs actual prices of the first ETF, AGG in Fig 2.  There are one or two outliers that you might want to take a look at, but mostly the fit looks very good. Fig 2

 Fig 2 – Actual vs Fitted Prices of AGG

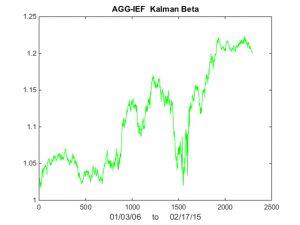
Now lets take a look at Kalman Filter estimates of beta.  As you can see in Fig 3, it wanders around a lot!  Very difficult to handle using some kind of static beta estimate. Fig 3

Fig 3 – Kalman Filter Beta Estimates

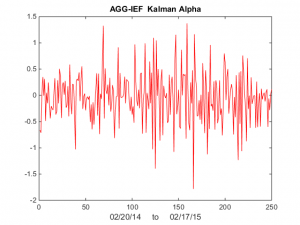
  Finally, we compute the raw and standardized alphas, being the differences between the observed and fitted prices , i.e. Alpha(t) = AGG(t) – b(t)* IEF(t) and kfAlpha(t) = (Alpha(t) – mean(Alpha(t)) / std(Alpha(t)   I have plotted the kfAlpha estimates over the last year in Fig 4.   Fig 4

Fig 4 – Standardized Alpha Estimates

  The last step is to decide how to trade this relationship.  You might, for example, trade the portfolio in proportion to the standardized deviation (i.e. the  size of kfAlpha(t)).  Alternatively, you might set a threshold level, say +/- 1 Sd, and trade the portfolio when  kfAlpha(t) exceeds this the threshold.   In the Matlab code below I use the particle swarm method  to maximize the likelihood.  I have found this to be more reliable than other methods.

Continue reading “ETF Pairs Trading with the Kalman Filter”