Momentum trading strategies span a diverse range of trading ideas. Often they will use indicators to determine the recent underlying trend and try to gauge the strength of the trend using measures of the rate of change in the price of the asset.
One very simple momentum concept, a strategy in S&P500 E-Mini futures, is described in the following blog post:
http://www.quantifiedstrategies.com/buy-when-sp-500-makes-new-intraday-high/
The basic idea is to buy the S&P500 E-Mini futures when the contract makes a new intraday high. This is subject to the qualification that the Internal Bar Strength fall below a selected threshold level. In order words, after a period of short-term weakness – indicated by the low reading of the Internal Bar Strength – we buy when the futures recover to make a new intraday high, suggesting continued forward momentum.
IBS is quite a useful trading indicator, which you can learn more about in these posts:
http://jonathankinlay.com/2016/06/the-internal-bar-strength-indicator/
http://jonathankinlay.com/2016/06/quick-note-internal-bar-strength-stationarity/
I have developed a version of the intraday-high strategy, using parameters to generalize it and allow for strategy optimization. The Easylanguage code for my version of the strategy is as follows:
Inputs:
nContracts(1),
ndaysHigh(5),
IBSlag(1),
IBStrigger(0.15);
Vars:
IBS(0.5);
If H[IBSlag] > L[IBSlag] then
Begin
IBS=(H[IBSlag]-C[IBSlag])/(H[IBSlag]-L[IBSlag]);
end;
If (IBS <= IBStrigger) and (H[0] >= Highest(High, ndaysHigh)) then
begin
Buy nContracts contracts this bar on close;
end;
If C[0] > H[1] then
begin
Sell all contracts this bar on close;
end;
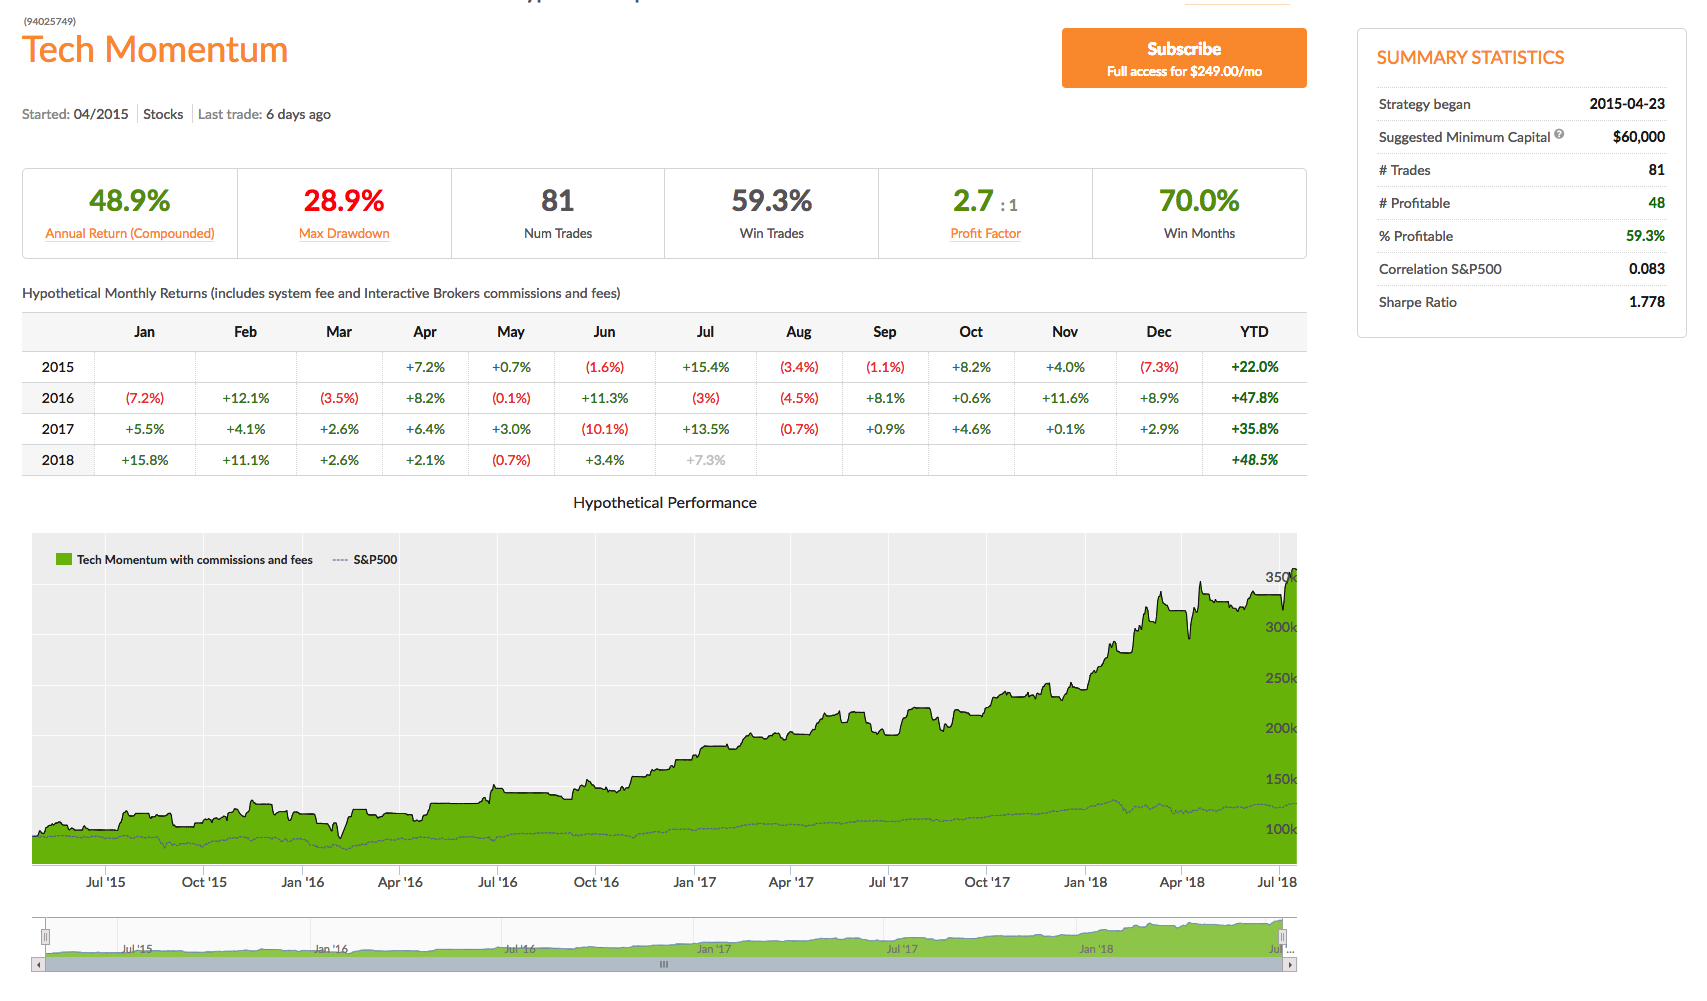
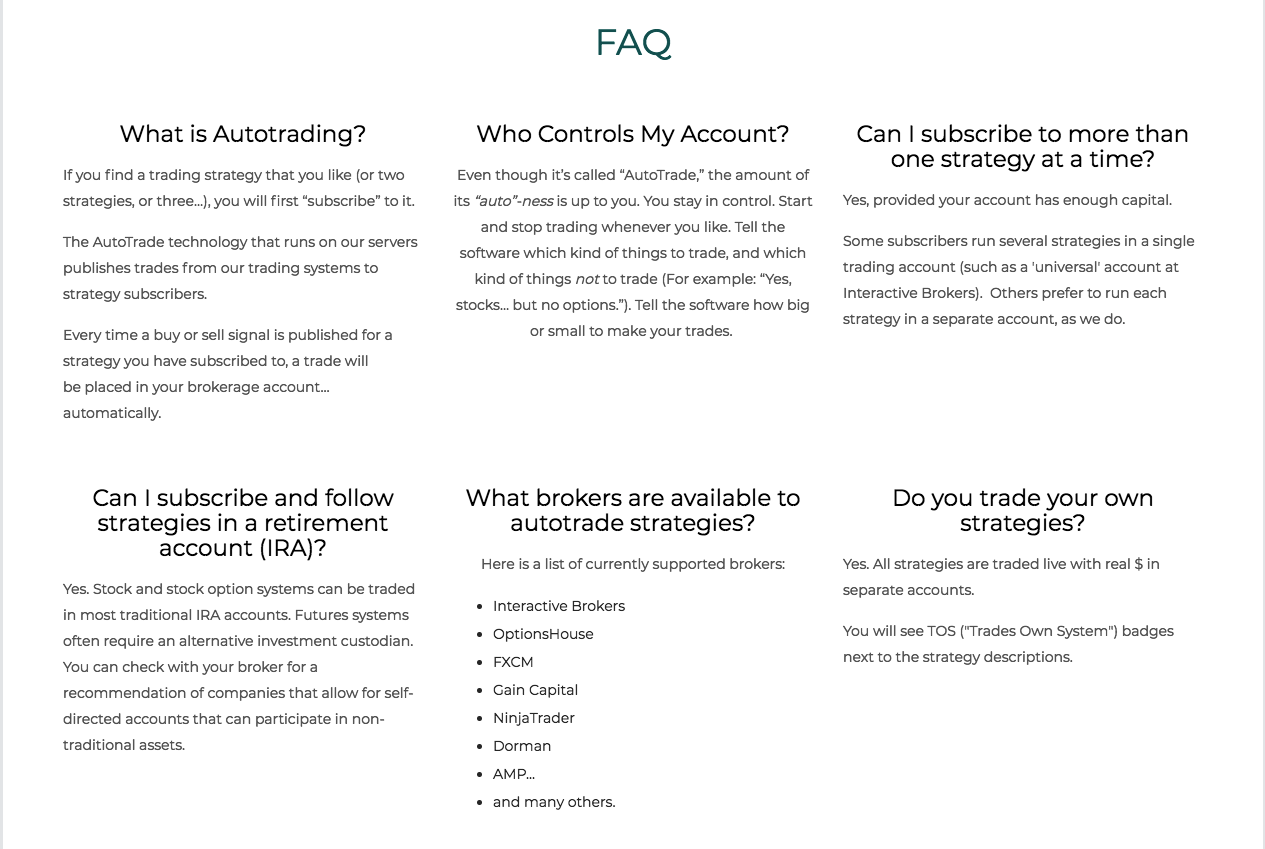
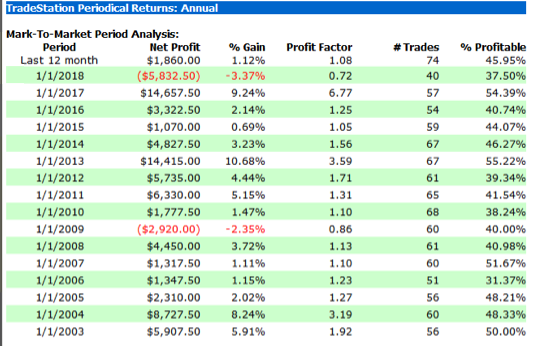
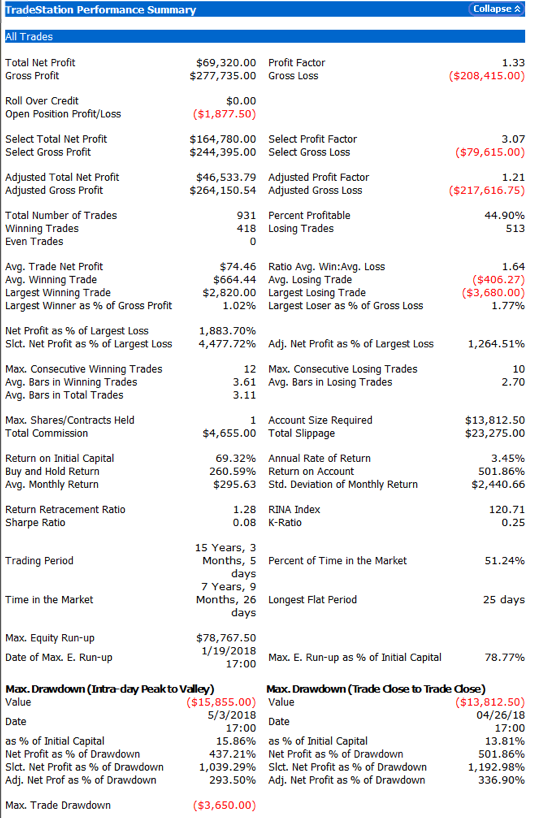
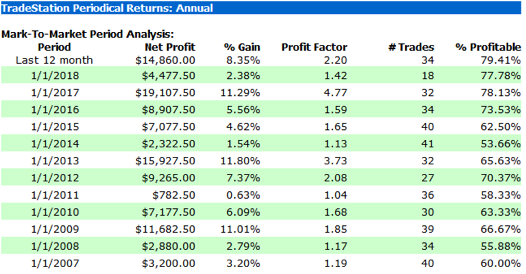
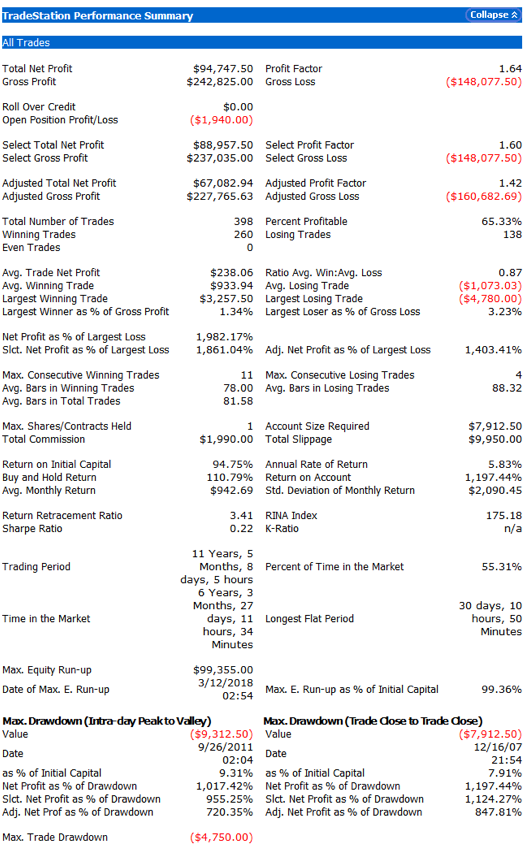
The performance results for the strategy appear quite promising, despite the downturn in strategy profitability in 2018 to date (all performance results are net of slippage and commission):

Robustness Testing with Walk Forward Optimization
We evaluate the robustness of the strategy using the Walk Forward Optimization feature in Tradestation. Walk forward analysis is the process of optimizing a trading system using a limited set of parameters, and then testing the best optimized parameter set on out-of-sample data. This process is similar to how a trader would use an automated trading system in real live trading. The in-sample time window is shifted forward by the period covered by the out-of-sample test, and the process is repeated. At the end of the test, all of the recorded results are used to assess the trading strategy.
In other words, walk forward analysis does optimization on a training set; tests on a period after the set and then rolls it all forward and repeats the process. This gives a larger out-of-sample period and allows the system developer to see how stable the system is over time.
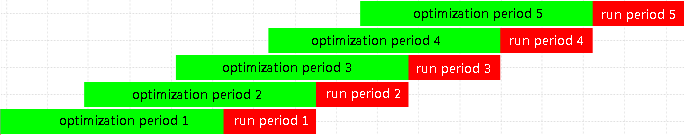
The image below illustrates the walk forward analysis procedure. An optimization is performed over a longer period (the in-sample data), and then the optimized parameter set is tested over a subsequent shorter period (the out-of-sample data). The optimization and testing periods are shifted forward, and the process is repeated until a suitable sample size is achieved.
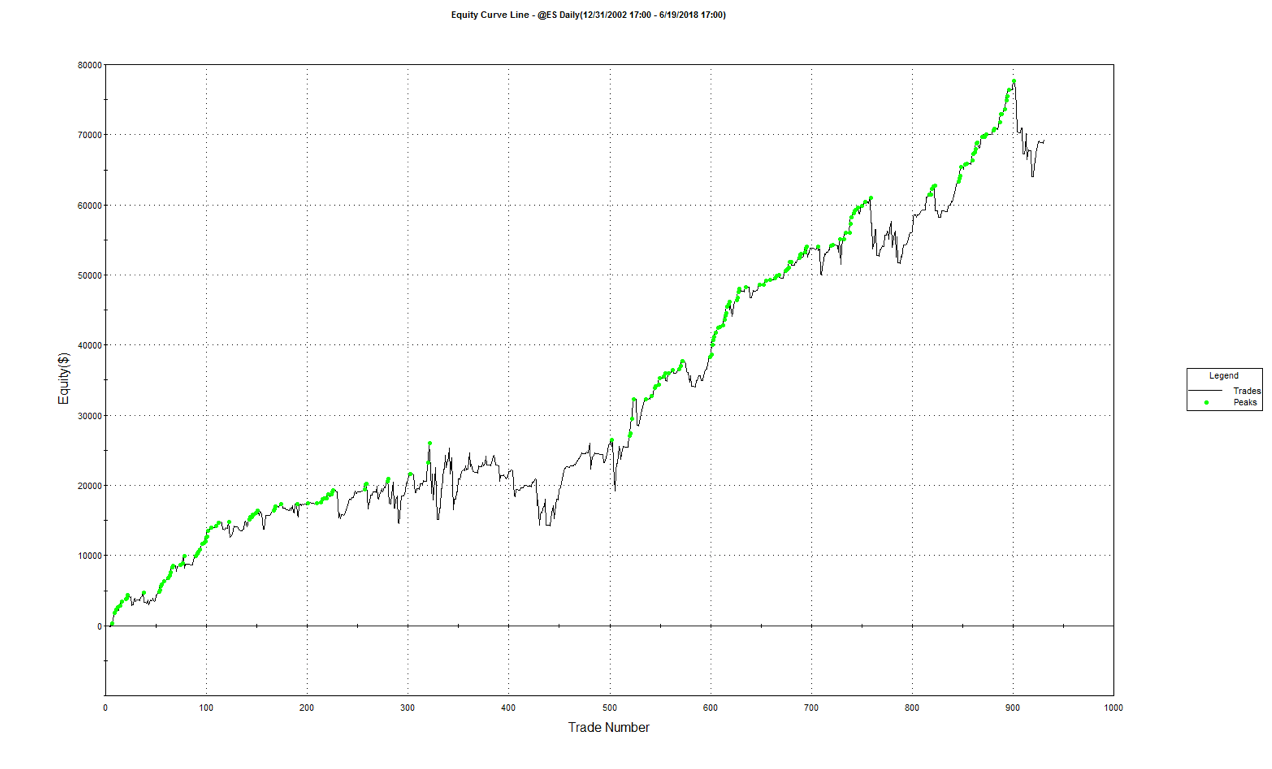
Tradestation enables the user to run a battery of WFO tests, using different size in-sample and out-of-sample sizes and number of runs. The outcome of each test is evaluated on several specific criteria such as the net profit and drawdown and only if the system meets all of the criteria is the test designated as a “Pass”. This gives the analyst a clear sense of the robustness of his strategy across multiple periods and sample sizes.
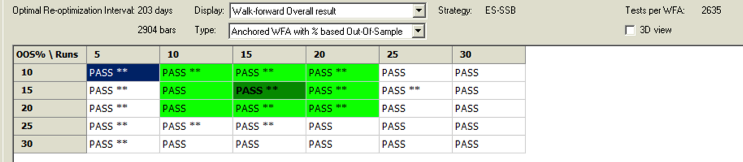
A WFO cluster analysis summary for the momentum strategy is illustrated below. The cluster test is designated as “Failed” overall, since the strategy failed to meet the test criteria for a preponderance of the individual walk-forward tests. The optimal parameters found in each test vary considerably over the sample periods spanning 2003-2018, giving concerns about the robustness of the strategy under changing market conditions.

Improving the Strategy
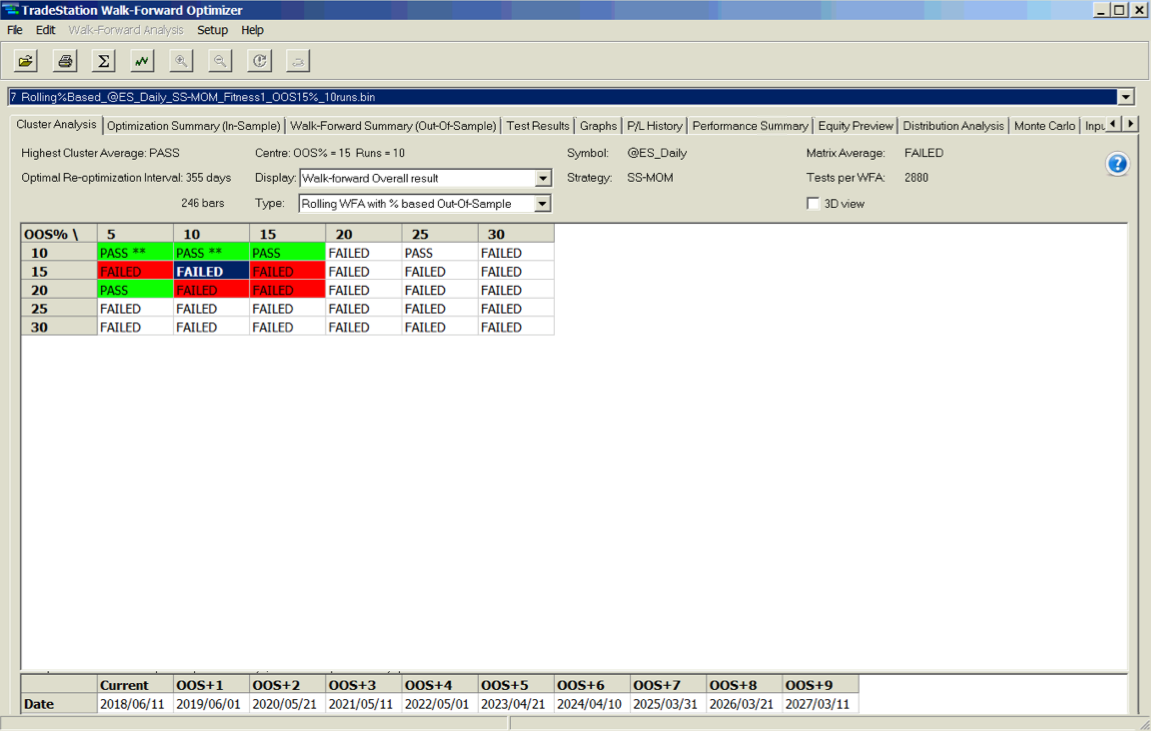
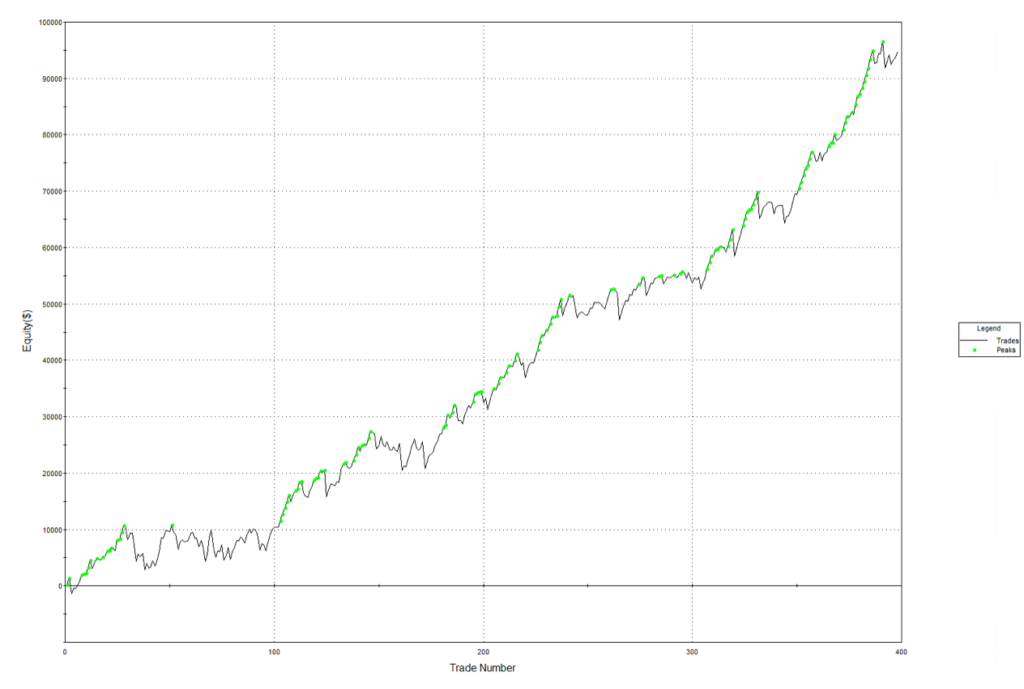
We can improve both the performance and robustness of our simple momentum strategy by combining it with several other trend and momentum indicators. One such example is illustrated in the performance charts and tables below. The strategy has performed well in both bull and bear markets and in both normal and volatile market conditions:
A WFO cluster analysis indicates that the revised momentum strategy is highly robust to the choice of sample size and strategy parameters, as it passes every test in the 30-cell WFO analysis cluster table:
Conclusion
Momentum strategies are well known and easy to develop using standard methodologies, such as the simple indicators used in this example. They tend to work well in most equity index futures markets, and in some commodity markets too. One of their big drawbacks, however, is that they typically go through periods of poor performance and need to be tested thoroughly for robustness in order to ensure satisfactory results under the full range of market conditions.