How to Make Money in a Down Market

The popular VIX blog Vix and More evaluates the performance of the VIX ETFs (actually ETNs) and concludes that all of them lost money in 2015.  Yes, both long volatility and short volatility products lost money!

VIX ETP performance in 2015

Source:  Vix and More

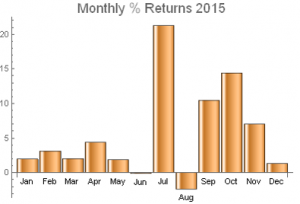
By contrast, our Volatility ETF strategy had an exceptional year in 2015, making money in every month but one:

Monthly Pct Returns

How to Profit in a Down Market

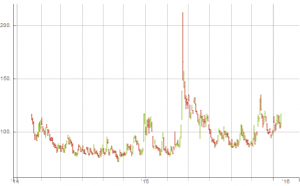
How do you make money when every product you are trading loses money?  Obviously you have to short one or more of them.  But that can be a very dangerous thing to do, especially in a product like the VIX ETNs.  Volatility itself is very volatile – it has an annual volatility (the volatility of volatility, or VVIX) that averages around 100% and which reached a record high of 212% in August 2015.

VVIX

The CBOE VVIX Index

Selling products based on such a volatile instrument can be extremely hazardous – even in a downtrend: the counter-trends are often extremely violent, making a short position challenging to maintain.

Relative value trading is a more conservative approach to the problem.  Here, rather than trading a single product you trade a pair, or basket of them.  Your bet is that the ETFs (or stocks) you are long will outperform the ETFs you are short.  Even if your favored ETFs declines, you can still make money if the ETFs you short declines even more.

This is the basis for the original concept of hedge funds, as envisaged by Alfred Jones in the 1940’s, and underpins the most popular hedge fund strategy, equity long-short.  But what works successfully in equities can equally be applied to other markets, including volatility.  In fact, I have argued elsewhere that the relative value (long/short) concept works even better in volatility markets, chiefly because the correlations between volatility processes tend to be higher than the correlations between the underlying asset processes (see The Case for Volatility as an Asset Class).


Investing in Leveraged ETFs – Theory and Practice

Summary

Leveraged ETFs suffer from decay, or “beta slippage.” Researchers have attempted to exploit this effect by shorting pairs of long and inverse leveraged ETFs.

The results of these strategies look good if you assume continuous compounding, but are often poor when less frequent compounding is assumed.

In reality, the trading losses incurred in rebalancing the portfolio, which requires you to sell low and buy high, overwhelm any benefit from decay, making the strategies unprofitable in practice.

A short levered ETF strategy has similar characteristics to a short straddle option position, with positive Theta and negative Gamma, and will experience periodic, large drawdowns.

It is possible to develop leveraged ETF strategies producing high returns and Sharpe ratios with relative value techniques commonly used in option trading strategies.

SSALGOTRADING AD

Decay in Leveraged ETFs

Leveraged ETFs continue to be much discussed on Seeking Alpha.

One aspect in particular that has caught analysts’ attention is the decay, or “beta slippage” that leveraged ETFs tend to suffer from.

Seeking Alpha contributor Fred Picard in a 2013 article (“What You Need To Know About The Decay Of Leveraged ETFs“) described the effect using the following hypothetical example:

To understand what is beta-slippage, imagine a very volatile asset that goes up 25% one day and down 20% the day after. A perfect double leveraged ETF goes up 50% the first day and down 40% the second day. On the close of the second day, the underlying asset is back to its initial price:

(1 + 0.25) x (1 – 0.2) = 1

And the perfect leveraged ETF?

(1 + 0.5) x (1 – 0.4) = 0.9

Nothing has changed for the underlying asset, and 10% of your money has disappeared. Beta-slippage is not a scam. It is the normal mathematical behavior of a leveraged and rebalanced portfolio. In case you manage a leveraged portfolio and rebalance it on a regular basis, you create your own beta-slippage. The previous example is simple, but beta-slippage is not simple. It cannot be calculated from statistical parameters. It depends on a specific sequence of gains and losses.

Fred goes on to make the point that is the crux of this article, as follows:

At this point, I’m sure that some smart readers have seen an opportunity: if we lose money on the long side, we make a profit on the short side, right?

Shorting Leveraged ETFs

Taking his cue from Fred’s article, Seeking Alpha contributor Stanford Chemist (“Shorting Leveraged ETF Pairs: Easier Said Than Done“) considers the outcome of shorting pairs of leveraged ETFs, including the Market Vectors Gold Miners ETF (NYSEARCA:GDX), the Direxion Daily Gold Miners Bull 3X Shares ETF (NYSEARCA:NUGT) and the Direxion Daily Gold Miners Bear 3X Shares ETF (NYSEARCA:DUST).

His initial finding appears promising:

Therefore, investing $10,000 each into short positions of NUGT and DUST would have generated a profit of $9,830 for NUGT, and $3,900 for DUST, good for an average profit of 68.7% over 3 years, or 22.9% annualized.

At first sight, this appears to a nearly risk-free strategy; after all, you are shorting both the 3X leveraged bull and 3X leveraged bear funds, which should result in a market neutral position. Is there easy money to be made?
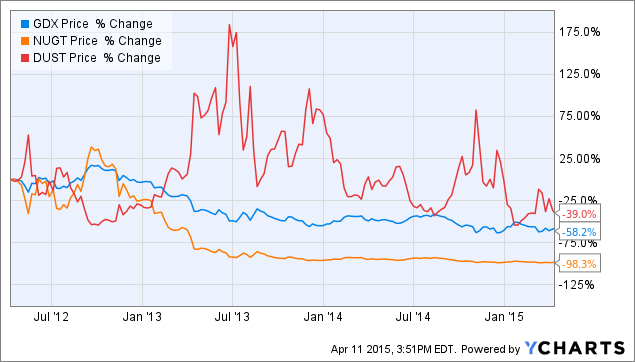
Source: Standford Chemist

Not so fast! Stanford Chemist applies the same strategy to another ETF pair, with a very different outcome:

“What if you had instead invested $10,000 each into short positions of the Direxion Russell 1000 Financials Bullish 3X ETF (NYSEARCA:FAS) and the Direxion Russell 1000 Financials Bearish 3X ETF (NYSEARCA:FAZ)?

The $10,000 short position in FAZ would have gained you $8,680. However, this would have been dwarfed by the $28,350 loss that you would have sustained in shorting FAS. In total, you would be down $19,670, which translates into a loss of 196.7% over three years, or 65.6% annualized.

No free lunch there.

The Rebalancing Issue

Stanford Chemist puts his finger on one of the key issues: rebalancing. He explains as follows:

So what happened to the FAS-FAZ pair? Essentially, what transpired was that as the underlying asset XLF increased in value, the two short positions became unbalanced. The losing side (short FAS) ballooned in size, making further losses more severe. On the other hand, the winning side (short FAZ) shrunk, muting the effect of further gains.

To counteract this effect, the portfolio needs to be rebalanced. Stanford Chemist looks at the implications of rebalancing a short NUGT-DUST portfolio whenever the market value of either ETF deviates by more than N% from its average value, where he considers N% in the range from 10% to 100%, in increments of 10%.

While the annual portfolio return was positive in all but one of these scenarios, there was very considerable variation in the outcomes, with several of the rebalanced portfolios suffering very large drawdowns of as much as 75%:
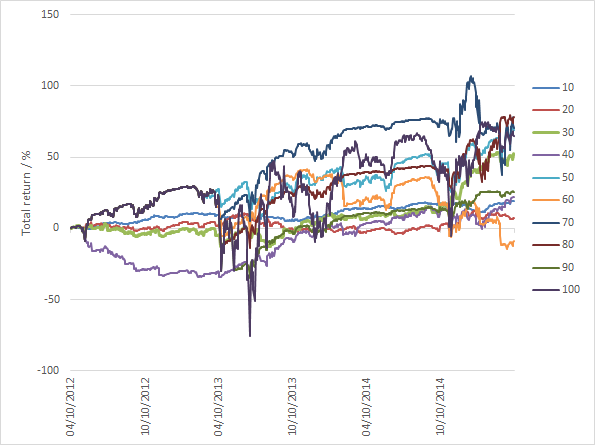
Source: Stanford Chemist

The author concludes:

The results of the backtest showed that profiting from this strategy is easier said than done. The total return performances of the strategy over the past three years was highly dependent on the rebalancing thresholds chosen. Unfortunately, there was also no clear correlation between the rebalancing period used and the total return performance. Moreover, the total return profiles showed that large drawdowns do occur, meaning that despite being ostensibly “market neutral”, this strategy still bears a significant amount of risk.

Leveraged ETF Pairs – Four Case Studies

Let’s press pause here and review a little financial theory. As you recall, it is possible to express a rate of return in many different ways, depending on how interest is compounded. The most typical case is daily compounding:

R = (Pt – Pt-1) / Pt

Where Pt is the price on day t, and Pt-1 is the price on day t-1, one day prior.

Another commonly used alternative is continuous compounding, also sometimes called log-returns:

R = Ln(Pt) – Ln(Pt-1)

Where Ln(Pt) is the natural log of the price on day t, Pt

When a writer refers to a rate of return, he should make clear what compounding basis the return rate is quoted on, whether continuous, daily, monthly or some other frequency. Usually, however, the compounding basis is clear from the context. Besides, it often doesn’t make a large difference anyway. But with leveraged ETFs, even microscopic differences can produce substantially different outcomes.

I will illustrate the effect of compounding by reference to examples of portfolios comprising short positions in the following representative pairs of leveraged ETFs:

  • Direxion Daily Energy Bull 3X Shares ETF (NYSEARCA:ERX)
  • Direxion Daily Energy Bear 3X Shares ETF (NYSEARCA:ERY)
  • Direxion Daily Gold Miners Bull 3X ETF
  • Direxion Daily Gold Miners Bear 3X ETF
  • Direxion Daily S&P 500 Bull 3X Shares ETF (NYSEARCA:SPXL)
  • Direxion Daily S&P 500 Bear 3X Shares ETF (NYSEARCA:SPXS)
  • Direxion Daily Small Cap Bull 3X ETF (NYSEARCA:TNA)
  • Direxion Daily Small Cap Bear 3X ETF (NYSEARCA:TZA)

The findings in relation to these pairs are mirrored by results for other leveraged ETF pairs.

First, let’s look the returns in the ETF portfolios measured using continuous compounding.
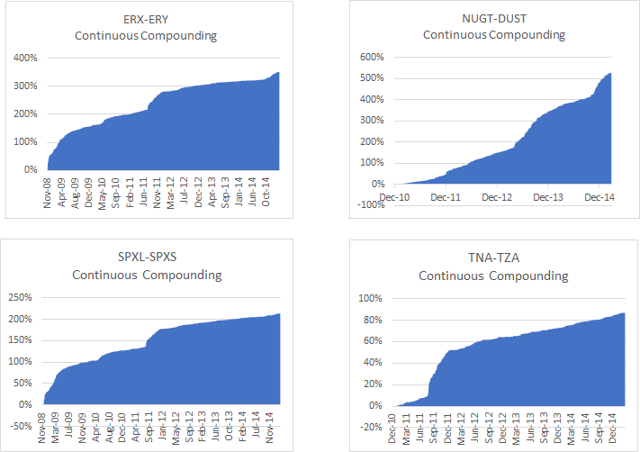
Source: Yahoo! Finance

The portfolio returns look very impressive, with CAGRs ranging from around 20% for the short TNA-TZA pair, to over 124% for the short NUGT-DUST pair. Sharpe ratios, too, appear abnormally large, ranging from 4.5 for the ERX-ERY short pair to 8.4 for NUGT-DUST.

Now let’s look at the performance of the same portfolios measured using daily compounding.
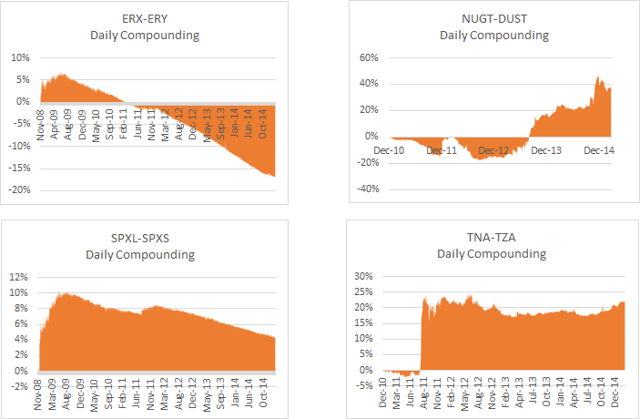
Source: Yahoo! Finance

It’s an altogether different picture. None of the portfolios demonstrate an attract performance record and indeed in two cases the CAGR is negative.

What’s going on?

Stock Loan Costs

Before providing the explanation, let’s just get one important detail out of the way. Since you are shorting both legs of the ETF pairs, you will be faced with paying stock borrow costs. Borrow costs for leveraged ETFs can be substantial and depending on market conditions amount to as much as 10% per annum, or more.

In computing the portfolio returns in both the continuous and daily compounding scenarios I have deducted annual stock borrow costs based on recent average quotes from Interactive Brokers, as follows:

  • ERX-ERY: 14%
  • NUGT-DUST: 16%
  • SXPL-SPXS: 8%
  • TNA-TZA: 8%

It’s All About Compounding and Rebalancing

The implicit assumption in the computation of the daily compounded returns shown above is that you are rebalancing the portfolios each day. That is to say, it is assumed that at the end of each day you buy or sell sufficient quantities of shares of each ETF to maintain an equal $ value in both legs.

In the case of continuously compounded returns the assumption you are making is that you maintain an equal $ value in both legs of the portfolio at every instant. Clearly that is impossible.

Ok, so if the results from low frequency rebalancing are poor, while the results for instantaneous rebalancing are excellent, it is surely just a question of rebalancing the portfolio as frequently as is practically possible. While we may not be able to achieve the ideal result from continuous rebalancing, the results we can achieve in practice will reflect how close we can come to that ideal, right?

Unfortunately, not.

Because, while we have accounted for stock borrow costs, what we have ignored in the analysis so far are transaction costs.

Transaction Costs

With daily rebalancing transaction costs are unlikely to be a critical factor – one might execute a single trade towards the end of the trading session. But in the continuous case, it’s a different matter altogether.

Let’s use the SPXL-SPXS pair as an illustration. When the S&P 500 index declines, the value of the SPXL ETF will fall, while the value of the SPXS ETF will rise. In order to maintain the same $ value in both legs you will need to sell more shares in SPXL and buy back some shares in SPXS. If the market trades up, SPXL will increase in value, while the price of SPXS will fall, requiring you to buy back some SPXL shares and sell more SPXS.

In other words, to rebalance the portfolio you will always be trying to sell the ETF that has declined in price, while attempting to buy the inverse ETF that has appreciated. It is often very difficult to execute a sale in a declining stock at the offer price, or buy an advancing stock at the inside bid. To be sure of completing the required rebalancing of the portfolio, you are going to have to buy at the ask price and sell at the bid price, paying the bid-offer spread each time.

Spreads in leveraged ETF products tend to be large, often several pennies. The cumulative effect of repeatedly paying the bid-ask spread, while taking trading losses on shares sold at the low or bought at the high, will be sufficient to overwhelm the return you might otherwise hope to make from the ETF decay.

And that’s assuming the best case scenario that shares are always available to short. Often they may not be: so that, if the market trades down and you need to sell more SPXL, there may be none available and you will be unable to rebalance your portfolio, even if you were willing to pay the additional stock loan costs and bid-ask spread.

A Lose-Lose Proposition

So, in summary: if you rebalance infrequently you will avoid excessive transaction costs; but the $ imbalance that accrues over the course of a trading day will introduce a market bias in the portfolio. That can hurt portfolio returns very badly if you get caught on the wrong side of a major market move. The results from daily rebalancing for the illustrative pairs shown above indicate that this is likely to happen all too often.

On the other hand, if you try to maintain market neutrality in the portfolio by rebalancing at high frequency, the returns you earn from decay will be eaten up by transaction costs and trading losses, as you continuously sell low and buy high, paying the bid-ask spread each time.

Either way, you lose.

Ok, what about if you reverse the polarity of the portfolio, going long both legs? Won’t that avoid the very high stock borrow costs and put you in a better position as regards the transaction costs involved in rebalancing?

Yes, it will. Because, you will be selling when the market trades up and buying when it falls, making it much easier to avoid paying the bid-ask spread. You will also tend to make short term trading profits by selling high and buying low. Unfortunately, you may not be surprised to learn, these advantages are outweighed by the cost of the decay incurred in both legs of the long ETF portfolio.

In other words: you can expect to lose if you are short; and lose if you are long!

An Analogy from Option Theory

To anyone with a little knowledge of basic option theory, what I have been describing should sound like familiar territory.

Being short the ETF pair is like being short an option (actually a pair of call and put options, called a straddle). You earn decay, or Theta, for those familiar with the jargon, by earning the premium on the options you have sold; but at the risk of being short Gamma – which measures your exposure to a major market move.
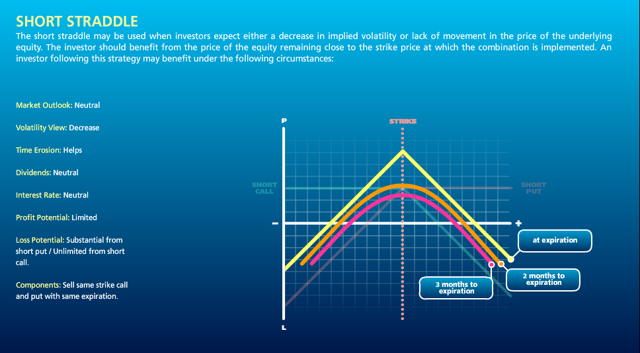
Source: Interactive Brokers

You can hedge out the portfolio’s Gamma exposure by trading the underlying securities – the ETF pair in this case – and when you do that you find yourself always having to sell at the low and buy at the high. If the options are fairly priced, the option decay is enough, but not more, to compensate for the hedging cost involved in continuously trading the underlying.

Conversely, being long the ETF pair is like being long a straddle on the underling pair. You now have positive Gamma exposure, so your portfolio will make money from a major market move in either direction. However, the value of the straddle, initially the premium you paid, decays over time at a rate Theta (also known as the “bleed”).
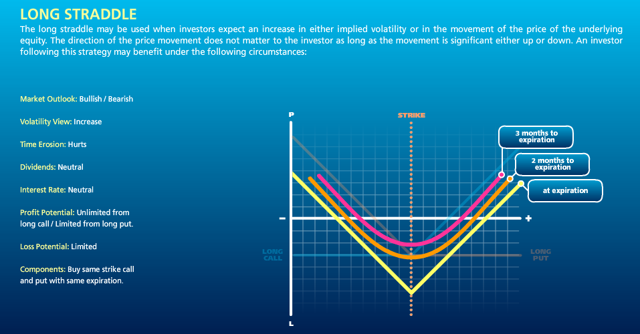
Source: Interactive Brokers

You can offset the bleed by performing what is known as Gamma trading. When the market trades up your portfolio delta becomes positive, i.e. an excess $ value in the long ETF leg, enabling you to rebalance your position by selling excess deltas at the high. Conversely, when the market trades down, your portfolio delta becomes negative and you rebalance by buying the underlying at the current, reduced price. In other words, you sell at the high and buy at the low, typically making money each time. If the straddle is fairly priced, the profits you make from Gamma trading will be sufficient to offset the bleed, but not more.

Typically, the payoff from being short options – being short the ETF pair – will show consistent returns for sustained periods, punctuated by very large losses when the market makes a significant move in either direction.

Conversely, if you are long options – long the ETF pair – you will lose money most of the time due to decay and occasionally make a very large profit.

In an efficient market in which securities are fairly priced, neither long nor short option strategy can be expected to dominate the other in the long run. In fact, transaction costs will tend to produce an adverse outcome in either case! As with most things in life, the house is the player most likely to win.

Developing a Leveraged ETF Strategy that Works

Investors shouldn’t be surprised that it is hard to make money simply by shorting leveraged ETF pairs, just as it is hard to make money by selling options, without risking blowing up your account.

And yet, many traders do trade options and often manage to make substantial profits. In some cases traders are simply selling options, hoping to earn substantial option premiums without taking too great a hit when the market explodes. They may get away with it for many years, before blowing up. Indeed, that has been the case since 2009. But who would want to be an option seller here, with the market at an all-time high? It’s simply far too risky.

The best option traders make money by trading both the long and the short side. Sure, they might lean in one direction or the other, depending on their overall market view and the opportunities they find. But they are always hedged, to some degree. In essence what many option traders seek to do is what is known as relative value trading – selling options they regard as expensive, while hedging with options they see as being underpriced. Put another way, relative value traders try to buy cheap Gamma and sell expensive Theta.

This is how one can thread the needle in leveraged ETF strategies. You can’t hope to make money simply by being long or short all the time – you need to create a long/short ETF portfolio in which the decay in the ETFs you are short is greater than in the ETFs you are long. Such a strategy is, necessarily, tactical: your portfolio holdings and net exposure will likely change from long to short, or vice versa, as market conditions shift. There will be times when you will use leverage to increase your market exposure and occasions when you want to reduce it, even to the point of exiting the market altogether.

If that sounds rather complicated, I’m afraid it is. I have been developing and trading arbitrage strategies of this kind since the early 2000s, often using sophisticated option pricing models. In 2012 I began trading a volatility strategy in ETFs, using a variety of volatility ETF products, in combination with equity and volatility index futures.

I have reproduced the results from that strategy below, to give some indication of what is achievable in the ETF space using relative value arbitrage techniques.
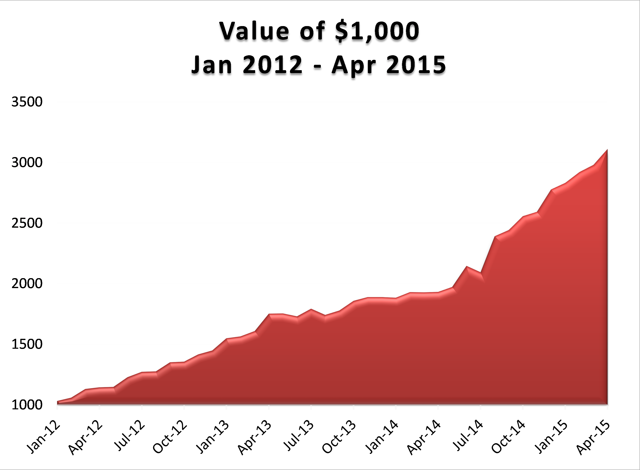
Source: Systematic Strategies, LLC

Source: Systematic Strategies LLC

Conclusion

There are no free lunches in the market. The apparent high performance of strategies that engage systematically in shorting leveraged ETFs is an illusion, based on a failure to quantify the full costs of portfolio rebalancing.

The payoff from a short leveraged ETF pair strategy will be comparable to that of a short straddle position, with positive decay (Theta) and negative Gamma (exposure to market moves). Such a strategy will produce positive returns most of the time, punctuated by very large drawdowns.

The short Gamma exposure can be mitigated by continuously rebalancing the portfolio to maintain dollar neutrality. However, this will entail repeatedly buying ETFs as they trade up and selling them as they decline in value. The transaction costs and trading losses involved in continually buying high and selling low will eat up most, if not all, of the value of the decay in the ETF legs.

A better approach to trading ETFs is relative value arbitrage, in which ETFs with high decay rates are sold and hedged by purchases of ETFs with relatively low rates of decay.

An example given of how this approach has been applied successfully in volatility ETFs since 2012.

Developing Long/Short ETF Strategies

Recently I have been working on the problem of how to construct large portfolios of cointegrated securities.  My focus has been on ETFs rather that stocks, although in principle the methodology applies equally well to either, of course.

My preference for ETFs is due primarily to the fact that  it is easier to achieve a wide diversification in the portfolio with a more limited number of securities: trading just a handful of ETFs one can easily gain exposure, not only to the US equity market, but also international equity markets, currencies, real estate, metals and commodities. Survivorship bias, shorting restrictions  and security-specific risk are also less of an issue with ETFs than with stocks (although these problems are not too difficult to handle).

On the downside, with few exceptions ETFs tend to have much shorter histories than equities or commodities.  One also has to pay close attention to the issue of liquidity. That said, I managed to assemble a universe of 85 ETF products with histories from 2006 that have sufficient liquidity collectively to easily absorb an investment of several hundreds of  millions of dollars, at minimum.

The Cardinality Problem

The basic methodology for constructing a long/short portfolio using cointegration is covered in an earlier post.   But problems arise when trying to extend the universe of underlying securities.  There are two challenges that need to be overcome.

Magic Cube.112

The first issue is that, other than the simple regression approach, more advanced techniques such as the Johansen test are unable to handle data sets comprising more than about a dozen securities. The second issue is that the number of possible combinations of cointegrated securities quickly becomes unmanageable as the size of the universe grows.  In this case, even taking a subset of just six securities from the ETF universe gives rise to a total of over 437 million possible combinations (85! / (79! * 6!).  An exhaustive test of all the possible combinations of a larger portfolio of, say, 20 ETFs, would entail examining around 1.4E+19 possibilities.

Given the scale of the computational problem, how to proceed? One approach to addressing the cardinality issue is sparse canonical correlation analysis, as described in Identifying Small Mean Reverting Portfolios,  d’Aspremont (2008). The essence of the idea is something like this. Suppose you find that, in a smaller, computable universe consisting of just two securities, a portfolio comprising, say, SPY and QQQ was  found to be cointegrated.  Then, when extending consideration to portfolios of three securities, instead of examining every possible combination, you might instead restrict your search to only those portfolios which contain SPY and QQQ. Having fixed the first two selections, you are left with only 83 possible combinations of three securities to consider.  This process is repeated as you move from portfolios comprising 3 securities to 4, 5, 6, … etc.

Other approaches to the cardinality problem are  possible.  In their 2014 paper Sparse, mean reverting portfolio selection using simulated annealing,  the Hungarian researchers Norbert Fogarasi and Janos Levendovszky consider a new optimization approach based on simulated annealing.  I have developed my own, hybrid approach to portfolio construction that makes use of similar analytical methodologies. Does it work?

A Cointegrated Long/Short ETF Basket

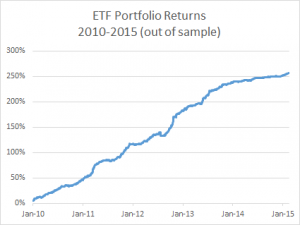
Below are summarized the out-of-sample results for a portfolio comprising 21 cointegrated ETFs over the period from 2010 to 2015.  The basket has broad exposure (long and short) to US and international equities, real estate, currencies and interest rates, as well as exposure in banking, oil and gas and other  specific sectors.

The portfolio was constructed using daily data from 2006 – 2009, and cointegration vectors were re-computed annually using data up to the end of the prior year.  I followed my usual practice of using daily data comprising “closing” prices around 12pm, i.e. in the middle of the trading session, in preference to prices at the 4pm market close.  Although liquidity at that time is often lower than at the close, volatility also tends to be muted and one has a period of perhaps as much at two hours to try to achieve the arrival price. I find this to be a more reliable assumption that the usual alternative.

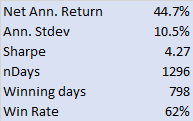
Fig 2   Fig 1 The risk-adjusted performance of the strategy is consistently outstanding throughout the out-of-sample period from 2010.  After a slowdown in 2014, strategy performance in the first quarter of 2015 has again accelerated to the level achieved in earlier years (i.e. with a Sharpe ratio above 4).

Another useful test procedure is to compare the strategy performance with that of a portfolio constructed using standard mean-variance optimization (using the same ETF universe, of course).  The test indicates that a portfolio constructed using the traditional Markowitz approach produces a similar annual return, but with 2.5x the annual volatility (i.e. a Sharpe ratio of only 1.6).  What is impressive about this result is that the comparison one is making is between the out-of-sample performance of the strategy vs. the in-sample performance of a portfolio constructed using all of the available data.

Having demonstrated the validity of the methodology,  at least to my own satisfaction, the next step is to deploy the strategy and test it in a live environment.  This is now under way, using execution algos that are designed to minimize the implementation shortfall (i.e to minimize any difference between the theoretical and live performance of the strategy).  So far the implementation appears to be working very well.

Once a track record has been built and audited, the really hard work begins:  raising investment capital!

Quant Strategies in 2018

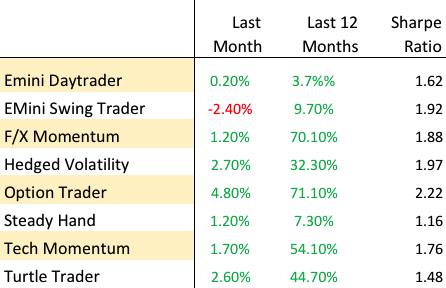
Quant Strategies – Performance Summary Sept. 2018

The end of Q3 seems like an appropriate time for an across-the-piste review of how systematic strategies are performing in 2018.  I’m using the dozen or more strategies running on the Systematic Algotrading Platform as the basis for the performance review, although results will obviously vary according to the specifics of the strategy.  All of the strategies are traded live and performance results are net of subscription fees, as well as slippage and brokerage commissions.

Volatility Strategies

Those waiting for the hammer to fall on option premium collecting strategies will have been disappointed with the way things have turned out so far in 2018.  Yes, February saw a long-awaited and rather spectacular explosion in volatility which completely destroyed several major volatility funds, including the VelocityShares Daily Inverse VIX Short-Term ETN (XIV) as well as Chicago-based hedged fund LJM Partners (“our goal is to preserve as much capital as possible”), that got caught on the wrong side of the popular VIX carry trade.  But the lack of follow-through has given many volatility strategies time to recover. Indeed, some are positively thriving now that elevated levels in the VIX have finally lifted option premiums from the bargain basement levels they were languishing at prior to February’s carnage.  The Option Trader strategy is a stand-out in this regard:  not only did the strategy produce exceptional returns during the February melt-down (+27.1%), the strategy has continued to outperform as the year has progressed and YTD returns now total a little over 69%.  Nor is the strategy itself exceptionally volatility: the Sharpe ratio has remained consistently above 2 over several years.

Hedged Volatility Trading

Investors’ chief concern with strategies that rely on collecting option premiums is that eventually they may blow up.  For those looking for a more nuanced approach to managing tail risk the Hedged Volatility strategy may be the way to go.  Like many strategies in the volatility space the strategy looks to generate alpha by trading VIX ETF products;  but unlike the great majority of competitor offerings, this strategy also uses ETF options to hedge tail risk exposure.  While hedging costs certainly acts as a performance drag, the results over the last few years have been compelling:  a CAGR of 52% with a Sharpe Ratio close to 2.

F/X Strategies

One of the common concerns for investors is how to diversify their investment portfolios, especially since the great majority of assets (and strategies) tend to exhibit significant positive correlation to equity indices these days. One of the characteristics we most appreciate about F/X strategies in general and the F/X Momentum strategy in particular is that its correlation to the equity markets over the last several years has been negligible.    Other attractive features of the strategy include the exceptionally high win rate – over 90% – and the profit factor of 5.4, which makes life very comfortable for investors.  After a moderate performance in 2017, the strategy has rebounded this year and is up 56% YTD, with a CAGR of 64.5% and Sharpe Ratio of 1.89.

Equity Long/Short

Thanks to the Fed’s accommodative stance, equity markets have been generally benign over the last decade to the benefit of most equity long-only and long-short strategies, including our equity long/short Turtle Trader strategy , which is up 31% YTD.  This follows a spectacular 2017 (+66%) , and is in line with the 5-year CAGR of 39%.   Notably, the correlation with the benchmark S&P500 Index is relatively low (0.16), while the Sharpe Ratio is a respectable 1.47.

Equity ETFs – Market Timing/Swing Trading

One alternative to the traditional equity long/short products is the Tech Momentum strategy.  This is a swing trading strategy that exploits short term momentum signals to trade the ProShares UltraPro QQQ (TQQQ) and ProShares UltraPro Short QQQ (SQQQ) leveraged ETFs.  The strategy is enjoying a banner year, up 57% YTD, with a four-year CAGR of 47.7% and Sharpe Ratio of 1.77.  A standout feature of this equity strategy is its almost zero correlation with the S&P 500 Index.  It is worth noting that this strategy also performed very well during the market decline in Feb, recording a gain of over 11% for the month.

Futures Strategies

It’s a little early to assess the performance of the various futures strategies in the Systematic Strategies portfolio, which were launched on the platform only a few months ago (despite being traded live for far longer).    For what it is worth, both of the S&P 500 E-Mini strategies, the Daytrader and the Swing Trader, are now firmly in positive territory for 2018.   Obviously we are keeping a watchful eye to see if the performance going forward remains in line with past results, but our experience of trading these strategies gives us cause for optimism.

Conclusion:  Quant Strategies in 2018

There appear to be ample opportunities for investors in the quant sector across a wide range of asset classes.  For investors with equity market exposure, we particularly like strategies with low market correlation that offer significant diversification benefits, such as the F/X Momentum and F/X Momentum strategies.  For those investors seeking the highest risk adjusted return, option selling strategies like the Option Trader strategy are the best choice, while for more cautious investors concerned about tail risk the Hedged Volatility strategy offers the security of downside protection.  Finally, there are several new strategies in equities and futures coming down the pike, several of which are already showing considerable promise.  We will review the performance of these newer strategies at the end of the year.

Go here for more information about the Systematic Algotrading Platform.

How to Bulletproof Your Portfolio

Summary

How to stay in the market and navigate the rocky terrain ahead, without risking hard won gains.

A hedging program to get you out of trouble at the right time and step back in when skies are clear.

Even a modest ability to time the market can produce enormous dividends over the long haul.

Investors can benefit by using quantitative market timing techniques to strategically adjust their market exposure.

Market timing can be a useful tool to avoid major corrections, increasing investment returns, while reducing volatility and drawdowns.

The Role of Market Timing

Investors have enjoyed record returns since the market lows in March 2009, but sentiment is growing that we may be in the final stages of this extended bull run. The road ahead could be considerably rockier. How do you stay the course, without risking all those hard won gains?

The smart move might be to take some money off the table at this point. But there could be adverse tax effects from cashing out and, besides, you can’t afford to sit on the sidelines and miss another 3,000 points on the Dow. Hedging tools like index options, or inverse volatility plays such as the VelocityShares Daily Inverse VIX Short-Term ETN (NASDAQ:XIV), are too expensive. What you need is a hedging program that will get you out of trouble at the right time – and step back in when the skies are clear. We’re talking about a concept known as market timing.

Market timing is the ability to switch between risky investments such as stocks and less-risky investments like bonds by anticipating the overall trend in the market. It’s extremely difficult to do. But as Nobel prize-winning economist Robert C. Merton pointed out in the 1980s, even a modest ability to time the market can produce enormous dividends over the long haul. This is where quantitative techniques can help – regardless of the nature of your underlying investment strategy.

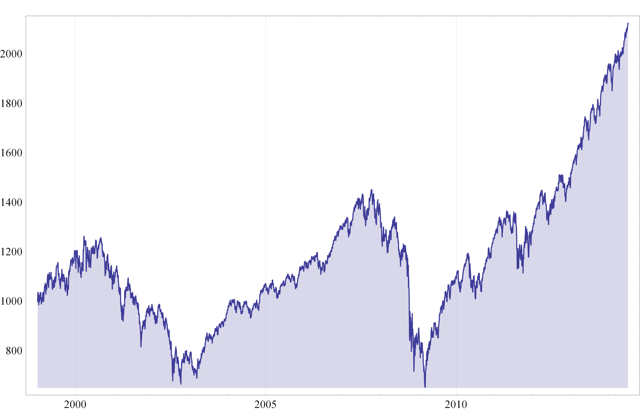
Let’s assume that your investment portfolio is correlated with a broad US equity index – we’ll use the SPDR S&P 500 Trust ETF (NYSEARCA:SPY) as a proxy, for illustrative purposes. While the market has more than doubled over the last 15 years, this represents a modest average annual return of only 7.21%, accompanied by high levels of volatility of 20.48% annually, not to mention sizeable drawdowns in 2000 and 2008/09.

Fig. 1 SPY – Value of $1,000 Jan 1999 – Jul 2014

Fig. 1 SPY - Value of $1,000 Jan 1999 - Jul 2014

Source: Yahoo! Finance, 2014

The aim of market timing is to smooth out the returns by hedging, and preferably avoiding altogether, periods of market turmoil. In other words, the aim is to achieve the same, or better, rates of return, with lower volatility and drawdown.

Market Timing with the VIX Index

The mechanism we are going to use for timing our investment is the CBOE VIX index, a measure of anticipated market volatility in the S&P 500 index. It is well known that the VIX and S&P 500 indices are negatively correlated – when one rises, the other tends to fall. By acting ahead of rising levels of the VIX index, we might avoid difficult market conditions when market volatility is high and returns are likely to be low. Our aim would be to reduce market exposure during such periods and increase exposure when the VIX is in decline.

SSALGOTRADING AD

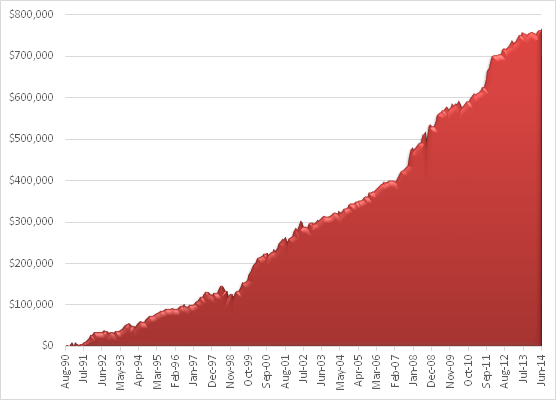
Forecasting the VIX index is a complex topic in its own right. The approach I am going to take here is simpler: instead of developing a forecasting model, I am going to use an algorithm to “trade” the VIX index. When the trading model “buys” the VIX index, we will assume it is anticipating increased market volatility and lighten our exposure accordingly. When the model “sells” the VIX, we will increase market exposure.

Don’t be misled by the apparent simplicity of this approach: a trading algorithm is often much more complex in its structure than even a very sophisticated forecasting model. For example, it can incorporate many different kinds of non-linear behavior and dynamically adjust its investment horizon. The results from such a trading algorithm, produced by our quantitative modeling system, are set out in the figure below.

Fig. 2a -VIX Trading Algorithm – Equity Curve

Fig. 2a -VIX Trading Algorithm - Equity Curve

Source: TradeStation Technologies Inc.

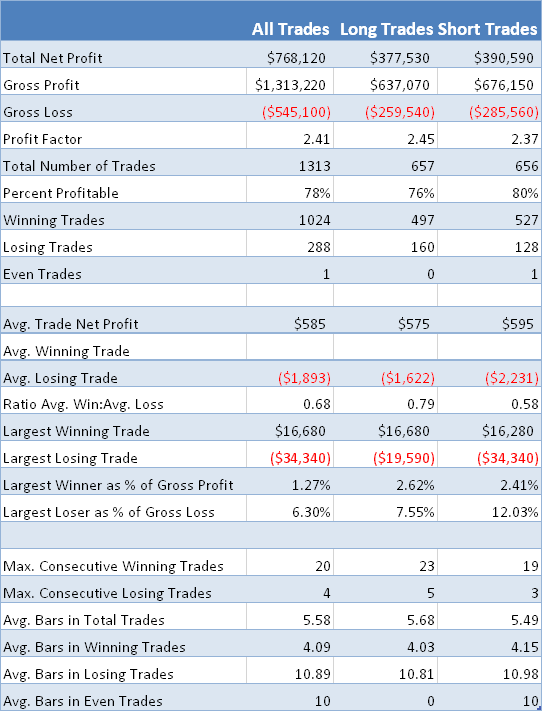
Fig. 2b -VIX Trading Algorithm – Performance Analysis

Fig. 2b -VIX Trading Algorithm - Performance Analysis

Source: TradeStation Technologies Inc.

Not only is the strategy very profitable, it has several desirable features, including a high percentage of winning trades. If this were an actual trading system, we might want to trade it in production. But, of course, it is only a theoretical model – the VIX index itself is not tradable – and, besides, the intention here is not to trade the algorithm, but to use it for market timing purposes.

Our approach is straightforward: when the algorithm generates a “buy” signal in the VIX, we will reduce our exposure to the market. When the system initiates a “sell”, we will increase our market exposure. Trades generated by the VIX algorithm are held for around five days on average, so we can anticipate rebalancing our portfolio approximately weekly. In what follows, we will assume that we adjust our position by trading the SPY ETF at the closing price the day following a signal from the VIX model. We will apply trading commissions of $1c per share and a further $1c per share in slippage.

Hedging Strategies

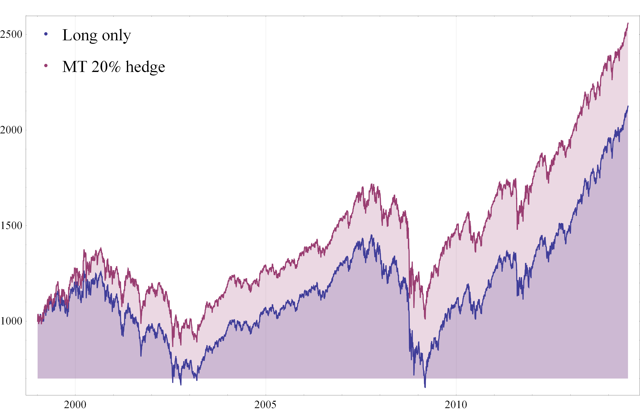
Let’s begin our evaluation by looking at the outcome if we adjust the SPY holding in our market portfolio by 20% whenever the VIX model generates a signal. When the model buys the VIX, we will reduce our original SPY holding by 20%, and when it sells the VIX, we will increase our SPY holding by 20%, using the original holding in the long only portfolio as a baseline. We refer to this in the chart below as the MT 20% hedge portfolio.

Fig. 3 Value of $1000 – Long only vs MT 20% hedge portfolio

Fig. 3 Value of $1000 - Long only vs MT 20% hedge portfolio

Source: Yahoo! Finance, 2014

The hedge portfolio dominates the long only portfolio over the entire period from 1999, producing a total net return of 156% compared to 112% for the SPY ETF. Not only is the rate of return higher, at 10.00% vs. 7.21% annually, volatility in investment returns is also significantly reduced (17.15% vs 20.48%). Although it, too, suffers substantial drawdowns in 2000 and 2008/09, the effects on the hedge portfolio are less severe. It appears that our market timing approach adds value.

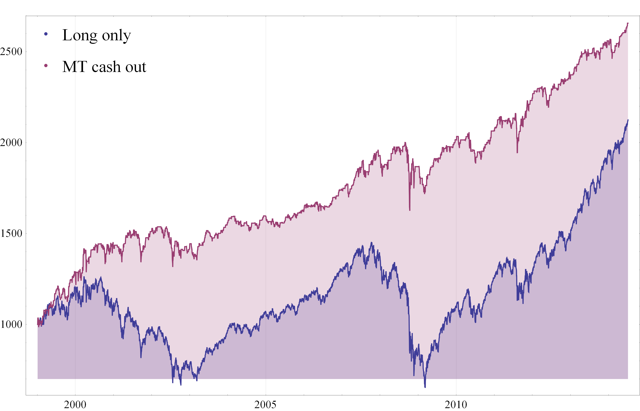
The selection of 20% as a hedge ratio is somewhat arbitrary – an argument can be made for smaller, or larger, hedge adjustments. Let’s consider a different scenario, one in which we exit our long-only position entirely, whenever the VIX algorithm issues a buy order. We will re-buy our entire original SPY holding whenever the model issues a sell order in the VIX. We refer to this strategy variant as the MT cash out portfolio. Let’s look at how the results compare.

Fig. 4 Value of $1,000 – Long only vs MT cash out portfolio

Fig. 4 value of $1,000 - Long only vs MT cash out portfolio

Source: Yahoo! Finance, 2014

The MT cash out portfolio appears to do everything we hoped for, avoiding the downturn of 2000 almost entirely and the worst of the market turmoil in 2008/09. Total net return over the period rises to 165%, with higher average annual returns of 10.62%. Annual volatility of 9.95% is less than half that of the long only portfolio.

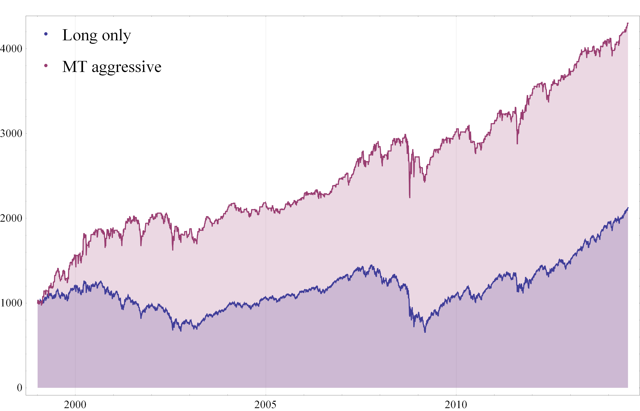
Finally, let’s consider a more extreme approach, which I have termed the “MT aggressive portfolio”. Here, whenever the VIX model issues a buy order we sell our entire SPY holding, as with the MT cash out strategy. Now, however, whenever the model issues a sell order on the VIX, we invest heavily in the market, buying double our original holding in SPY (i.e. we are using standard, reg-T leverage of 2:1, available to most investors). In fact, our average holding over the period turns out to be slightly lower than for the original long only portfolio because we are 100% in cash for slightly more than half the time. But the outcome represents a substantial improvement.

Fig. 5 Value of $1,000 – Long only vs. MT aggressive portfolio

Fig. 5 Value of $1,000 - Long only vs. MT aggressive portfolio

Source: Yahoo! Finance, 2014

Total net returns for the MT aggressive portfolio at 330% are about three times that of the original long only portfolio. Annual volatility at 14.90% is greater than for the MT cash out portfolio due to the use of leverage. But this is still significantly lower than the 20.48% annual volatility of the long only portfolio, while the annual rate of return of 21.16% is the highest of the group, by far. And here, too, the hedge strategy succeeds in protecting our investment portfolio from the worst of the effects of downturns in 2000 and 2008.

Conclusion

Whatever the basis for their underlying investment strategy, investors can benefit by using quantitative market timing techniques to strategically adjust their market exposure. Market timing can be a useful tool to avoid major downturns, increasing investment returns while reducing volatility. This could be especially relevant in the weeks and months ahead, as we may be facing a period of greater uncertainty and, potentially at least, the risk of a significant market correction.

Disclosure: The author has no positions in any stocks mentioned, and no plans to initiate any positions within the next 72 hours. The author wrote this article themselves, and it expresses their own opinions. The author is not receiving compensation for it (other than from Seeking Alpha). The author has no business relationship with any company whose stock is mentioned in this article.