Systematic Futures Trading

In its proprietary trading, Systematic Strategies primary focus in on equity and volatility strategies, both low and high frequency. In futures, the emphasis is on high frequency trading, although we also run one or two lower frequency strategies that have higher capacity, such as the Futures WealthBuilder. The version of WealthBuilder running on the Collective 2 site has performed very well in 2017, with net returns of 30% and a Sharpe Ratio of 3.4:

Futures C2 oct 2017


In the high frequency space, our focus is on strategies with very high Sharpe Ratios and low drawdowns. We trade a range of futures products, including equity, fixed income, metals and energy markets. Despite the current low levels of market volatility, these strategies have performed well in 2017:

HFT Futures Oct 2017 (NFA)

Building high frequency strategies with double-digit Sharpe Ratios requires a synergy of computational capability and modeling know-how. The microstructure of futures markets is, of course, substantially different to that of equity or forex markets and the components of the model that include microstructure effects vary widely from one product to another. There can be substantial variations too in the way that time is handled in the model – whether as discrete or continuous “wall time”, in trade time, or some other measure. But some of the simple technical indicators we use – moving averages, for example – are common to many models across different products and markets. Machine learning plays a role in most of our trading strategies, including high frequency.

Here are some relevant blog posts that you may find interesting:

http://jonathankinlay.com/2016/04/high-frequency-trading-equities-vs-futures/


http://jonathankinlay.com/2015/05/designing-scalable-futures-strategy/


http://jonathankinlay.com/2014/10/day-trading-system-in-vix-futures/

Futures WealthBuilder – June 2017: +4.4%

The Futures WealthBuilder product is an algorithmic CTA strategy that trades several highly liquid futures contracts using machine learning algorithms.  More details about the strategy are given in this blog post.

We offer a version of the strategy on the Collective 2 site (see here for details) that the user can subscribe to for a very modest fee of only $149 per month.  The Collective 2 version of the strategy is unlikely to perform as well as the product we offer in our Systematic Strategies Fund, which trades a much wider range of futures products.  But the strategy is off to an excellent start, making +4.4% in June and is now up 6.7% since inception in May.  In June the strategy made profitable trades in US Bonds, Euro F/X and VIX futures, and the last seven trades in a row have been winners.

You can find full details of the strategy, including a listing of all of the trades, on the Collective 2 site.

Subscribers can sign up for a free, seven day trial and thereafter they can choose to trade the strategy automatically in their own brokerage account, using the Collective 2 api.

Futures WealthBuilder June 2017

Futures WealthBuilder

We are launching a new product, the Futures WealthBuilder,  a CTA system that trades futures contracts in several highly liquid financial and commodity markets, including SP500 EMinis, Euros, VIX, Gold, US Bonds, 10-year and five-year notes, Corn, Natural Gas and Crude Oil.  Each  component strategy uses a variety of machine learning algorithms to detect trends, seasonal effects and mean-reversion.  We develop several different types of model for each market, and deploy them according to their suitability for current market conditions.

Performance of the strategy (net of fees) since 2013 is detailed in the charts and tables below.  Notable features include a Sharpe Ratio of just over 2, an annual rate of return of 190% on an account size of $50,000, and a maximum drawdown of around 8% over the last three years.  It is worth mentioning, too, that the strategy produces approximately equal rates of return on both long and short trades, with an overall profit factor above 2.


Fig1


Fig2


Fig3

Fig4


Fig5

Low Correlation

Despite a high level of correlation between several of the underlying markets, the correlation between the component strategies of Futures WealthBuilder are, in the majority of cases, negligibly small (with a few exceptions, such as the high correlation between the 10-year and 5-year note strategies).  This accounts for the relative high level of return in relation to portfolio risk, as measured by the Sharpe Ratio.   We offer strategies in both products chiefly as a mean of providing additional liquidity, rather than for their diversification benefit.

Fig 6

Strategy Robustness

Strategy robustness is a key consideration in the design stage.  We use Monte Carlo simulation to evaluate scenarios not seen in historical price data in order to ensure consistent performance across the widest possible range of market conditions.  Our methodology introduces random fluctuations to historical prices, increasing or decreasing them by as much as 30%.  We allow similar random fluctuations in that value strategy parameters, to ensure that our models perform consistently without being overly-sensitive to the specific parameter values we have specified.  Finally, we allow the start date of each sub-system to vary randomly by up to a year.

The effect of these variations is to produce a wide range of outcomes in terms of strategy performance.  We focus on the 5% worst outcomes, ranked by profitability, and select only those strategies whose performance is acceptable under these adverse scenarios.  In this way we reduce the risk of overfitting the models while providing more realistic expectations of model performance going forward.  This procedure also has the effect of reducing portfolio tail risk, and the maximum peak-to-valley drawdown likely to be produced by the strategy in future.

GC Daily Stress Test

Futures WealthBuilder on Collective 2

We will be running a variant of the Futures WealthBuilder strategy on the Collective 2 site, using a subset of the strategy models in several futures markets(see this page for details).  Subscribers will be able to link and auto-trade the strategy in their own account, assuming they make use of one of the approved brokerages which include Interactive Brokers, MB Trading and several others.

Obviously the performance is unlikely to be as good as the complete strategy, since several component sub-strategies will not be traded on Collective 2.  However, this does give the subscriber the option to trial the strategy in simulation before plunging in with real money.

Fig7


A High Frequency Scalping Strategy on Collective2

Scalping vs. Market Making

A market-making strategy is one in which the system continually quotes on the bid and offer and looks to make money from the bid-offer spread (and also, in the case of equities, rebates).  During a typical trading day, inventories will build up on the long or short side of the book as the market trades up and down.  There is no intent to take a market view as such, but most sophisticated market making strategies will use microstructure models to help decide whether to “lean” on the bid or offer at any given moment. Market makers may also shade their quotes to reduce the buildup of inventory, or even pull quotes altogether if they suspect that informed traders are trading against them (a situation referred to as “toxic flow”).  They can cover short positions through the repo desk and use derivatives to hedge out the risk of an accumulated inventory position.

marketmaking

A scalping strategy shares some of the characteristics of  a market making strategy:  it will typically be mean reverting, seeking to enter passively on the bid or offer and the average PL per trade is often in the region of a single tick.  But where a scalping strategy differs from market making is that it does take a view as to when to get long or short the market, although that view may change many times over the course of a trading session.  Consequently, a scalping strategy will only ever operate on one side of the market at a time, working the bid or offer; and it will typically never build inventory, since will it usually reverse and later try to sell for a profit the inventory it has previously purchased, hopefully at a lower price.

In terms of performance characteristics, a market making strategy will often have a double-digit Sharpe Ratio, which means that it may go for many days, weeks, or months, without taking a loss.  Scalping is inherently riskier, since it is taking directional bets, albeit over short time horizons.  With a Sharpe Ratio in the region of 3 to 5, a scalping strategy will often experience losing days and even losing months.

So why prefer scalping to market making?  It’s really a question of capability.  Competitive advantage in scalping derives from the successful exploitation of identified sources of alpha, whereas  market making depends primarily on speed and execution capability. Market making requires HFT infrastructure with latency measured in microseconds, the ability to layer orders up and down the book and manage order priority.  Scalping algos are generally much less demanding in terms of trading platform requirements: depending on the specifics of the system, they can be implemented successfully on many third party networks.

Developing HFT Futures Strategies

Some time ago my firm Systematic Strategies began research and development on a number of HFT strategies in futures markets.  Our primary focus has always been HFT equity strategies, so this was something of a departure for us, one that has entailed a significant technological obstacles (more on this in due course). Amongst the strategies we developed were several very profitable scalping algorithms in fixed income futures.  The majority trade at high frequency, with short holding periods measured in seconds or minutes, trading tens or even hundreds of times a day.

xtraderThe next challenge we faced was what to do with our research product.  As a proprietary trading firm our first instinct was to trade the strategies ourselves; but the original intent had been to develop strategies that could provide the basis of a hedge fund or CTA offering.  Many HFT strategies are unsuitable for that purpose, since the technical requirements exceed the capabilities of the great majority of standard trading platforms typically used by managed account investors. Besides, HFT strategies typically offer too limited capacity to be interesting to larger, institutional investors.

In the end we arrived at a compromise solution, keeping the highest frequency strategies in-house, while offering the lower frequency strategies to outside investors. This enabled us to keep the limited capacity of the highest frequency strategies for our own trading, while offering investors significant capacity in strategies that trade at lower frequencies, but still with very high performance characteristics.

HFT Bond Scalping

A typical example is the following scalping strategy in US Bond Futures.  The strategy combines two of the lower frequency algorithms we developed for bond futures that scalp around 10 times per session.  The strategy attempts to take around 8 ticks out of the market on each trade and averages around 1 tick per trade.   With a Sharpe Ratio of over 3, the strategy has produced net profits of approximately $50,000 per contract per year, since 2008.    A pleasing characteristic of this and other scalping strategies is their consistency:  There have been only 10 losing months since January 2008, the last being a loss of $7,100 in Dec 2015 (the prior loss being $472 in July 2013!)

Annual P&L

Fig2

Strategy Performance

fig4Fig3


Offering The Strategy to Investors on Collective2

The next challenge for us to solve was how best to introduce the program to potential investors.  Systematic Strategies is not a CTA and our investors are typically interested in equity strategies.  It takes a great deal of hard work to persuade investors that we are able to transfer our expertise in equity markets to the very different world of futures trading. While those efforts are continuing with my colleagues in Chicago, I decided to conduct an experiment:  what if we were to offer a scalping strategy through an online service like Collective2?  For those who are unfamiliar, Collective2 is an automated trading-system platform that allowed the tracking, verification, and auto-trading of multiple systems.  The platform keeps track of the system profit and loss, margin requirements, and performance statistics.  It then allows investors to follow the system in live trading, entering the system’s trading signals either manually or automatically.

Offering a scalping strategy on a platform like this certainly creates visibility (and a credible track record) with investors; but it also poses new challenges.  For example, the platform assumes trading cost of around $14 per round turn, which is at least 2x more expensive than most retail platforms and perhaps 3x-5x more expensive than the cost a HFT firm might pay.  For most scalping strategies that are designed to take a tick out of the market such high fees would eviscerate the returns.  This motivated our choice of US Bond Futures, since the tick size and average trade are sufficiently large to overcome even this level of trading friction.  After a couple of false starts, during which we played around with the algorithms and boosted strategy profitability with a couple of low frequency trades, the system is now happily humming along and demonstrating the kind of performance it should (see below).

For those who are interested in following the strategy’s performance, the link on collective2 is here.


Collective2Perf

trades

Disclaimer

About the results you see on this Web site

Past results are not necessarily indicative of future results.

These results are based on simulated or hypothetical performance results that have certain inherent limitations. Unlike the results shown in an actual performance record, these results do not represent actual trading. Also, because these trades have not actually been executed, these results may have under-or over-compensated for the impact, if any, of certain market factors, such as lack of liquidity. Simulated or hypothetical trading programs in general are also subject to the fact that they are designed with the benefit of hindsight. No representation is being made that any account will or is likely to achieve profits or losses similar to these being shown.

In addition, hypothetical trading does not involve financial risk, and no hypothetical trading record can completely account for the impact of financial risk in actual trading. For example, the ability to withstand losses or to adhere to a particular trading program in spite of trading losses are material points which can also adversely affect actual trading results. There are numerous other factors related to the markets in general or to the implementation of any specific trading program, which cannot be fully accounted for in the preparation of hypothetical performance results and all of which can adversely affect actual trading results.

Material assumptions and methods used when calculating results

The following are material assumptions used when calculating any hypothetical monthly results that appear on our web site.

  • Profits are reinvested. We assume profits (when there are profits) are reinvested in the trading strategy.
  • Starting investment size. For any trading strategy on our site, hypothetical results are based on the assumption that you invested the starting amount shown on the strategy’s performance chart. In some cases, nominal dollar amounts on the equity chart have been re-scaled downward to make current go-forward trading sizes more manageable. In these cases, it may not have been possible to trade the strategy historically at the equity levels shown on the chart, and a higher minimum capital was required in the past.
  • All fees are included. When calculating cumulative returns, we try to estimate and include all the fees a typical trader incurs when AutoTrading using AutoTrade technology. This includes the subscription cost of the strategy, plus any per-trade AutoTrade fees, plus estimated broker commissions if any.
  • “Max Drawdown” Calculation Method. We calculate the Max Drawdown statistic as follows. Our computer software looks at the equity chart of the system in question and finds the largest percentage amount that the equity chart ever declines from a local “peak” to a subsequent point in time (thus this is formally called “Maximum Peak to Valley Drawdown.”) While this is useful information when evaluating trading systems, you should keep in mind that past performance does not guarantee future results. Therefore, future drawdowns may be larger than the historical maximum drawdowns you see here.

Trading is risky

There is a substantial risk of loss in futures and forex trading. Online trading of stocks and options is extremely risky. Assume you will lose money. Don’t trade with money you cannot afford to lose.

Improving Trading System Performance Using a Meta-Strategy

What is a Meta-Strategy?

In my previous post on identifying drivers of strategy performance I mentioned the possibility of developing a meta-strategy.

fig0A meta-strategy is a trading system that trades trading systems.  The idea is to develop a strategy that will make sensible decisions about when to trade a specific system, in a way that yields superior performance compared to simply following the underlying trading system.  Put another way, the simplest kind of meta-strategy is a long-only strategy that takes positions in some underlying trading system.  At times, it will follow the underlying system exactly; at other times it is out of the market and ignore the trading system’s recommendations.

More generally, a meta-strategy can determine the size in which one, or several, systems should be traded at any point in time, including periods where the size can be zero (i.e. the system is not currently traded).  Typically, a meta-strategy is long-only:  in theory there is nothing to stop you developing a meta-strategy that shorts your underlying strategy from time to time, but that is a little counter-intuitive to say the least!

A meta-strategy is something that could be very useful for a fund-of-funds, as a way of deciding how to allocate capital amongst managers.

Caissa Capital operated a meta-strategy in its option arbitrage hedge fund back in the early 2000’s.  The meta-strategy (we called it a “model management system”) selected from a half dozen different volatility models to be used for option pricing, depending their performance, as measured by around 30 different criteria.  The criteria included both statistical metrics, such as the mean absolute percentage error in the forward volatility forecasts, as well as trading performance criteria such as the moving average of the trade PNL.  The model management system probably added 100 – 200 basis points per annum to the performance the underlying strategy, so it was a valuable add-on.

Illustration of a Meta-Strategy in US Bond Futures

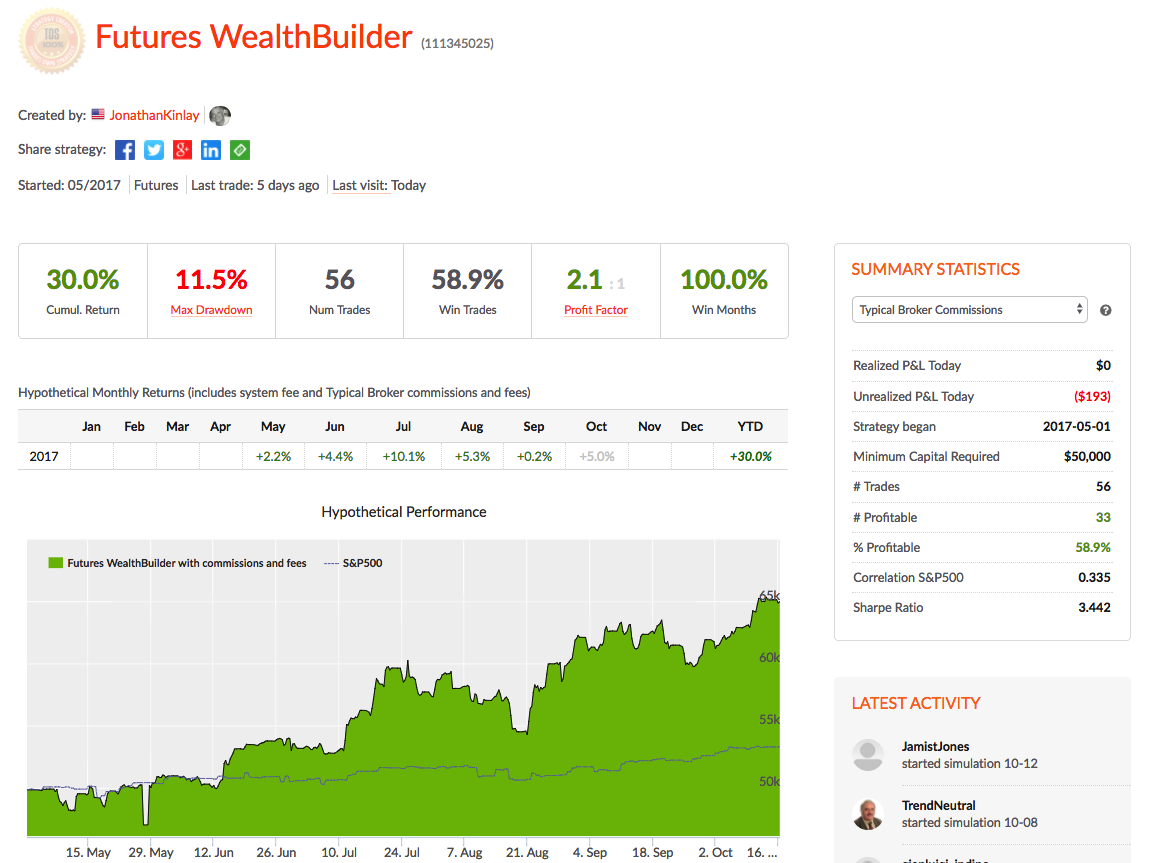
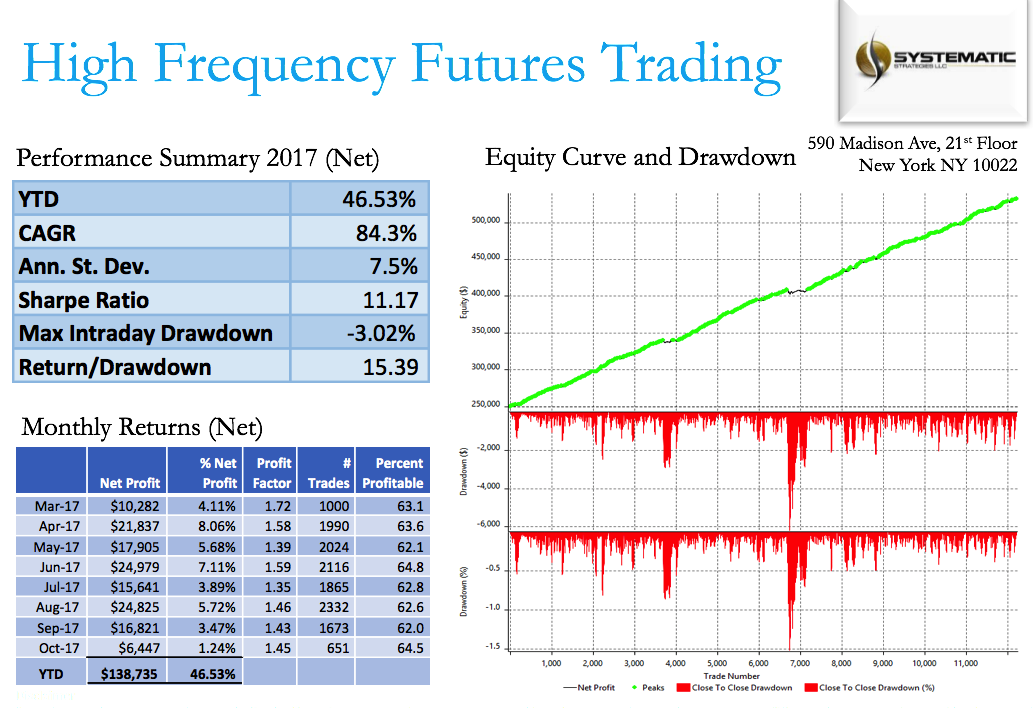
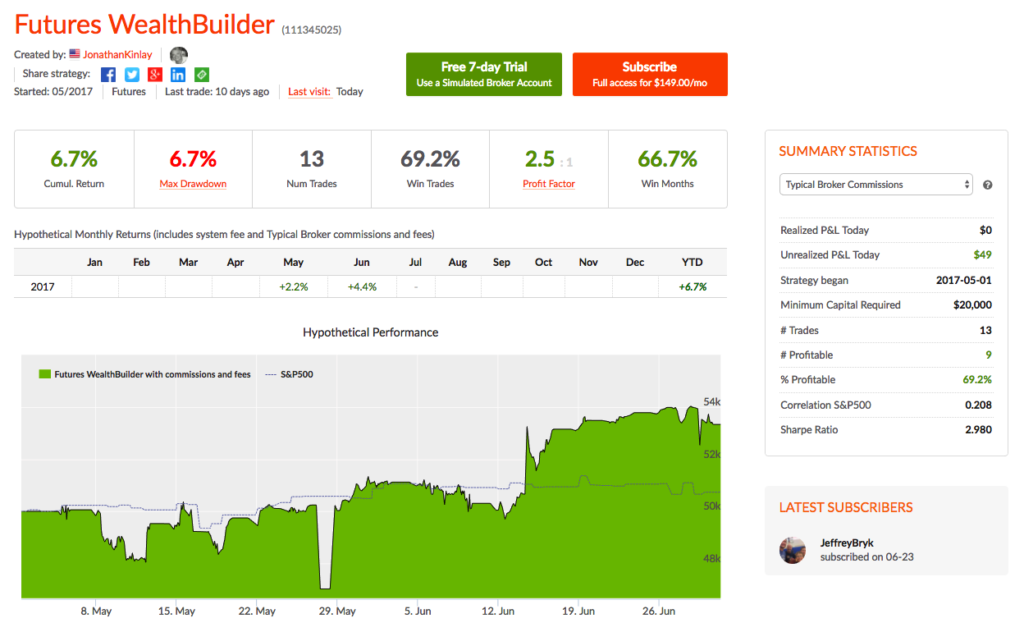
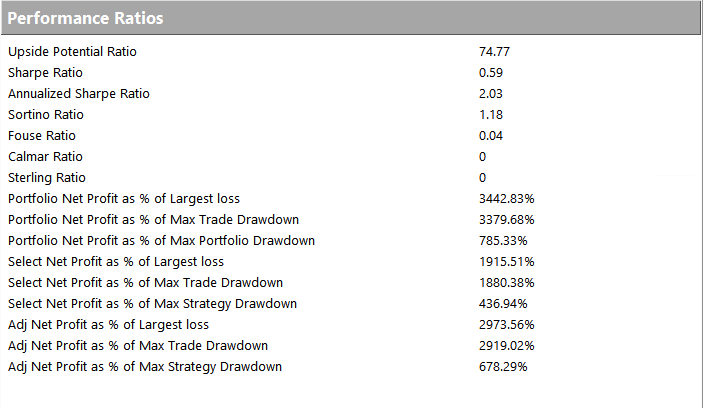
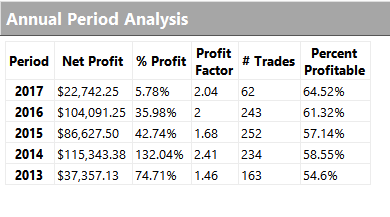
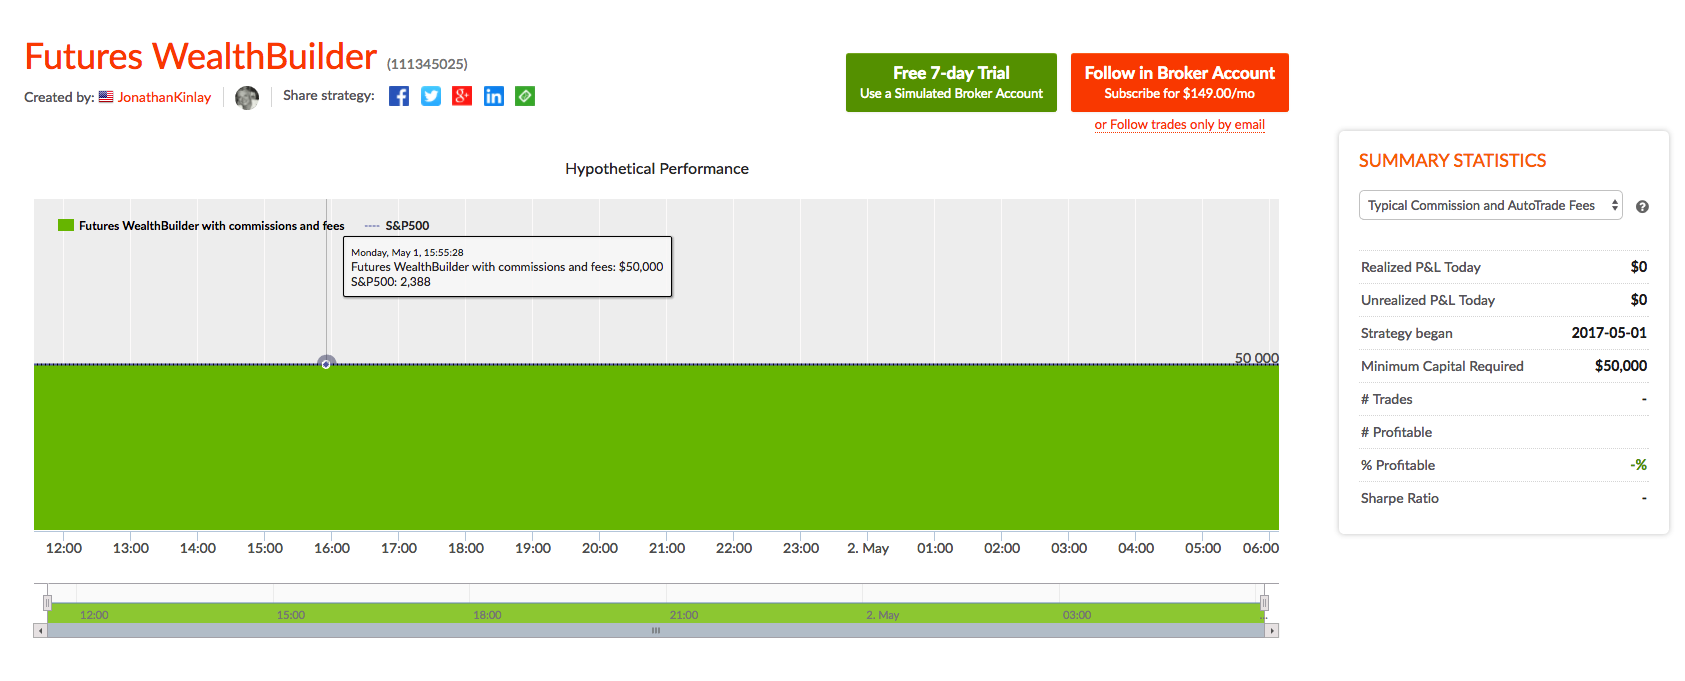
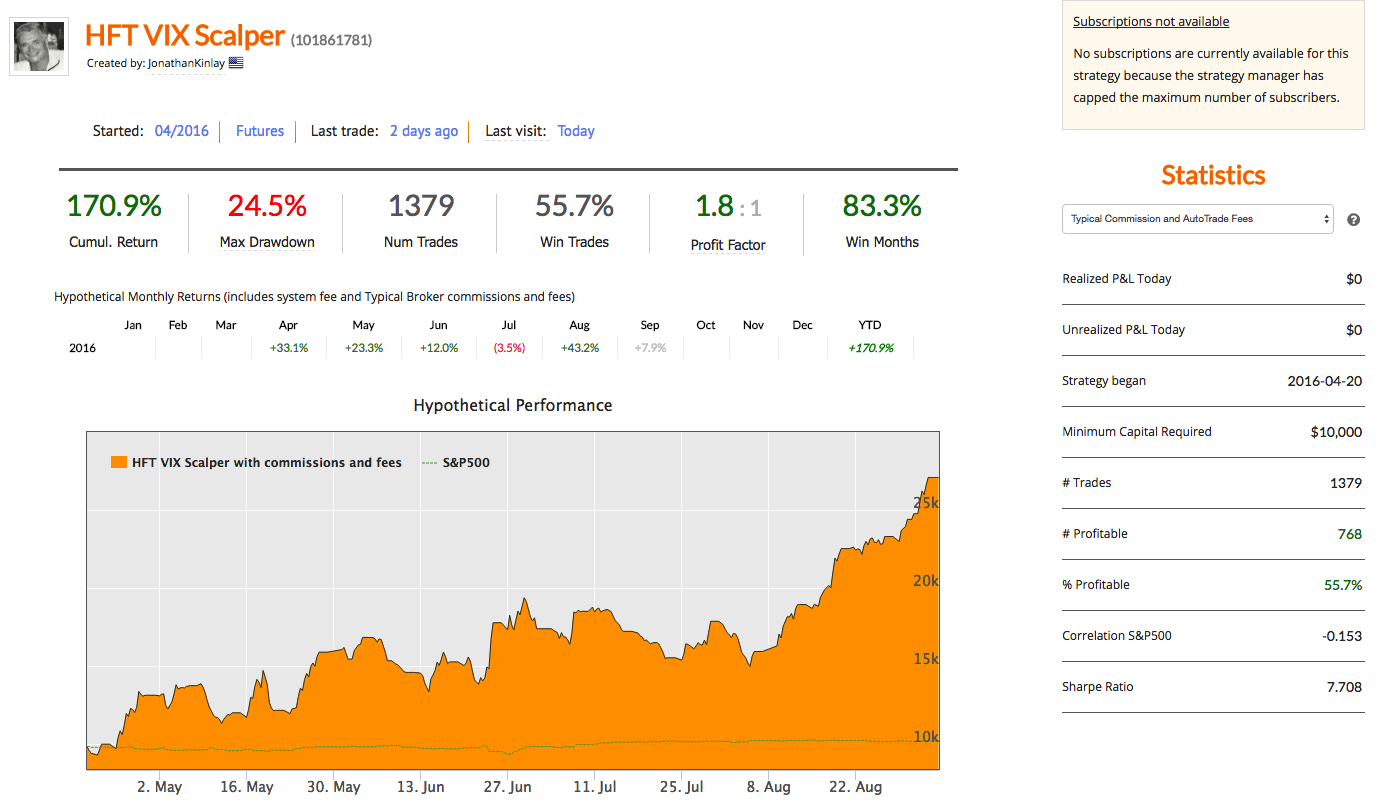
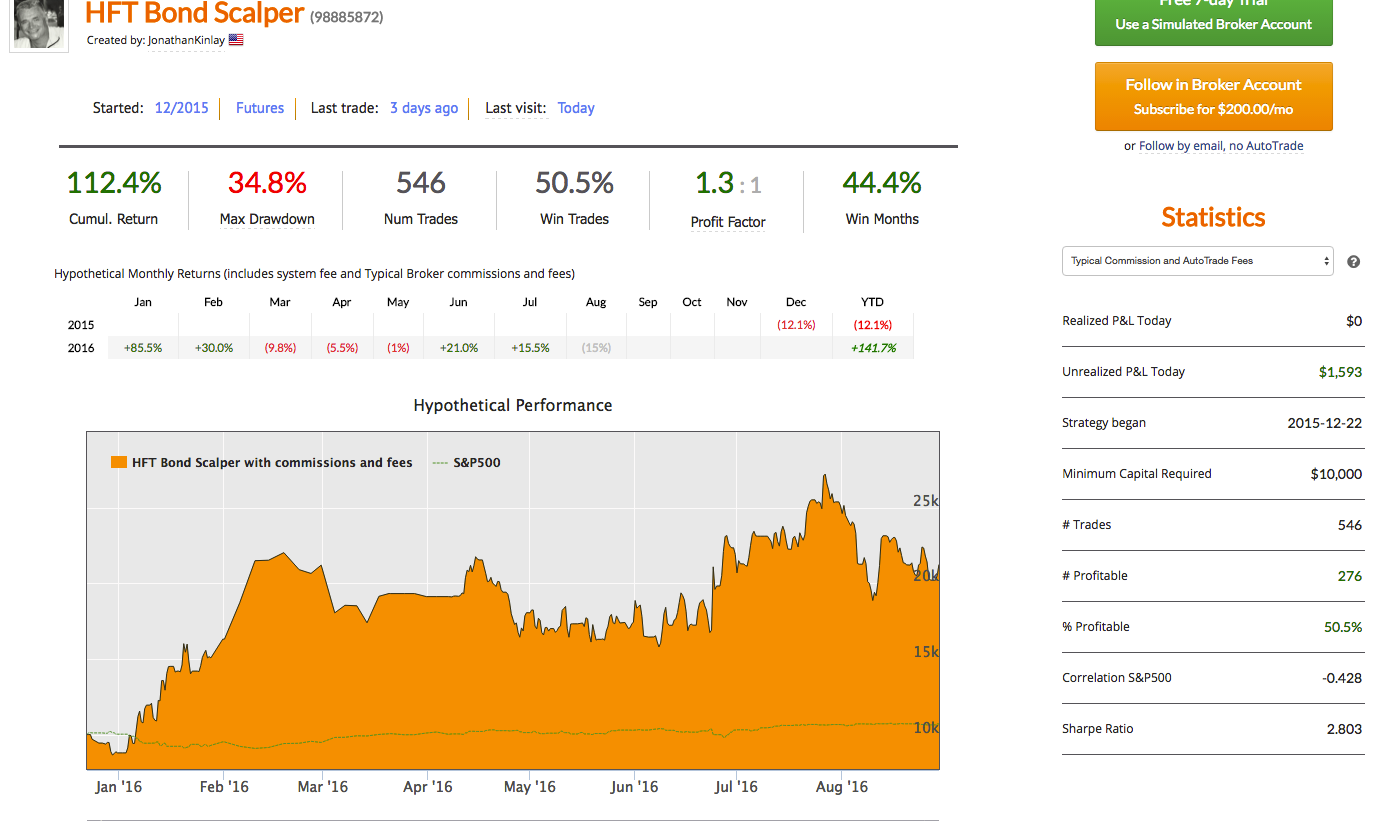
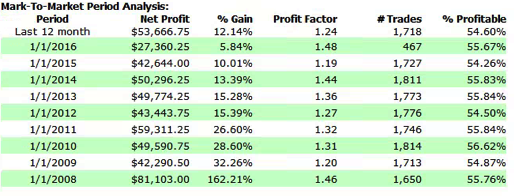
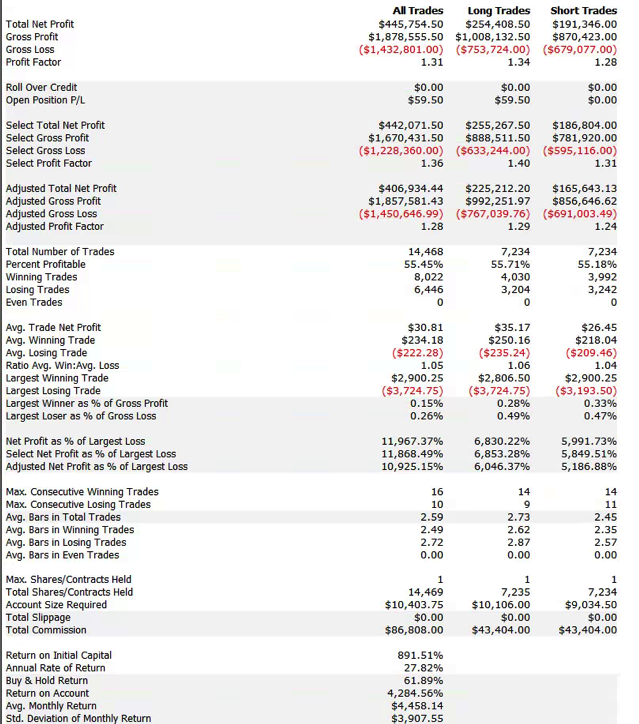
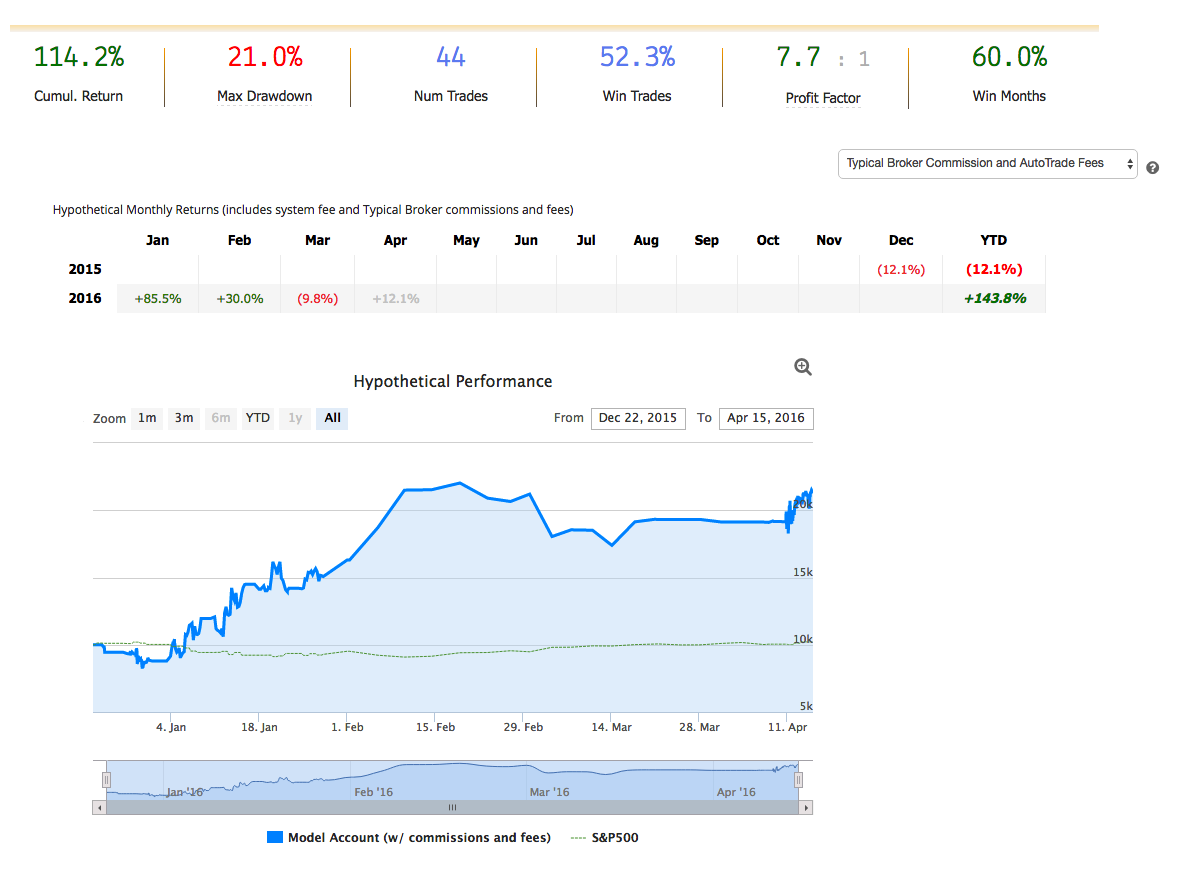
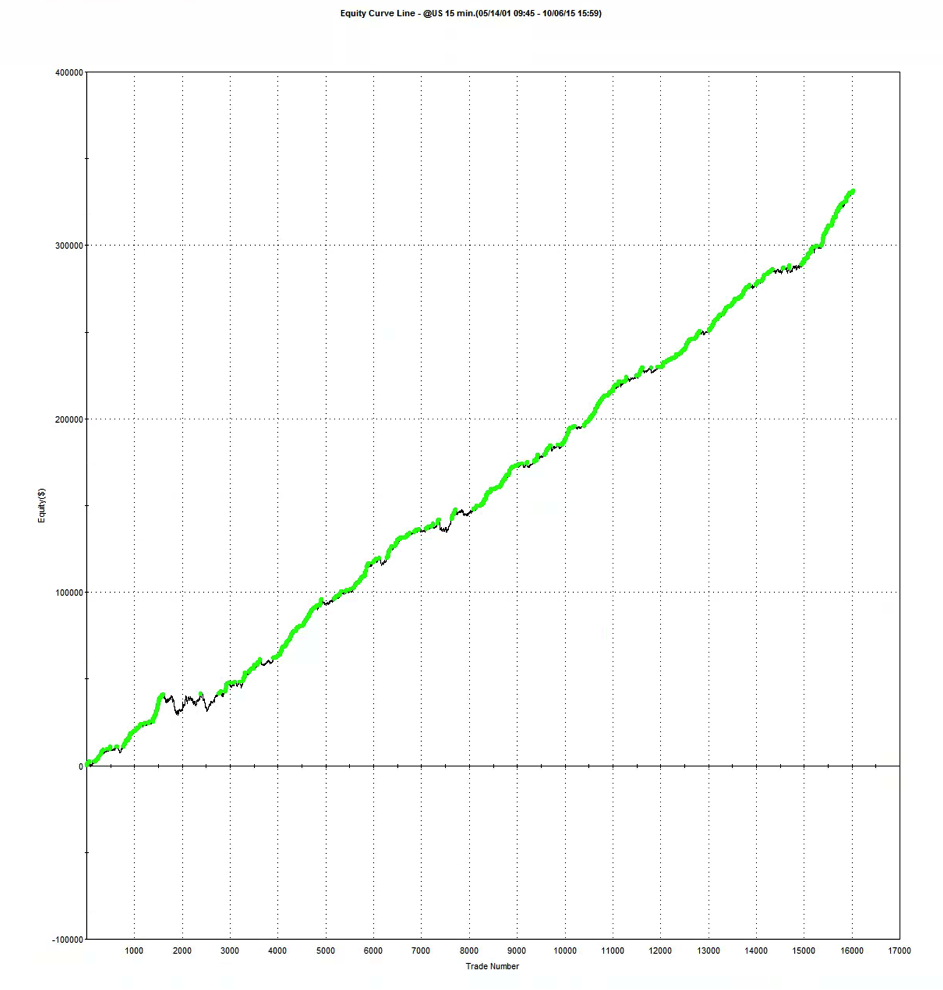
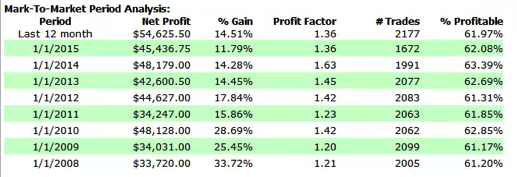
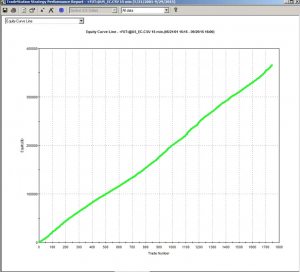
To illustrate the concept we will use an underlying system that trades US Bond futures at 15-minute bar intervals.  The performance of the system is summarized in the chart and table below.

Fig1A


FIG2A


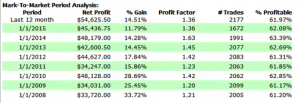
Strategy performance has been very consistent over the last seven years, in terms of the annual returns, number of trades and % win rate.  Can it be improved further?

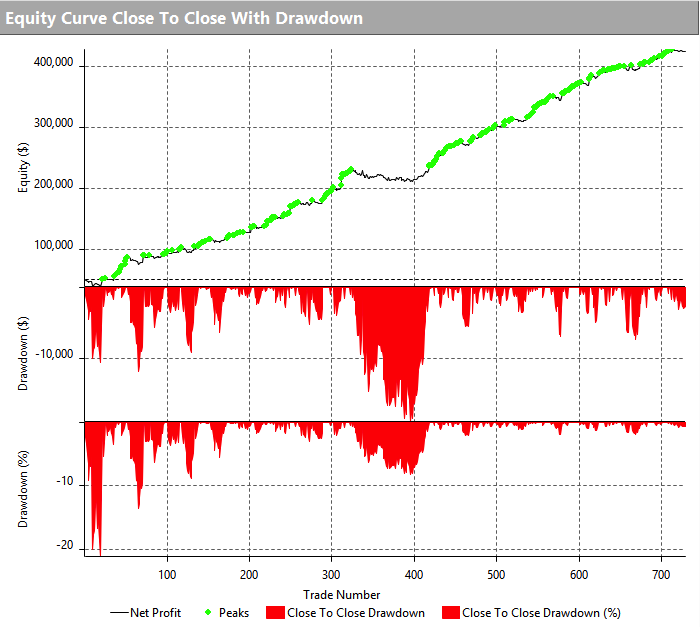
To assess this possibility we create a new data series comprising the points of the equity curve illustrated above.  More specifically, we form a series comprising the open, high, low and close values of the strategy equity, for each trade.  We will proceed to treat this as a new data series and apply a range of different modeling techniques to see if we can develop a trading strategy, in exactly the same way as we would if the underlying was a price series for a stock.

It is important to note here that, for the meta-strategy at least, we are working in trade-time, not calendar time. The x-axis will measure the trade number of the underlying strategy, rather than the date of entry (or exit) of the underlying trade.  Thus equally spaced points on the x-axis represent different lengths of calendar time, depending on the duration of each trade.

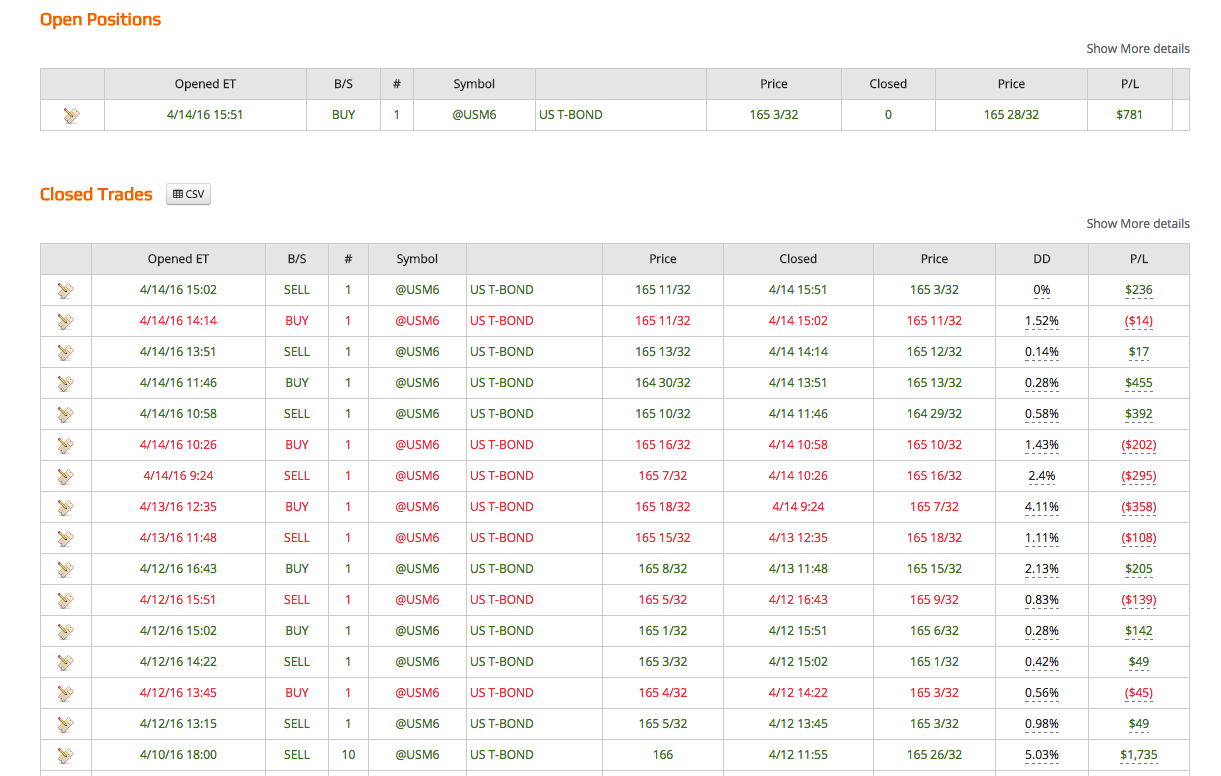
It is necessary to work in trade time rather than calendar time because, unlike a stock, it isn’t possible to trade the underlying strategy whenever we want to – we can only enter or exit the strategy at points in time when it is about to take a trade, by accepting that trade or passing on it (we ignore the other possibility which is sizing the underlying trade, for now).

SSALGOTRADING AD

Another question is what kinds of trading ideas do we want to consider for the meta-strategy?  In principle one could incorporate almost any trading concept, including the usual range of technical indictors such as RSI, or Bollinger bands.  One can go further an use machine learning techniques, including Neural Networks, Random Forest, or SVM.

In practice, one tends to gravitate towards the simpler kinds of trading algorithm, such as moving averages (or MA crossover techniques), although there is nothing to say that more complex trading rules should not be considered.  The development process follows a familiar path:  you create a hypothesis, for example, that the equity curve of the underlying bond futures strategy tends to be mean-reverting, and then proceed to test it using various signals – perhaps a moving average, in this case.  If the signal results in a potential improvement in the performance of the default meta-strategy (which is to take every trade in the underlying system system), one includes it in the library of signals that may ultimately be combined to create the finished meta-strategy.

As with any strategy development you should follows the usual procedure of separating the trade data to create a set used for in-sample modeling and out-of-sample performance testing.

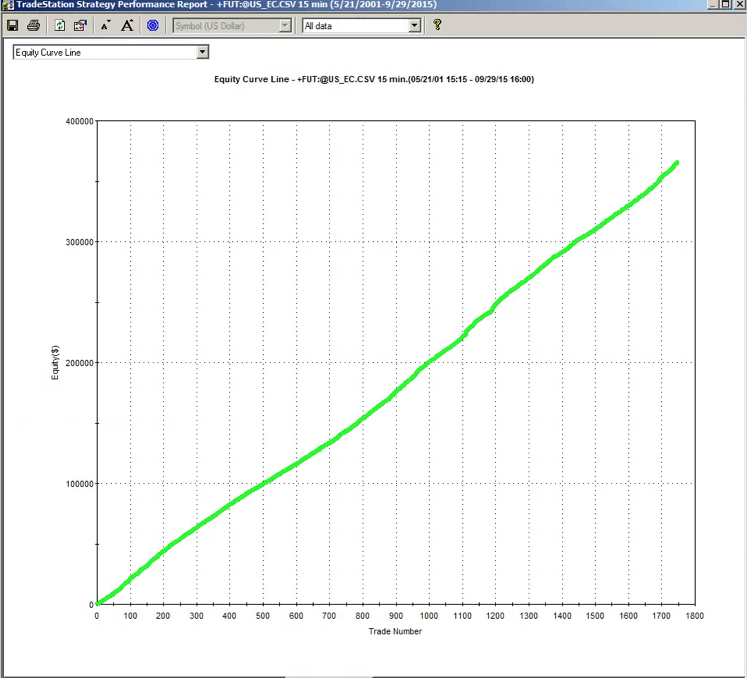
Following this general procedure I arrived at the following meta-strategy for the bond futures trading system.

FigB1

FigB2

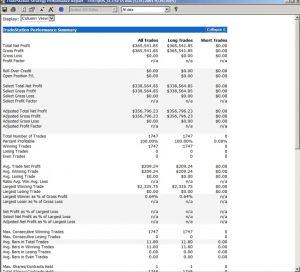
The modeling procedure for the meta-strategy has succeeded in eliminating all of the losing trades in the underlying bond futures system, during both in-sample and out-of-sample periods (comprising the most recent 20% of trades).

In general, it is unlikely that one can hope to improve the performance of the underlying strategy quite as much as this, of course.  But it may well be possible to eliminate a sufficient proportion of losing trades to reduce the equity curve drawdown and/or increase the overall Sharpe ratio by a significant amount.

A Challenge / Opportunity

If you like the meta-strategy concept, but are unsure how to proceed, I may be able to help.

Send me the data for your existing strategy (see details below) and I will attempt to model a meta-strategy and send you the results.  We can together evaluate to what extent I have been successful in improving the performance of the underlying strategy.

Here are the details of what you need to do:

1. You must have an existing, profitable strategy, with sufficient performance history (either real, simulated, or a mixture of the two).  I don’t need to know the details of the underlying strategy, or even what it is trading, although it would be helpful to have that information.

2. You must send  the complete history of the equity curve of the underlying strategy,  in Excel format, with column headings Date, Open, High, Low, Close.  Each row represents consecutive trades of the underlying system and the O/H/L/C refers to the value of the equity curve for each trade.

3.  The history must comprise at least 500 trades as an absolute minimum and preferably 1000 trades, or more.

4. At this stage I can only consider a single underlying strategy (i.e. a single equity curve)

5.  You should not include any software or algorithms of any kind.  Nothing proprietary, in other words.

6.  I will give preference to strategies that have a (partial) live track record.

As my time is very limited these days I will not be able to deal with any submissions that fail to meet these specifications, or to enter into general discussions about the trading strategy with you.

You can reach me at jkinlay@systematic-strategies.com