Covered Writes, Covered Wrongs

What is a Covered Call?

covered call (or covered write or buy-write) is a long position in a security and a short position in a call option on that security.  The diagram below constructs the covered call payoff diagram, including the option premium, at expiration when the call option is written at a $100 strike with a $25 option premium.
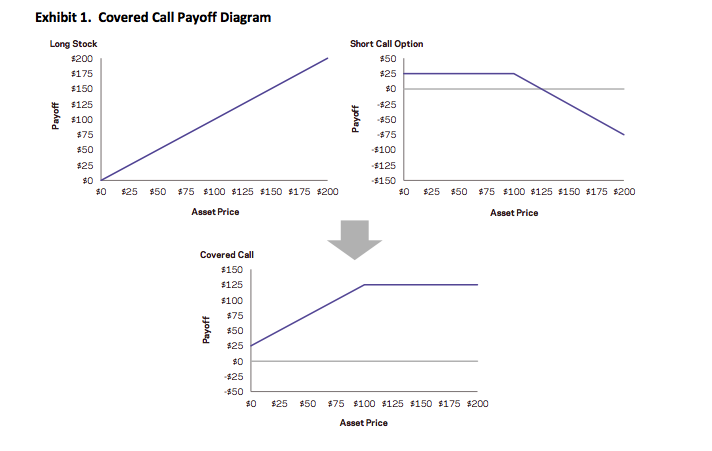
Payoff

Equity index covered calls are an attractive strategy to many investors because they have realized returns not much lower than those of the equity market but with much lower volatility.  But investors often do the trade for the wrong reasons:  there are a number of myths about covered writes that persist even amongst professional options traders.  I have heard most, if not all of them professed by seasons floor traders on the American Stock Exchange and, I confess, I have even used one or two of them myself.  Roni Israelov and Larn Nielsen of AQR Capital Management, LLC have done a fine job of elucidating and then dispelling these misunderstandings about the strategy, in their paper Covered Call Strategies: One Fact and Eight Myths, Financial Analysts Journal, Vol. 70, No. 6, 2014.

SSALGOTRADING AD

The Cover Call Strategy and its Benefits for Investors

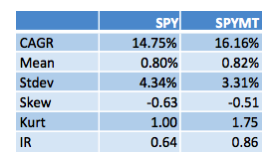
The covered call strategy has generated attention due to its attractive historical risk-adjusted returns. For example, the CBOE S&P 500 BuyWrite Index, the industry-standard covered call benchmark, is commonly described as providing average returns comparable to the S&P 500 Index with approximately two-thirds the volatility, supported by statistics such as those shown below.

Table 1

The key advantages of the strategy (compared to an outright, delta-one position) include lower volatility, beta and tail risk.  As a consequence, the strategy produces higher risk-adjusted rates if return (Sharpe Ratio).  Note, too, the beta convexity of the strategy, a topic I cover in this post:

http://jonathankinlay.com/2017/05/beta-convexity/

Although the BuyWrite Index has historically demonstrated similar total returns to the S&P 500, it does so with a reduced beta to the S&P 500 Index. However, it is important to also understand that the BuyWrite Index is more exposed to negative S&P 500 returns than positive returns. This asymmetric relationship to the S&P 500 is consistent with its payoff characteristics and results from the fact that a covered call strategy sells optionality. What this means in simple terms is that while drawdowns are somewhat mitigated by the revenue associated with call writing, the upside is capped by those same call options.

Understandably, a strategy that produces equity-like return with lower beta and lower risk attracts considerable attention from investors.  According to Moringstar, growth in assets under management in covered call strategies has been over 25% per year over the 10 years through June 2014 with over $45 billion currently invested.

Myths about the Covered Call Strategy

Many option strategies are the subject of investor myths, partly, I suppose, because option strategies are relatively complicated and entail risks in several dimensions.  So it is quite easy for investors to become confused.  Simple anecdotes are attractive because they appear to cut through the complexity with an easily understood metaphor, but they can often be misleading.  An example is the widely-held view – even amongst professional option traders – is that selling volatility via strangles is a less risk approach than selling at-the-money straddles. Intuitively, this makes sense:  why wouldn’t  selling straddles that have strike prices (far) away from the current spot price be less risky than selling straddles that have strike prices close to the spot price?  But, in fact, it turns out that selling straddles is the less risky the two strategies – see this post for details:

http://jonathankinlay.com/2016/11/selling-volatility/

Likewise, the covered call strategy is subject to a number of “urban myths”, that turn out to be unfounded:

Myth 1: Risk exposure is described by the payoff diagram

That is only true at expiration.  Along the way, the positions will be marked-to-market and may produce a substantially different payoff if the trade is terminated early.  The same holds true for a zero-coupon bond – we know the terminal value for certain, but there can be considerable variation in the value of the asset from day to day.

Myth 2: Covered calls provide downside protection

This is partially true, but only in a very limited sense.  Unlike a long option hedge, the “protection” in a buy-write strategy is limited to only the premium collected on the option sale, a relatively modest amount in most cases.  Consider a covered call position on a $100 stock with a $10 at-the-money call premium. The covered call can potentially lose $90 and the long call option can lose $10. Each position has the same 50% exposure to the stock, but the covered call’s downside risk is disproportionate to its stock exposure. This is consistent with the covered call’s realized upside and downside betas as discussed earlier.

Myth 3: Covered calls generate income.

Remember that income is revenue minus costs.

It is true that option selling generates positive cash flow, but this incorrectly leads investors to the conclusion that covered calls generate investment income.  Just as is the case with bond issuance, the revenue generated from selling the call option is not income (though, like income, the cash flows received from selling options are considered taxable for many investors). In order for there to be investment income or earnings, the option must be sold at a favorable price – the option’s implied volatility needs to be higher than the stock’s expected volatility.

Myth 4: Covered calls on high-volatility stocks and/or shorter-dated options provide higher yield.

Though true that high volatility stocks and short-dated options command higher annualized premiums, insurance on riskier assets should rationally command a higher premium and selling insurance more often per year should provide higher annual premiums. However, these do not equate to higher net income or yield. For instance, if options are properly priced (e.g., according to the Black-Scholes pricing model), then selling 12 at-the-money options will generate approximately 3.5 times the cash flow of selling a single annual option, but this does not unequivocally translate into higher net profits as discussed earlier. Assuming fairly priced options, higher revenue is not necessarily a mechanism for increasing investment income.

The key point here is that what matters is value, not price. In other words, expected investment profits are generated by the option’s richness, not the option’s price. For example, if you want to short a stock with what you consider to be a high valuation, then the goal is not to find a stock with a high price, but rather one that is overpriced relative to its fundamental value. The same principle applies to options. It is not appropriate to seek an option with a high price or other characteristics associated with high prices. Investors must instead look for options that are expensive relative to their fundamental value.  Put another way, the investor should seek out options trading at a higher implied volatility than the likely futures realized volatility over the life of the option.

Myth 5: Time decay of options written works in your favor.

While it is true that the value of an option declines over time as it approaches expiration, that is not the whole story.  In fact an option’s expected intrinsic value increases as the underlying security realizes volatility.  What matters is whether the realized volatility turns out to be lower than the volatility baked into the option price – the implied volatility.  In truth, an option’s time decay only works in the seller’s favor if the option is initially priced expensive relative to its fundamental value. If the option is priced cheaply, then time decay works very much against the seller.

Myth 6: Covered calls are appropriate if you have a neutral to moderately bullish view.

This myth is an over-simplification.  In selling a call option you are expressing a view, not only on the future prospects for the stock, but also on its likely future volatility.  It is entirely possible that the stock could stall (or even decline) and yet the value of the option you have sold rises due, say, to takeover rumors.  A neutral view on the stock may imply a belief that the security price will not move far from its current price rather than its expected return is zero. If so, then a short straddle position is a way to express that view — not a covered call — because, in this case, no active position should be taken in the security.

Myth 7: Overwriting pays you for doing what you were going to do anyway

This myth is typically posed as the following question: if you have a price target for selling a stock you own, why not get paid to write a call option struck at that price target?

In fact this myth exposes the critical difference between a plan and a contractual obligation. If the former case, suppose that the stock hits your target price very much more quickly than you had anticipated, perhaps as a result of a new product announcement that you had not anticipated at the time you set your target.  In those circumstances you might very well choose to maintain your long position and revise your price target upwards. This is an example of a plan – a successful one – that can be adjusted to suit circumstances as they change.

A covered call strategy is an obligation, rather than a plan.  You have pre-sold the stock at the target price and, in the above scenario, you cannot change your mind in order to benefit from additional potential upside in the stock.

In other words, with a covered call strategy you have monetized the optionality that is inherent in any plan and turned it into a contractual obligation in exchange for a fee.

Myth 8: Overwriting allows you to buy a stock at a discounted price.

Here is how this myth is typically framed: if a stock that you would like to own is currently priced at $100 and that you think is currently expensive, you can act on that opinion by selling a naked put option at a $95 strike price and collect a premium of say $1. Then, if the price subsequently declines below the strike price, the option will likely be exercised thus requiring you to buy the stock for $95. Including the $1 premium, you effectively buy the stock at a 6% discount. If the option is not exercised you keep the premium as income. So, this type of outcome for selling naked put options may also lead you to conclude that the equivalent covered call strategy makes sense and is valuable.

But this argument is really a sleight of hand.  In our example above, if the option is exercised, then when you buy the stock for $95 you won’t care what the stock price was when you sold the option. What matters is the stock price on the date the option was exercised. If the stock price dropped all the way down to $80, the $95 purchase price no longer seems like a discount. Your P&L will show a mark-to-market loss of $14 ($95 – $80 – $1). The initial stock price is irrelevant and the $1 premium hardly helps.

Conclusion: How to Think About the Covered Call Strategy

Investors should ignore the misleading storytelling about obtaining downside buffers and generating income. A covered call strategy only generates income to the extent that any other strategy generates income, by buying or selling mispriced securities or securities with an embedded risk premium. Avoid the temptation to overly focus on payoff diagrams. If you believe the index will rise and implied volatilities are rich, a covered call is a step in the right direction towards expressing that view.

If you have no view on implied volatility, there is no reason to sell options, or covered calls

Aby znaleźć legalne kasyna online w Polsce, odwiedź stronę pl.kasynopolska10.com/legalne-kasyna/, partnera serwisu recenzującego kasyna online – KasynoPolska10.

Some Further Notes on Market Timing

Almost at the very moment I published a post featuring some interesting research by Glabadanidis (“Market Timing With Moving Averages”  (2015), International Review of Finance, Volume 15, Number 13, Pages 387-425 – see Yes, You Can Time the Market. How it Works, And Why), several readers wrote to point out a recently published paper by Valeriy Zakamulin, (dubbed the “Moving Average Research King” by Alpha Architect, the source for our fetching cover shot) debunking Glabadanidis’s findings in no uncertain terms:

We demonstrate that “too good to be true” reported performance of the moving average strategy is due to simulating the trading with look-ahead bias. We perform the simulations without look-ahead bias and report the true performance of the moving average strategy. We find that at best the performance of the moving average strategy is only marginally better than that of the corresponding buy-and-hold strategy.

So far, no response from Glabadanidis – from which one is tempted to conclude that Zakamulin is correct.

I can’t recall the last time a paper published in a leading academic journal turned out to be so fundamentally flawed.  That’s why papers are supposed to be peer reviewed.   But, I guess, it can happen. Still, it’s rather alarming to think that a respected journal could accept a piece of research as shoddy as Zakamulin claims it to be.

What Glabadanidis had done, according to Zakamulin, was to use the current month closing price to compute the moving average that was used to decide whether to exit the market (or remain invested) at the start of the same month.  An elementary error that introduces look-ahead bias that profoundly impacts the results.

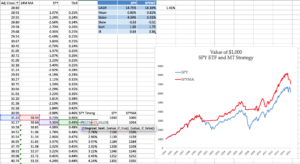
Following this revelation I hastily checked my calculations for the SPY marketing timing  strategy illustrated in my blog post and, to my relief, confirmed that I had avoided the look-ahead trap that Glabadanidis has fallen into.  As the reader can see from the following extract from the Excel spreadsheet I used for the calculations, the decision to assume the returns for the SPY ETF or T-Bills for the current month rests on the value of the 24 month MA computed using prices up to the end of the prior month.  In other words, my own findings are sound, even if Glabadanidis’s are not, as the reader can easily check for himself.


Excel Workbook


Nonetheless, despite my relief at having avoided Glabadanidis’s  blunder, the apparent refutation of his findings comes as a disappointment.  And my own research on the SPY market timing strategy, while sound as far as it goes, cannot by itself rehabilitate the concept of market timing using moving averages.  The reason is given in the earlier post.  There is a hidden penalty involved in using the market timing strategy to synthetically replicate an Asian put option, namely the costs incurred in exiting and rebuilding the portfolio as the market declines below the moving average, or later overtakes it.  In a single instance, such as the case of SPY, it might easily transpire simply by random chance that the cost of replication are far lower than the fair value of the put.  But the whole point of Glabadanidis’s research was that the same was true, not only for a single ETF or stock, but for many thousands of them.  Absent that critical finding, the SPY case is no more than an interesting anomaly.

Finally, one reader pointed out that the effect of combining a put option with a stock (or ETF) long position was to create synthetically a call option in the stock (ETF).  He is quite correct.  The key point, however, is that when the stock trades down below its moving average, the value of the long synthetic call position and the market timing portfolio are equivalent.


Yes, You Can Time the Market. How it Works, And Why

One of the most commonly cited maxims is that market timing is impossible.  In fact, empirical evidence makes a compelling case that market timing is feasible and can yield substantial economic benefits.  What’s more, we even understand why it works.  For the typical portfolio investor, applying simple techniques to adjust their market exposure can prevent substantial losses during market downturns.

The Background From Empirical and Theoretical Research

For the last fifty years, since the work of Paul Samuelson, the prevailing view amongst economists has been that markets are (mostly) efficient and follow a random walk. Empirical evidence to the contrary was mostly regarded as anomalous and/or unimportant economically.  Over time, however, evidence has accumulated that market effects may persist that are exploitable. The famous 1992 paper published by Fama and French, for example, identified important economic effects in stock returns due to size and value factors, while Cahart (1997) demonstrated the important incremental effect of momentum.  The combined four-factor Cahart model explains around 50% of the variation in stock returns, but leaves a large proportion that cannot be accounted for.

Other empirical studies have provided evidence that stock returns are predictable at various frequencies.  Important examples include work by Brock, Lakonishok and LeBaron (1992), Pesaran and Timmermann (1995) and Lo, Mamaysky and Wang (2000), who provide further evidence using a range of technical indicators with wide popularity among traders showing that this adds value even at the individual stock level over and above the performance of a stock index.  The research in these and other papers tends to be exceptional in term of both quality and comprehensiveness, as one might expect from academics risking their reputations in taking on established theory.  The appendix of test results to the Pesaran and Timmermann study, for example, is so lengthy that is available only in CD-ROM format.

A more recent example is the work of Paskalis Glabadanidis, in a 2012 paper entitled Market Timing with Moving Averages.  Glabadanidis examines a simple moving average strategy that, he finds, produces economically and statistically significant alphas of 10% to 15% per year, after transaction costs, and which are largely insensitive to the four Cahart factors. 

Glabadanidis reports evidence regarding the profitability of the MA strategy in seven international stock markets. The performance of the MA strategies also holds for more than 18,000 individual stocks. He finds that:

“The substantial market timing ability of the MA strategy appears to be the main driver of the abnormal returns.”

An Illustration of a Simple Marketing Timing Strategy in SPY

It is impossible to do justice to Glabadanidis’s research in a brief article and the interested reader is recommended to review the paper in full.  However, we can illustrate the essence of the idea using the SPY ETF as an example.   

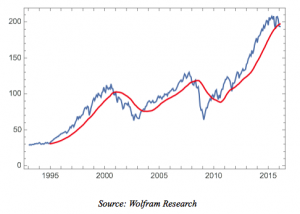
A 24-period moving average of the monthly price series over the period from 1993 to 2016 is plotted in red in the chart below.

Fig1

The moving average indicator is used to time the market using the following simple rule:

if Pt >= MAt  invest in SPY in month t+1

if Pt < MAt  invest in T-bills in month t+1

In other words, we invest or remain invested in SPY when the monthly closing price of the ETF lies at or above the 24-month moving average, otherwise we switch our investment to T-Bills.

The process of switching our investment will naturally incur transaction costs and these are included in the net monthly returns.

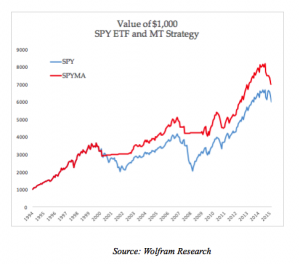
The outcome of the strategy in terms of compound growth is compared to the original long-only SPY investment in the following chart.

Fig2

The marketing timing strategy outperforms the long-only ETF,  with a CAGR of 16.16% vs. 14.75% (net of transaction costs), largely due to its avoidance of the major market sell-offs in 2000-2003 and 2008-2009.

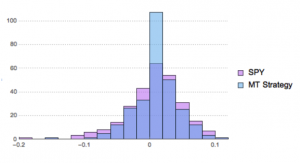
But the improvement isn’t limited to a 141bp improvement in annual compound returns.  The chart below compares the distributions of monthly returns in the SPY ETF and market timing strategy.

Fig3

It is clear that, in addition to a higher average monthly return, the market timing strategy has lower dispersion in the distribution in returns.  This leads to a significantly higher information ratio for the strategy compared to the long-only ETF.  Nor is that all:  the market timing strategy has both higher skewness and kurtosis, both desirable features.

Fig4

These results are entirely consistent with Glabadanidis’s research.  He finds that the performance of the market timing strategy is robust to different lags of the moving average and in subperiods, while investor sentiment, liquidity risks, business cycles, up and down markets, and the default spread cannot fully account for its performance. The strategy works just as well with randomly generated returns and bootstrapped returns as it does for the more than 18,000 stocks in the study.

A follow-up study by the author applying the same methodology to a universe of 20 REIT indices and 274 individual REITs reaches largely similar conclusions.

Why Marketing Timing Works

For many investors, empirical evidence – compelling though it may be – is not enough to make market timing a credible strategy, absent some kind of “fundamental” explanation of why it works.  Unusually, in the case of the simple moving average strategy, such explanation is possible.

It was Cox, Ross and Rubinstein who in 1979 developed the binomial model as a numerical method for pricing options.  The methodology relies on the concept of option replication, in which one constructs a portfolio comprising holdings of the underlying stock and bonds to produce the same cash flows as the option at every point in time (the proportion of stock to hold is given by the option delta).  Since the replicating portfolio produces the same cash flows as the option, it must have the same value and since once knows the price of the stock and bond at each point in time one can therefore price the option.  For those interested in the detail, Wikipedia gives a detailed explanation of the technique.

We can apply the concept of option replication to construct something very close the MA market timing strategy, as follows.  Consider what happens when the ETF falls below the moving average level.  In that case we convert the ETF portfolio to cash and use the proceeds to acquire T-Bills.  An equivalent outcome would be achieved by continuing to hold our long ETF position and acquiring a put option to hedge it.  The combination of a long ETF position, and a 1-month put option with delta of -1, would provide the same riskless payoff as the market timing strategy, i.e. the return on 30-day T-Bills.  An option in which the strike price is based on the average price of the underlying is known as an Arithmetic Asian option.    Hence when we apply the MA timing strategy we are effectively constructing a dynamic portfolio that replicates the payoff of an Arithmetic Asian protective put option struck as (just above) the moving average level.

Market Timing Alpha and The Cost of Hedging

None of this explanation is particularly contentious – the theory behind option replication through dynamic hedging is well understood – and it provides a largely complete understanding of the way the MA market timing strategy works, one that should satisfy those who are otherwise unpersuaded by arguments purely from empirical research.

There is one aspect of the foregoing description that remains a puzzle, however.  An option is a valuable financial instrument and the owner of a protective put of the kind described can expect to pay a price amounting to tens or perhaps hundreds of basis points.  Of course, in the market timing strategy we are not purchasing a put option per se, but creating one synthetically through dynamic replication.  The cost of creating this synthetic equivalent comprises the transaction costs incurred as we liquidate and re-assemble our portfolio from month to month, in the form of bid/ask spread and commissions.  According to efficient market theory, one should be indifferent as to whether one purchases the option at a fair market price or constructs it synthetically through replication – the cost should be equivalent in either case.  And yet in empirical tests the cost of the synthetic protective put falls far short of what one would expect to pay for an equivalent option instrument.  This is, in fact, the source of the alpha in the market timing strategy.

According to efficient market theory one might expect to pay something of the order of 140 basis points a year in transaction costs – the difference between the CAGR of the market timing strategy and the SPY ETF – in order to construct the protective put.  Yet, we find that no such costs are incurred.

Now, it might be argued that there is a hidden cost not revealed in our simple study of a market timing strategy applied to a single underlying ETF, which is the potential costs that could be incurred if the ETF should repeatedly cross and re-cross the level of the moving average, month after month.  In those circumstances the transaction costs would be much higher than indicated here.  The fact that, in a single example, such costs do not arise does not detract in any way from the potential for such a scenario to play out. Therefore, the argument goes, the actual costs from the strategy are likely to prove much higher over time, or when implemented for a large number of stocks.

All well and good, but this is precisely the scenario that Glabadanidis’s research addresses, by examining the outcomes, not only for tens of thousands of stocks, but also using a large number of scenarios generated from random and/or bootstrapped returns.  If the explanation offered did indeed account for the hidden costs of hedging, it would have been evident in the research findings.

Instead, Glabadanidis concludes:

“This switching strategy does not involve any heavy trading when implemented with break-even transaction costs, suggesting that it will be actionable even for small investors.”

Implications For Current Market Conditions

As at the time of writing, in mid-February 2016, the price of the SPY ETF remains just above the 24-month moving average level.  Consequently the market timing strategy implies one should continue to hold the market portfolio for the time being, although that could change very shortly, given recent market action.

Conclusion

The empirical evidence that market timing strategies produce significant alphas is difficult to challenge.  Furthermore, we have reached an understanding of why they work, from an application of widely accepted option replication theory. It appears that using a simple moving average to time market entries and exits is approximately equivalent to hedging a portfolio with a protective Arithmetic Asian put option.

What remains to be answered is why the cost of constructing put protection synthetically is so low.  At the current time, research indicates that market timing strategies consequently are able to generate alphas of 10% to 15% per annum.

References

  1. Brock, W., Lakonishok, J., LeBaron, B., 1992, “Simple Technical Trading Rules and the Stochastic Properties of Stock Returns,” Journal of Finance 47, pp. 1731-1764.
  2. Carhart, M. M., 1997, “On Persistence in Mutual Fund Performance,” Journal of Finance 52, pp. 57–82.

  3. Fama, E. F., French, K. R., 1992, “The Cross-Section of Expected Stock Returns,” Journal of Finance 47(2), 427–465
  4. Glabadanidis, P., 2012, “Market Timing with Moving Averages”, 25th Australasian Finance and Banking Conference.
  5. Glabadanidis, P., 2012, “The Market Timing Power of Moving Averages: Evidence from US REITs and REIT Indexes”, University of Adelaide Business School.
  6. Lo, A., Mamaysky, H., Wang, J., 2000, “Foundations of Technical Analysis: Computational Algorithms, Statistical Inference, and Empirical Implementation,” Journal of Finance 55, 1705–1765.
  7. Pesaran, M.H., Timmermann, A.G., 1995, “Predictability of Stock Returns: Robustness and Economic Significance”, Journal of Finance, Vol. 50 No. 4