A Calendar Spread Strategy in VIX Futures

I have been working on developing some high frequency spread strategies using Trading Technologies’ Algo Strategy Engine, which is extremely impressive (more on this in a later post).  I decided to take a time out to experiment with a slower version of one of the trades, a calendar spread in VIX futures that trades  the spread on the front two contracts.  The strategy applies a variety of trend-following and mean-reversion indicators to trade the spread on a daily basis.

Modeling a spread strategy on a retail platform like Interactivebrokers or TradeStation is extremely challenging, due to the limitations of the platform and the Easylanguage programming language compared to professional platforms that are built for purpose, like TT’s XTrader and development tools like ADL.  If you backtest strategies based on signals generated from the spread calculated using the last traded prices in the two securities, you will almost certainly see “phantom trades” – trades that could not be executed at the indicated spread price (for example, because both contracts last traded on the same side of the bid/ask spread).   You also can’t easily simulate passive entry or exit strategies, which typically constrains you to using market orders for both legs, in and out of the spread.  On the other hand, while using market orders would almost certainly be prohibitively expensive in a high frequency or daytrading context, in a low-frequency scenario the higher transaction costs entailed in aggressive entries and exits are typically amortized over far longer time frames.

SSALGOTRADING AD

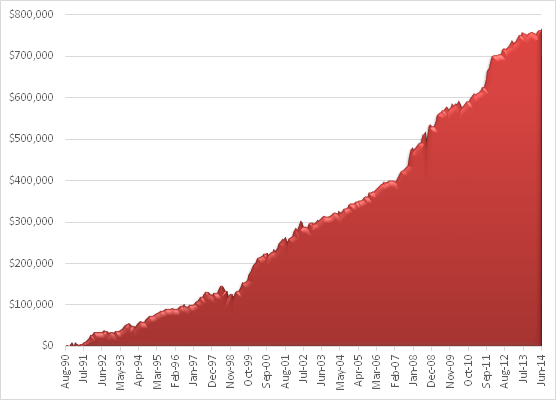
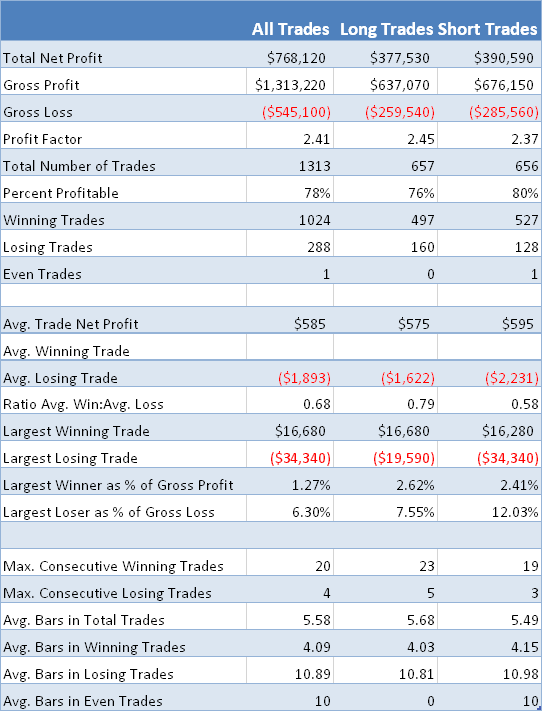
In the following example I have allowed transaction costs of $100 per round turn and slippage of $0.1 (equivalent to $100) per spread.  Daily settlement prices from Mar 2004 to June 2010 were used to fit the model, which was tested out of sample in the period July 2010 to June 2014. Results are summarized in the chart and table below.

Even burdened with significant transaction cost assumptions the strategy performance looks impressive on several counts, notably a profit factor in excess of 300, a win rate of over 90% and a Sortino Ratio of over 6.  These features of the strategy prove robust (and even increase) during the four year out-of-sample period, although the annual net profit per spread declines to around $8,500, from $36,600 for the in-sample period.  Even so, this being a straightforward calendar spread, it should be possible to trade the strategy in size at relative modest margin cost, making the strategy return highly attractive.

Equity Curve

 (click to enlarge)

Performance Results


(click to enlarge)


What Wealth Managers and Family Offices Need to Understand About Alternative Investing

Gold

The most recent Morningstar survey provides an interesting snapshot of the state of the alternatives market.  In 2013, for the third successive year, liquid alternatives was the fastest growing category of mutual funds, drawing in flows totaling $95.6 billion.  The fastest growing subcategories have been long-short stock funds (growing more than 80% in 2013), nontraditional bond funds (79%) and “multi-alternative” fund-of-alts-funds products (57%).

Benchmarking Alternatives
The survey also provides some interesting insights into the misconceptions about alternative investments that remain prevalent amongst advisors, despite contrary indications provided by long-standing academic research.  According to Morningstar, a significant proportion of advisors continue to use inappropriate benchmarks, such as the S&P 500 or Russell 2000, to evaluate alternatives funds (see Some advisers using ill-suited benchmarks to measure alts performance by Trevor Hunnicutt, Investment News July 2014).  As Investment News points out, the problem with applying standards developed to measure the performance of funds that are designed to beat market benchmarks is that many alternative funds are intended to achieve other investment goals, such as reducing volatility or correlation.  These funds will typically have under-performed standard equity indices during the bull market, causing investors to jettison them from their portfolios at a time when the additional protection they offer may be most needed.

SSALGOTRADING AD

This is but one example in a broader spectrum of issues about alternative investing that are poorly understood.  Even where advisors recognize the need for a more appropriate hedge fund index to benchmark fund performance, several traps remain for the unwary.  As shown in Brooks and Kat (The Statistical Properties of Hedge Fund Index Returns and Their Implications for Investors, Journal of Financial and Quantitative Analysis, 2001), there can be considerable heterogeneity between indices that aim to benchmark the same type of strategy, since indices tend to cover different parts of the alternatives universe.  There are also significant differences between indices in terms of their survivorship bias – the tendency to overstate returns by ignoring poorly performing funds that have closed down (see Welcome to the Dark Side – Hedge Fund Attribution and Survivorship Bias, Amin and Kat, Working Paper, 2002).  Hence, even amongst more savvy advisors, the perception of performance tends to be biased by the choice of index.

Risks and Benefits of Diversifying with Alternatives
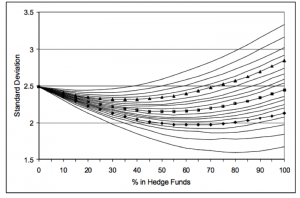
An important and surprising discovery in relation to diversification with alternatives was revealed in Amin and Kat’s Diversification and Yield Enhancement with Hedge Funds (Working Paper, 2002).  Their study showed that the median standard deviation of a portfolio of stocks, bonds and hedge funds reached its lowest point where the allocation to alternatives was 50%, far higher than the 1%-5% typically recommended by advisors.

Standard Deviation of Portfolios of Stocks, Bonds and 20 hedge Funds

Hedge Fund Pct Mix and Volatility

Source: Diversification and Yield Enhancement with Hedge Funds, Amin and Kat, Working Paper, 2002

Another potential problem is that investors will not actually invest in the fund index that is used for benchmarking, but in a basket containing a much smaller number of funds, often through a fund of funds vehicle.  The discrepancy in performance between benchmark and basket can often be substantial in the alternatives space.

Amin and Kat studied this problem in 2002 (Portfolios of Hedge Funds, Working Paper, 2002), by constructing hedge fund portfolios ranging in size from 1 to 20 funds and measuring their performance on a number of criteria that included, not just the average return and standard deviation, but also the skewness (a measure of the asymmetry of returns), kurtosis (a measure of the probability of extreme returns)and the correlation with the S&P 500 Index and the Salomon (now Citigroup) Government Bond Index.  Their startling conclusion was that, in the alternatives space, diversification is not necessarily a good thing.    As expected, as the number of funds in the basket is increased, the overall volatility drops substantially; but at the same time skewness drops and kurtosis and market correlation increase significantly.  In other words, when adding more funds, the likelihood of a large loss increases and the diversification benefit declines.   The researchers found that a good approximation to a typical hedge fund index could be constructed with a basket of just 15 well-chosen funds, in most cases.

Concerns about return distribution characteristics such as skewness and kurtosis may appear arcane, but these factors often become crucially important at just the wrong time, from the investor’s perspective.  When things go wrong in the stock market they also tend to go wrong for hedge funds, as a fall in stock prices is typically accompanied by a drop in market liquidity, a widening of spreads and, often, an increase in stock loan costs.  Equity market neutral and long/short funds that are typically long smaller cap stocks and short larger cap stocks will pay a higher price for the liquidity they need to maintain neutrality.  Likewise, a market sell-off is likely to lead to postponing of M&A transactions that will have a negative impact on the performance of risk arbitrage funds.  Nor are equity-related funds the only alternatives likely to suffer during a market sell-off.  A market fall will typically be accompanied by widening credit spreads, which in turn will damage the performance of fixed income and convertible arbitrage funds.   The key point is that, because they all share this risk, diversification among different funds will not do much to mitigate it.

Conclusions
Many advisors remain wedded to using traditional equity indices that are inappropriate benchmarks for alternative strategies.  Even where more relevant indices are selected, they may suffer from survivorship and fund-selection bias.

In order to reap the diversification benefit from alternatives, research shows that investors should concentrate a significant proportion of their wealth in the limited number of alternatives funds, a portfolio strategy that is diametrically opposed to the “common sense” approach of many advisors.

Finally, advisors often overlook the latent correlation and liquidity risks inherent in alternatives that come into play during market down-turns, at precisely the time when investors are most dependent on diversification to mitigate market risk.  Such risks can be managed, but only by paying attention to portfolio characteristics such as skewness and kurtosis, which alternative funds significantly impact.


Creating Robust, High-Performance Stock Portfolios

Summary

In this article, I am going to look at how stock portfolios should be constructed that best meet investment objectives.

The theoretical and practical difficulties of the widely adopted Modern Portfolio Theory approach limits its usefulness as a tool for portfolio construction.

MPT portfolios typically produce disappointing out-of-sample results, and will often underperform a naïve, equally-weighted stock portfolio.

The article introduces the concept of robust portfolio construction, which leads to portfolios that have more stable performance characteristics, including during periods of high volatility or market corrections.

The benefits of this approach include risk-adjusted returns that substantially exceed those of traditional portfolios, together with much lower drawdowns and correlations.

Market Timing

In an earlier article, I discussed how investors can enhance returns through the strategic use of market timing techniques to step out of the market during difficult conditions.

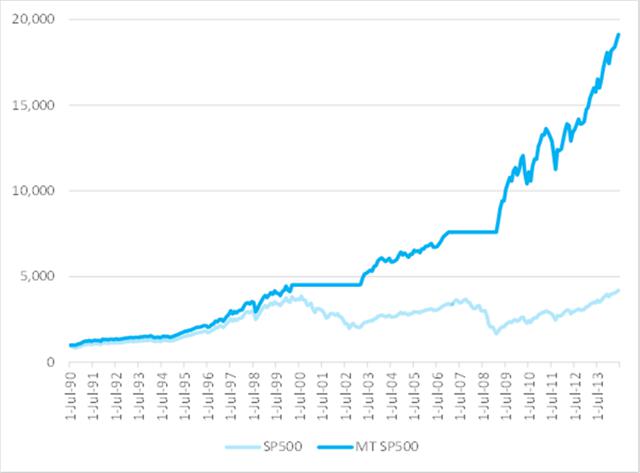
To emphasize the impact of market timing on investment returns, I have summarized in the chart below how a $1,000 investment would have grown over the 25-year period from July 1990 to June 2014. In the baseline scenario, we assume that the investment is made in a fund that tracks the S&P 500 Index and held for the full term. In the second scenario, we look at the outcome if the investor had stepped out of the market during the market downturns from March 2000 to Feb 2003 and from Jan 2007 to Feb 2009.

Fig. 1: Value of $1,000 Jul 1990-Jun 2014 – S&P 500 Index with and without Market Timing
Source: Yahoo Finance, 2014

After 25 years, the investment under the second scenario would have been worth approximately 5x as much as in the baseline scenario. Of course, perfect market timing is unlikely to be achievable. The best an investor can do is employ some kind of market timing indicator, such as the CBOE VIX index, as described in the previous article.

Equity Long Short

For those who mistrust the concept of market timing or who wish to remain invested in the market over the long term regardless of short-term market conditions, an alternative exists that bears consideration.

The equity long/short strategy, in which the investor buys certain stocks while shorting others, is a concept that reputedly originated with Alfred Jones in the 1940s. A long/short equity portfolio seeks to reduce overall market exposure, while profiting from stock gains in the long positions and price declines in the short positions. The idea is that the investor’s equity investments in the long positions are hedged to some degree against a general market decline by the offsetting short positions, from which the concept of a hedge fund is derived.

SSALGOTRADING AD

There are many variations on the long/short theme. Where the long and short positions are individually matched, the strategy is referred to as pairs trading. When the portfolio composition is structured in a way that the overall market exposure on the short side equates to that of the long side, leaving zero net market exposure, the strategy is typically referred to as market-neutral. Variations include dollar-neutral, where the dollar value of aggregate long and short positions is equalized, and beta-neutral, where the portfolio is structured in a way to yield a net zero overall market beta. But in the great majority of cases, such as, for example, in 130/30 strategies, there is a residual net long exposure to the market. Consequently, for the most part, long/short strategies are correlated with the overall market, but they will tend to outperform long-only strategies during market declines, while underperforming during strong market rallies.

Modern Portfolio Theory

Theories abound as to the best way to construct equity portfolios. The most commonly used approach is mean-variance optimization, a concept developed in the 1950s by Harry Markovitz (other more modern approaches include, for example, factor models or CVAR – conditional value at risk).

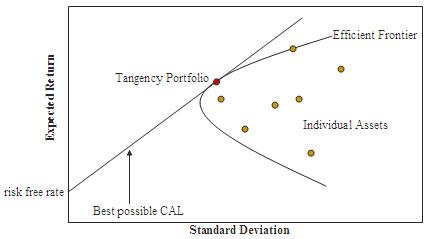
If we plot the risk and expected return of the assets under consideration, in what is referred to as the investment opportunity set, we see a characteristic “bullet” shape, the upper edge of which is called the efficient frontier (See Fig. 2). Assets on the efficient frontier produce the highest level of expected return for a given level of risk. Equivalently, a portfolio lying on the efficient frontier represents the combination offering the best possible expected return for a given risk level. It transpires that for efficient portfolios, the weights to be assigned to individual assets depend only on the volatilities of the individual assets and the correlation between them, and can be determined by simple linear programming. The inclusion of a riskless asset (such as US T-bills) allows us to construct the Capital Market Line, shown in the figure, which is tangent to the efficient frontier at the portfolio with the highest Sharpe Ratio, which is consequently referred to as the Tangency or Optimal Portfolio.

Fig. 2: Investment Opportunity Set and Efficient Frontier
Source: Wikipedia

Paradise Lost

Elegant as it is, MPT is open to challenge as a suitable basis for constructing investment portfolios. The Sharpe Ratio is often an inadequate representation of the investor’s utility function – for example, a strategy may have a high Sharpe Ratio but suffer from large drawdowns, behavior unlikely to be appealing to many investors. Of greater concern is the assumption of constant correlation between the assets in the investment universe. In fact, expected returns, volatilities and correlations fluctuate all the time, inducing changes in the shape of the efficient frontier and the composition of the optimal portfolio, which may be substantial. Not only is the composition of the optimal portfolio unstable, during times of financial crisis, all assets tend to become positively correlated and move down together. The supposed diversification benefit of MPT breaks down when it is needed the most.

I want to spend a little time on these critical issues before introducing a new methodology for portfolio construction. I will illustrate the procedure using a limited investment universe consisting of the dozen stocks listed below. This is, of course, a much more restricted universe than would typically apply in practice, but it does provide a span of different sectors and industries sufficient for our purpose.

Adobe Systems Inc. (NASDAQ:ADBE)
E. I. du Pont de Nemours and Company (NYSE:DD)
The Dow Chemical Company (NYSE:DOW)
Emerson Electric Co. (NYSE:EMR)
Honeywell International Inc. (NYSE:HON)
International Business Machines Corporation (NYSE:IBM)
McDonald’s Corp. (NYSE:MCD)
Oracle Corporation (NYSE:ORCL)
The Procter & Gamble Company (NYSE:PG)
Texas Instruments Inc. (NASDAQ:TXN)
Wells Fargo & Company (NYSE:WFC)
Williams Companies, Inc. (NYSE:WMB)

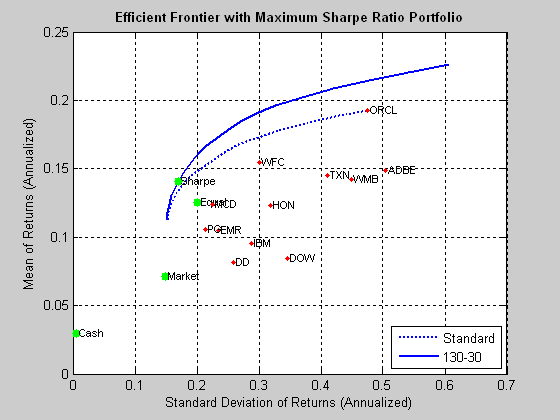
If we follow the procedure outlined in the preceding section, we arrive at the following depiction of the investment opportunity set and efficient frontier. Note that in the following, the S&P 500 index is used as a proxy for the market portfolio, while the equal portfolio designates a portfolio comprising identical dollar amounts invested in each stock.

Fig. 3: Investment Opportunity Set and Efficient Frontiers for the 12-Stock Portfolio
Source: MathWorks Inc.

As you can see, we have derived not one, but two, efficient frontiers. The first is the frontier for standard portfolios that are constrained to be long-only and without use of leverage. The second represents the frontier for 130/30 long-short portfolios, in which we permit leverage of 30%, so that long positions are overweight by a total of 30%, offset by a 30% short allocation. It turns out that in either case, the optimal portfolio yields an average annual return of around 13%, with annual volatility of around 17%, producing a Sharpe ratio of 0.75.

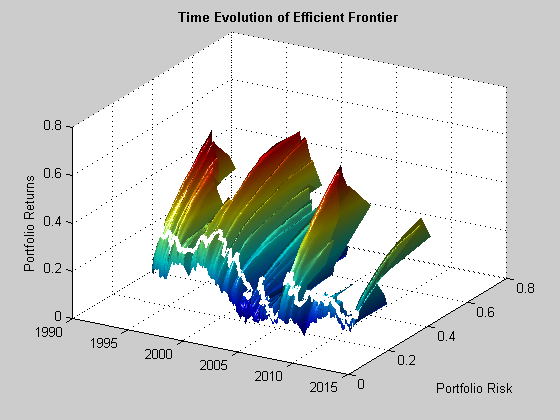
So far so good, but here, of course, we are estimating the optimal portfolio using the entire data set. In practice, we will need to estimate the optimal portfolio with available historical data and rebalance on a regular basis over time. Let’s assume that, starting in July 1995 and rolling forward month by month, we use the latest 60 months of available data to construct the efficient frontier and optimal portfolio.

Fig. 4 below illustrates the enormous variation in the shape of the efficient frontier over time, and in the risk/return profile of the optimal long-only portfolio, shown as the white line traversing the frontier surface.

Fig. 4: Time Evolution of the Efficient Frontier and Optimal Portfolio
Source: MathWorks Inc.

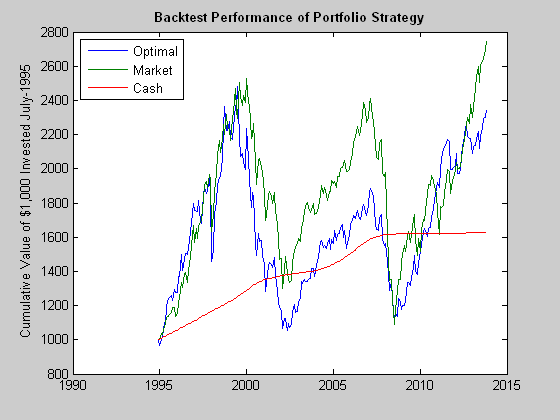
We see in Fig. 5 that the outcome of using the MPT approach is hardly very encouraging: the optimal long-only portfolio underperforms the market both in aggregate, over the entire back-test period, and consistently during the period from 2000-2011. The results for a 130/30 portfolio (not shown) are hardly an improvement, as the use of leverage, if anything, has a tendency to exacerbate portfolio turnover and other undesirable performance characteristics.

Fig. 5: Value of $1,000: Optimal Portfolio vs. S&P 500 Index, Jul 1995-Jun 2014
Source: MathWorks Inc.

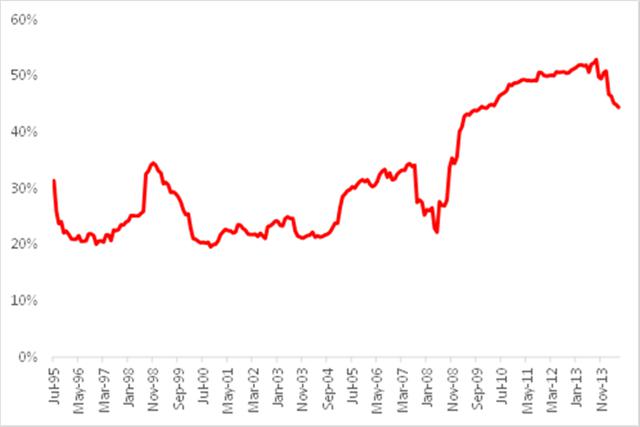
Part of the reason for the poor performance of the optimal portfolio lies with the assumption of constant correlation. In fact, as illustrated in Fig 6, the average correlation between the monthly returns in the twelve stocks in our universe has fluctuated very substantially over the last twenty years, ranging from a low of just over 20% to a high in excess of 50%, with an annual volatility of 38%. Clearly, the assumption of constant correlation is unsafe.

Fig. 6: Average Correlation, Jul 1995-Jun 2014
Source: Yahoo Finance, 2014

To add to the difficulties, researchers have found that the out of sample performance of the naïve portfolio, in which equal dollar value is invested in each stock, is typically no worse than that of portfolios constructed using techniques such as mean-variance optimization or factor models1. Due to the difficulty of accurately estimating asset correlations, it would require an estimation window of 3,000 months of historical data for a portfolio of only 25 assets to produce a mean-variance strategy that would outperform an equally-weighted portfolio!

Without piling on the agony with additional concerns about the MPT methodology, such as the assumption of Normality in asset returns, it is already clear that there are significant shortcomings to the approach.

Robust Portfolios

Many attempts have been made by its supporters to address the practical limitations of MPT, while other researchers have focused attention on alternative methodologies. In practice, however, it remains a challenge for any of the common techniques in use today to produce portfolios that will consistently outperform a naïve, equally-weighted portfolio. The approach discussed here represents a radical departure from standard methods, both in its objectives and in its methodology. I will discuss the general procedure without getting into all of the details, some of which are proprietary.

Let us revert for a moment to the initial discussion of market timing at the start of this article. We showed that if only we could time the market and step aside during major market declines, the outcome for the market portfolio would be a five-fold improvement in performance over the period from Aug 1990 to Jun 2014. In one sense, it would not take “much” to produce a substantial uplift in performance: what is needed is simply the ability to avoid the most extreme market drawdowns. We can identify this as a feature of what might be described as a “robust” portfolio, i.e. one with a limited tendency to participate in major market corrections. Focusing now on the general concept of “robustness”, what other characteristics might we want our ideal portfolio to have? We might consider, for example, some or all of the following:

  1. Ratio of total returns to max drawdown
  2. Percentage of profitable days
  3. Number of drawdowns and average length of drawdowns
  4. Sortino ratio
  5. Correlation to perfect equity curve
  6. Profit factor (ratio of gross profit to gross loss)
  7. Variability in average correlation

The list is by no means exhaustive or prescriptive. But these factors relate to a common theme, which we may characterize as robustness. A portfolio or strategy constructed with these criteria in mind is likely to have a very different composition and set of performance characteristics when compared to an optimal portfolio in the mean-variance sense. Furthermore, it is by no means the case that the robustness of such a portfolio must come at the expense of lower expected returns. As we have seen, a portfolio which only produces a zero return during major market declines has far higher overall returns than one that is correlated with the market. If the portfolio can be constructed in a way that will tend to produce positive returns during market downturns, so much the better. In other words, what we are describing is a long/short portfolio whose correlation to the market adapts to market conditions, having a tendency to become negative when markets are in decline and positive when they are rising.

The first insight of this approach, then, is that we use different criteria, often multi-dimensional, to define optimality. These criteria have a tendency to produce portfolios that behave robustly, performing well during market declines or periods of high volatility, as well as during market rallies.

The second insight from the robust portfolio approach arises from the observation that, ideally, we would want to see much greater consistency in the correlations between assets in the investment universe than is typically the case for stock portfolios. Now, stock correlations are what they are and fluctuate as they will – there is not much one can do about that, at least directly. One solution might be to include other assets, such as commodities, into the mix, in an attempt to reduce and stabilize average asset correlations. But not only is this often undesirable, it is unnecessary – one can, in fact, reduce average correlation levels, while remaining entirely with the equity universe.

The solution to this apparent paradox is simple, albeit entirely at odds with the MPT approach. Instead of creating our portfolio on the basis of combining a group of stocks in some weighting scheme, we are first going to develop investment strategies for each of the stocks individually, before combining them into a portfolio. The strategies for each stock are designed according to several of the criteria of robustness we identified earlier. When combined together, these individual strategies will merge to become a portfolio, with allocations to each stock, just as in any other weighting scheme. And as with any other portfolio, we can set limits on allocations, turnover, or leverage. In this case, however, the resulting portfolio will, like its constituent strategies, display many of the desired characteristics of robustness.

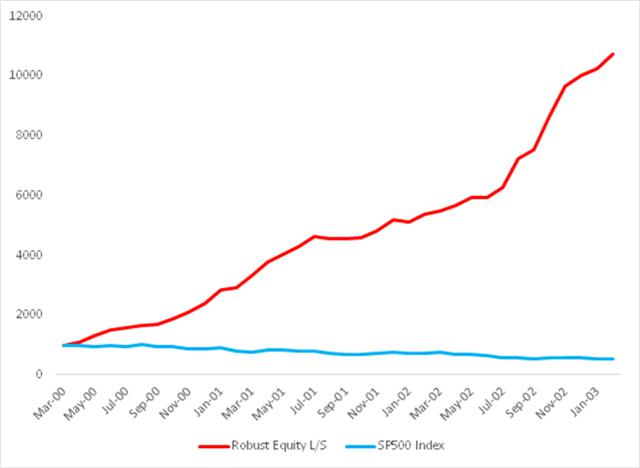
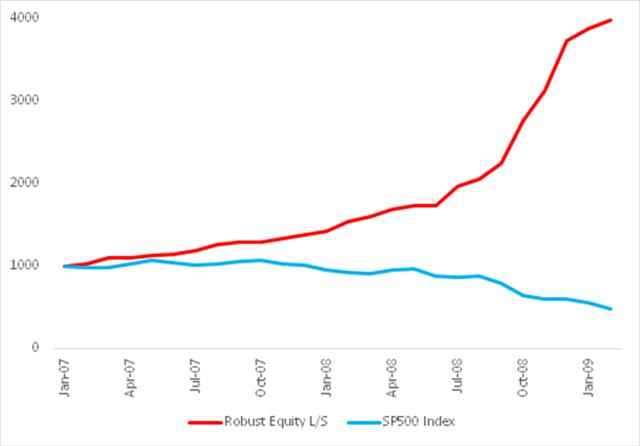
Let’s take a look at how this works out for our sample universe of twelve stocks. I will begin by focusing on the results from the two critical periods from March 2000 to Feb 2003 and from Jan 2007 to Feb 2009.

Fig. 7: Robust Equity Long/Short vs. S&P 500 index, Mar 2000-Feb 2003
Source: Yahoo Finance, 2014

Fig. 8: Robust Equity Long/Short vs. S&P 500 index, Jan 2007-Feb 2009
Source: Yahoo Finance, 2014

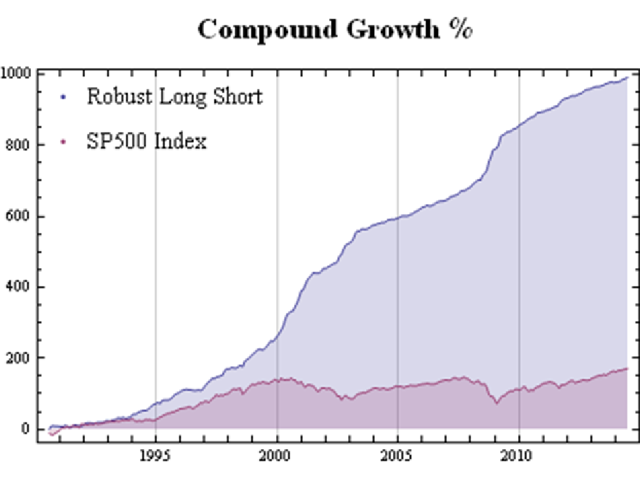
As might be imagined, given its performance during these critical periods, the overall performance of the robust portfolio dominates the market portfolio over the entire period from 1990:

Fig. 9: Robust Equity Long/Short vs. S&P 500 index, Aug 1990-Jun 2014
Source: Yahoo Finance, 2014

It is worth pointing out that even during benign market conditions, such as those prevailing from, say, the end of 2012, the robust portfolio outperforms the market portfolio on a risk-adjusted basis: while the returns are comparable for both, around 36% in total, the annual volatility of the robust portfolio is only 4.8%, compared to 8.4% for the S&P 500 index.

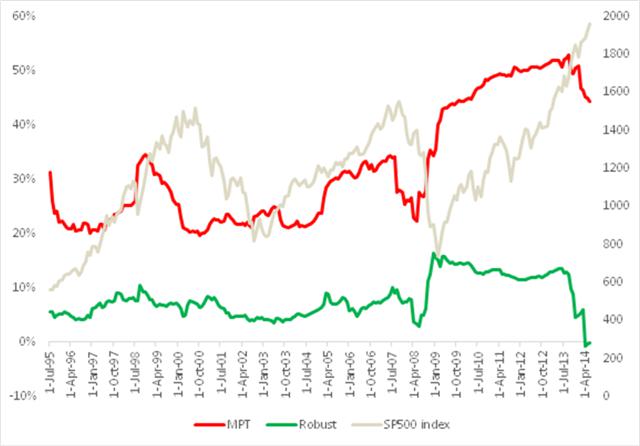
A significant benefit to the robust portfolio derives from the much lower and more stable average correlation between its constituent strategies, compared to the average correlation between the individual equities, which we considered before. As can be seen from Fig. 10, average correlation levels remained under 10% for the robust portfolio, compared to around 25% for the mean-variance optimal portfolio until 2008, rising only to a maximum value of around 15% in 2009. Thereafter, average correlation levels have drifted consistently in the downward direction, and are now very close to zero. Overall, average correlations are much more stable for the constituents in the robust portfolio than for those in the traditional portfolio: annual volatility at 12.2% is less than one-third of the annual volatility of the latter, 38.1%.

Fig. 10: Average Correlations Robust Equity Long/Short vs. S&P 500 index, Aug 1990-Jun 2014
Source: Yahoo Finance, 2014

The much lower average correlation levels mean that it is possible to construct fully diversified portfolios in the robust portfolio framework with fewer assets than in the traditional MPT framework. Put another way, a robust portfolio with a small number of assets will typically produce higher returns with lower volatility than a traditional, optimal portfolio (in the MPT sense) constructed using the same underlying assets.

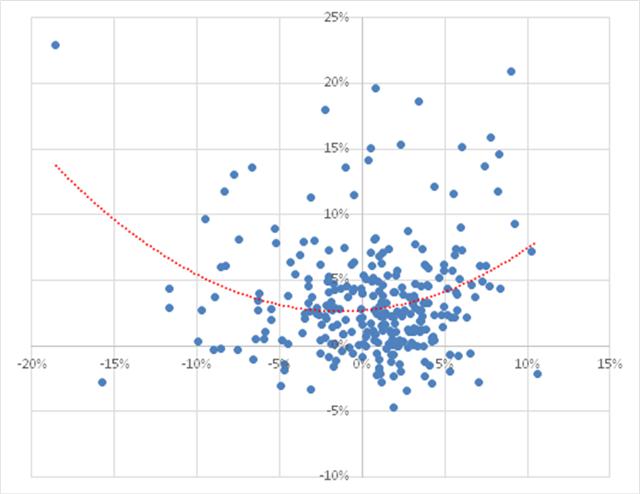
In terms of correlation of the portfolio itself, we find that over the period from Aug 1990 to June 2014, the robust portfolio exhibits close to zero net correlation with the market. However, the summary result disguises yet another important advantage of the robust portfolio. From the scatterplot shown in Fig. 11, we can see that, in fact, the robust portfolio has a tendency to adjust its correlation according to market conditions. When the market is moving positively, the robust portfolio tends to have a positive correlation, while during periods when the market is in decline, the robust portfolio tends to have a negative correlation.

Fig. 11: Correlation between Robust Equity Long/Short vs. S&P 500 index, Aug 1990-Jun 2014
Source: Yahoo Finance, 2014

Optimal Robust Portfolios

The robust portfolio referenced in our discussion hitherto is a naïve portfolio with equal dollar allocations to each individual equity strategy. What happens if we apply MPT to the equity strategy constituents and construct an “optimal” (in the mean-variance sense) robust portfolio?

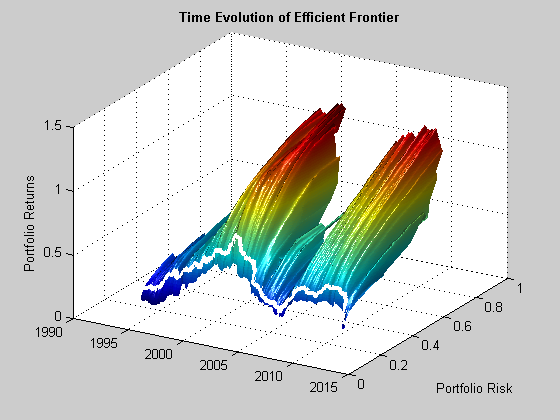
The results from this procedure are summarized in Fig. 12, which shows the evolution of the efficient frontier, traversed by the risk/return path of the optimal robust portfolio. Both show considerable variability. In fact, however, both the frontier and optimal portfolio are far more stable than their equivalents for the traditional MPT strategy.

Fig. 12: Time Evolution of the Efficient Frontier and Optimal Robust Portfolio
Source: MathWorks Inc.

Fig. 13 compares the performance of the naïve robust portfolio and optimal robust portfolio. The optimal portfolio does demonstrate a small, material improvement in risk-adjusted returns, but at the cost of an increase in the maximum drawdown. It is an open question as to whether the modest improvement in performance is sufficient to justify the additional portfolio turnover and commensurate trading cost and operational risk. The incremental benefits are relatively minor, because the equally weighted portfolio is already well-diversified due to the low average correlation in its constituent strategies.

Fig. 13: Naïve vs. Optimal Robust Portfolio Performance Aug 1990-Jun 2014

Source: Yahoo Finance, 2014

Conclusion

The limitations of MPT in terms of its underlying assumptions and implementation challenges limits its usefulness as a practical tool for investors looking to construct equity portfolios that will enable them to achieve their investment objectives. Rather than seeking to optimize risk-adjusted returns in the traditional way, investors may be better served by identifying important characteristics of strategy robustness and using these to create strategies for individual equities that perform robustly across a wide range of market conditions. By constructing portfolios composed of such strategies, rather than using the underlying equities, investors may achieve higher, more stable returns under a broad range of market conditions, including periods of high volatility or market drawdown.

1 Optimal Versus Naive Diversification: How Inefficient is the 1/N Portfolio Strategy?, Victor DeMiguel, Lorenzo Garlappi and Raman Uppal, The Review of Financial Studies, Vol. 22, Issue 5, 2007.

Beating the S&P500 Index with a Low Convexity Portfolio

What is Beta Convexity?

Beta convexity is a measure of how stable a stock beta is across market regimes.  The essential idea is to evaluate the beta of a stock during down-markets, separately from periods when the market is performing well.  By choosing a portfolio of stocks with low beta-convexity we seek to stabilize the overall risk characteristics of our investment portfolio.

A primer on beta convexity and its applications is given in the following post:


In this post I am going to use the beta-convexity concept to construct a long-only equity portfolio capable of out-performing the benchmark S&P 500 index.

The post is in two parts.  In the first section I outline the procedure in Mathematica for downloading data and creating a matrix of stock returns for the S&P 500 membership.  This is purely about the mechanics, likely to be of interest chiefly to Mathematica users. The code deals with the issues of how to handle stocks with multiple different start dates and missing data, a problem that the analyst is faced with on a regular basis.  Details are given in the pdf below. Let’s skip forward to the analysis.

Portfolio Formation & Rebalancing

We begin by importing the data saved using the data retrieval program, which comprises a matrix of (continuously compounded) monthly returns for the S&P500 Index and its constituent stocks.  We select a portfolio size of 50 stocks, a test period of 20 years, with a formation period of 60 months and monthly rebalancing.

In the processing stage, for each month in our 20-year test period we  calculate the beta convexity for each index constituent stock and select the 50 stocks that have the lowest beta-convexity during the prior 5-year formation period.  We then compute the returns for an equally weighted basket of the chosen stocks over the following month.  After that, we roll forward one month and repeat the exercise.

It turns out that beta-convexity tends to be quite unstable, as illustrated for a small sample of component stocks in the chart below:

A snapshot of estimated convexity factors is shown in the following table.  As you can see, there is considerable cross-sectional dispersion in convexity, in addition to time-series dependency.

At any point in time the cross-sectional dispersion is well described by a Weibull distribution, which passes all of the usual goodness-of-fit tests.

Performance Results

We compare the annual returns and standard deviation of the low convexity portfolio with the S&P500 benchmark in the table below. The results indicate that the average gross annual return of a low-convexity portfolio of 50 stocks is more than double that of the benchmark, with a comparable level of volatility. The portfolio also has slightly higher skewness and kurtosis than the benchmark, both desirable characteristics.


Portfolio Alpha & Beta Estimation

Using the standard linear CAPM model we estimate the annual alpha of the low-convexity portfolio to be around 7.39%, with a beta of 0.89.

Beta Convexity of the Low Convexity Portfolio

As we might anticipate, the beta convexity of the portfolio is very low since it comprises stocks with the lowest beta-convexity:

Conclusion: Beating the Benchmark S&P500 Index

Using a beta-convexity factor model, we are able to construct a small portfolio that matches the benchmark index in terms of volatility, but with markedly superior annual returns.  Larger portfolios offering greater liquidity produce slightly lower alpha, but a 100-200 stock portfolio typically produce at least double the annual rate of return of the benchmark over the 20-year test period.

For those interested, we shall shortly be offering a low-convexity strategy on our Systematic Algotrading platform – see details below:

Section on Data Retrieval and Processing

Data Retrieval


Pattern Trading

Summary

  • Pattern trading rules try to identify profit opportunities, based on short term price patterns.
  • An exhaustive test of simple pattern trading rules was conducted for several stocks, incorporating forecasts of the Open, High, Low and Close prices.
  • There is clear evidence that pattern trading rules continue to work consistently for many stocks.
  • Almost all of the optimal pattern trading rules suggest buying the stock if the close is below the mid-range of the day.
  • This “buy the dips” approach can sometimes be improved by overlaying additional conditions, or signals from forecasting models.

MMM

Trading Pattern Rules

From time to time one comes across examples of trading pattern rules that appear to work. By “pattern rule”, I mean something along the lines of: “if the stock closes below the open and today’s high is greater than yesterday’s high, then buy tomorrow’s open”.

Trading rules of this kind are typically one-of-a-kind oddities that only work for limited periods, or specific securities. But I was curious enough to want to investigate the concept of pattern trading, to see if there might be some patterns that are generally applicable and potentially worth trading.

To my surprise, I was able to find such a rule, which I will elaborate on in this article. The rule appears to work consistently for a wide range of stocks, across long time frames. While perhaps not interesting enough to trade by itself, the rule might provide some useful insight and, possibly, be combined with other indicators in a more elaborate trading strategy.

The original basis for this piece of research was the idea of using vector autoregression models to forecast the daily O/H/L/C prices of a stock. The underlying thesis is that there might be information in the historical values of these variables that, combined together, could produce more useful forecasts than, say, using close prices alone. In technical terms, we say that the O/H/L/C price series are cointegrated, which one might think of as a more robust kind of correlation: cointegrated series tend to continue to move together for some underlying economic reason, whereas series that are merely correlated will often see that purely statistical relationship break down. In this case the economic relationship between the O/H/L/C series is clear: the high price will always be greater than the low price, and the open and close prices will always lie between the two. Furthermore, the prices cannot drift arbitrarily far apart indefinitely, since volatility is finite and mean-reverting. So there is some kind of rationale for using a vector autoregression model in this context. But I don’t want to dwell on this idea too much, as it turns out to be useful only at the margin.

SSALGOTRADING AD

To keep it simple I decided to focus attention on simple pattern trades of the following kind:

If Rule1 and/or Rule2 then Trade

Rule1 and Rule2 are simple logical statements of the kind: “Today’s Open greater than yesterday’s Close”, or “today’s High below yesterday’s Low”. The trade can be expressed in combinations of the form “Buy today’s Open, Sell today’s Close”, or “Buy today’s Close, Sell tomorrow’s Close”.

In my model I had to consider rules combining not only the O/H/L/C prices from yesterday, today and tomorrow, but also forecast O/H/L/C prices from the vector autoregression model. This gave rise to hundreds of thousands of possibilities. A brute-force test of every one of them would certainly be feasible, but rather tedious to execute. And many of the possible rules would be redundant – for example a rule such as : “if today’s open is lower than today’s close, buy today’s open”. Rules of that kind will certainly make a great deal of money, but they aren’t practical, unfortunately!

To keep the number of possibilities to a workable number, I restricted the trading rule to the following: “Buy today’s close, sell tomorrow’s close”. Consequently, we are considering long-only trading strategies and we ignore any rules that might require us to short a stock.

I chose stocks with long histories, dating back to at least the beginning of the 1970’s, in order to provide sufficient data to construct the VAR model. Data from the period from Jan 1970 to Dec 2012 were used to estimate the model, and the performance of the various possible trading rules was evaluated using out-of-sample data from Jan 2013 to Jun 2014.

For ease of illustration the algorithms were coded up in MS-Excel (a copy of the Excel workbook is available on request). In evaluating trading rule performance an allowance was made of $1c per share in commission and $2c per share in slippage. Position size was fixed at 1,000 shares. Considering that the trading rules requires entry and exit at market close, a greater allowance for slippage may be required for some stocks. In addition, we should note the practical difficulties of trading a sizeable position at the close, especially in situations where the stock price may be very near to key levels such as the intra-day high or low that our trading rule might want to take account of.

As a further caveat, we should note that there is an element of survivor bias here: in order to fit this test protocol, stocks would have had to survive from the 1970’s to the present day. Many stocks that were current at the start of that period are no longer in existence, due to mergers, bankruptcies, etc. Excluding such stocks from the evaluation will tend to inflate the test results. It should be said that I did conduct similar tests on several now-defunct stocks, for which the outcomes were similar to those presented here, but a fully survivor-bias corrected study is beyond the scope of this article. With that caveat behind us, let’s take a look at some of the results.

Trading Pattern Analysis

Fig. 1 below shows the summary output from the test for the 3M Company (NYSE:MMM). At the top you can see the best trading rule that the system was able to find for this particular stock. In simple English, the rule tells you to buy today’s close in MMM and sell tomorrow’s close, if the stock opened below the forecast of yesterday’s high price and, in addition, the stock closed below the midrange of the day (the average of today’s high and low prices).

Fig. 1 Summary Analysis for MMM 

Fig 1

Source: Yahoo Finance.

The in-sample results from Jan 2000, summarized in left-hand table in Fig. 2 below, are hardly stellar, but do show evidence of a small, but significant edge, with total net returns of 165%, profit factor of 1.38 and % win rate of 54%. And while the trading rule is, ultimately, outperformed by a simple buy-and-hold strategy, after taking into account transaction costs, for extended periods (e.g. 2009-2012), investors would have been better off had they used the trading rule, because it successfully avoided the worst of the effects of the 2008/09 market crash.

Out-of-sample results, shown in the right-hand table, are less encouraging, but net returns are nonetheless positive and the % win rate actually increases to 55%.

Fig 2. Trade Rule Performance

Results1

Source: Yahoo Finance.

I noted earlier that the first part of our trading rule for MMM involved comparing the opening price to the forecast of yesterday’s high, produced by the vector autoregression model, while the second part of the trading rule references only the midrange and closing prices. How much added value does the VAR model provide? We can test this by eliminating the first part of the rule and considering all days in which the stock closed below the midrange. The results turn out to as shown in Fig. 3.

Fig. 3 Performance of Simplified Trading Rule 

Results2

Source: Yahoo Finance.

As expected, the in-sample results from our shortened trading rule are certainly inferior to the original rule, in which the VAR model forecasts played a role. But the out-of-sample performance of the simplified rule is actually improved – not only is the net return higher than before, so too is the % win rate, by a couple of percentage points.

A similar pattern emerges for many other stocks: in almost every case, our test algorithm finds that the best trading rule buys the close, based on a comparison of the closing price to the mid-range price. In some cases, the in-sample test results are improved by adding further conditions, such as we saw in the case of MMM. But, as with MMM, we often find that the additional benefit derived from use of the autoregression model forecasts fails to improve trading rule results in the out-of-sample period, and indeed often makes them worse.

Conclusion

In general, we find evidence that a simple trading rule based on a comparison of the closing price to the mid-range price appears to work for many stocks, across long time spans.

In a sense, this simple trading rule is already well known: it is just a variant of the “buy the dips” idea, where, in this case, we define a dip as being when the stock closes below the mid-range of the day, rather than, say, below a moving average level. The economic basis for this finding is also well known: stocks have positive drift. But it is interesting to find yet another confirmation of this well-known idea. And it leaves open the possibility that the trading concept could be further improved by introducing additional rules, trading indicators, and model forecasts to the mix.

More on Strategy Robustness

Commentators have made the point that a high % win rate is not enough.

Yes, you obviously want to pay attention to other performance metrics also, such as profit factor. In fact, there is no reason why you shouldn’t consider an objective function that explicitly combines various desirable performance measures, for example:

net profit * % win rate * profit factor

Another approach is to build the model using a data set spanning a different period. I did this with WFC using data from 1990, rather than 1970. Not only was the performance from 1990-2014 better, so too was the performance during the OOS period 1970-1989.  Profit factor was 2.49 and %Win rate was 70% across the 44 year period from 1970.  For the period from 1990, the performance metrics increase to 3.04 and 73%, respectively.

SSALGOTRADING AD

So in this case, it appears, a most robust strategy resulted from using less data, rather than more.  At first this appears counterintuitive. But it’s quite possible for a strategy to be over-condition on behavior that is no longer relevant to the market today. Eliminating such conditioning can sometimes enable strategies to emerge that have greater longevity.

WFC from 1970-2014 (1990 data)

Performance

Optimizing Strategy Robustness

Below is the equity curve for an equity strategy I developed recently, implemented in WFC.  The results appear outstanding:  no losing years in over 20 years, profit factor of 2.76 and average win rate of 75%.  Out-of-sample results (double blind) for 2013 and 2014:  net returns of 27% and 16% YTD.

WFC from 1993-2014


So far so good. However, if we take a step back through the earlier out of sample period, from 1970, the picture is rather less rosy:


WFC from 1970-2014


Now, at this point, some of you will be saying:  nothing to see here – it’s obviously just curve fitting.  To which I would respond that I have seen successful strategies, including several hedge fund products, with far shorter and less impressive back-tests than the initial 20-year history I showed above.

SSALGOTRADING AD

That said, would you be willing to take the risk of trading a strategy such as this one?  I would not:  at the back of my mind would always be the concern that the market might easily revert to the conditions that applied during the 1970s and 1980’s.  I expect many investors would share that concern.

But to the point of this post:  most strategies are designed around the criterion of maximizing net profit.  Occasionally you might come across someone who has considered risk, perhaps in the form of drawdown, or Sharpe ratio.  But, in general, it’s all about optimizing performance.

Suppose that, instead of maximizing performance, your objective was to maximize the robustness of the strategy.  What criteria would you use?

In my own research, I have used a great many different objective functions, often multi-dimensional.  Correlation to the perfect equity curve, net profit / max drawdown and Sortino ratio are just a few examples.  But if I had to guess, I would say that the criteria that tends to produce the most robust strategies and reliable out of sample performance is the maximization of the win rate, subject to a minimum number of trades.

I am not aware of a great deal of theory on this topic. I would be interested to learn of other readers’ experience.


Enhancing Mutual Fund Returns With Market Timing

Summary

In this article, I will apply market timing techniques to several popular mutual funds.

The market timing approach produces annual rates of return that are 3% to 7% higher, with lower risk, than an equivalent buy and hold mutual fund investment.

Investors could in some cases have earned more than double the return achieved by holding a mutual fund investment over a 10-year period.

Hedging strategies that use market timing signals are able to sidestep market corrections, volatile conditions and the ensuing equity drawdowns.

Hedged portfolios typically employ around 12% less capital than the equivalent buy and hold strategy.

Background to the Market Timing Approach

In an earlier article, I discussed how to use marketing timing techniques to hedge an equity portfolio correlated to the broad market. I showed how, by using signals produced by a trading system modeled on the CBOE VIX index, we can smooth out volatility in an equity portfolio consisting of holdings in the SPDR S&P 500 ETF (NYSEARCA:SPY). An investor will typically reduce their equity holdings by a modest amount, say 20%, or step out of the market altogether during periods when the VIX index is forecast to rise, returning to the market when the VIX is likely to fall. An investment strategy based on this approach would have avoided most of the 2000-03 correction, as well as much of the market turmoil of 2008-09.

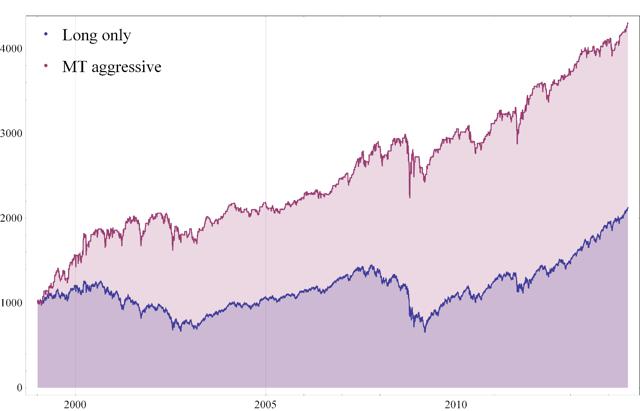
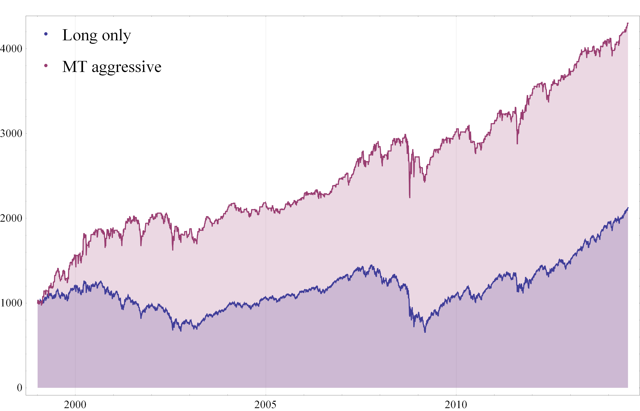
A more levered version of the hedging strategy, which I termed the MT aggressive portfolio, uses the VIX index signals to go to cash during high volatility periods, and then double the original equity portfolio holdings (using standard Reg-T leverage) during benign market conditions, as signaled by the model. The MT aggressive approach would have yielded net returns almost three times greater than that of a buy and hold portfolio in the SPY ETF, over the period from 1999-2014. Even though this version of the strategy makes use of leverage, the average holding in the portfolio would have been slightly lower than in the buy and hold portfolio because, in a majority of days, the strategy would have been 100% in cash. The result is illustrated in the chart in Fig. 1, which is reproduced below.

Fig. 1: Value of $1,000 – Long-Only Vs. MT Aggressive Portfolio

Source: Yahoo Finance.

Note that this approach does not entail shorting any stock. And for investors who prefer to buy and hold, I would make the point that the MT aggressive approach would have enabled you to buy almost three times as much stock in dollar terms by mid-2014 than would be the case if you had simply owned the SPY portfolio over the entire period.

SSALGOTRADING AD

Market Timing and Mutual Funds

With that background, we turn our attention to how we can use market timing techniques to improve returns from equity mutual funds. The funds selected for analysis are the Vanguard 500 Index Admiral (MUTF:VFIAX), Fidelity Spartan 500 Index Advtg (MUTF:FUSVX) and BlackRock S&P 500 Stock K (MUTF:WFSPX). This group of popular mutual funds is a representative sample of available funds that offer broad equity market exposure, with a high degree of correlation to the S&P 500 index. In what follows, we will focus attention on the MT aggressive approach, although other more conservative hedging strategies are equally valid.

We consider performance over the 10-year period from 2005, as at least one of the funds opened late in 2004. In each case, the MT aggressive portfolio is created by exiting the current mutual fund position and going 100% to cash, whenever the VIX model issues a buy signal in the VIX index. Conversely, we double our original mutual fund investment when the model issues a sell signal in the VIX index. In calculating returns, we make an allowance for trading costs of $3 cents per share for all transactions.

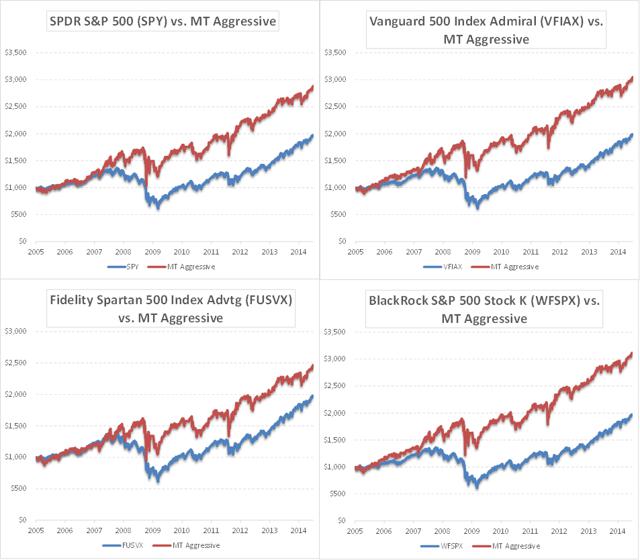
Returns for each of the mutual funds, as well as for the SPY ETF and the corresponding MT aggressive hedge strategies, are illustrated in the charts in Fig. 2. The broad pattern is similar in each case – we see significant outperformance of the MT aggressive portfolios relative to their ETF or mutual fund benchmarks. Furthermore, in most cases the hedge strategy tends to exhibit lower volatility, with less prolonged drawdowns during critical periods such as 2000/03 and 2008/09.

Fig. 2 – Value of $1,000: Mutual Fund Vs. MT Aggressive Portfolio January 2005 – June 2014

Source: Yahoo Finance.

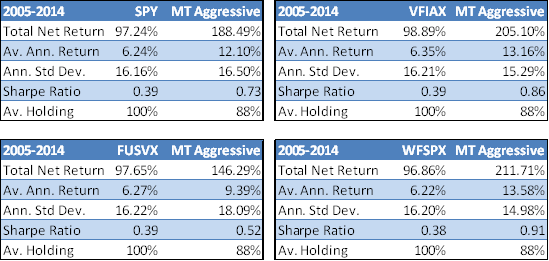
Looking at the performance numbers in more detail, we can see from the tables shown in Fig. 3 that the MT aggressive strategies outperformed their mutual fund buy and hold benchmarks by a substantial margin. In the case of VFIAX and WFSPX, the hedge strategies produce a total net return more than double that of the corresponding mutual fund. With one exception, FUSVX, annual volatility of the MT aggressive portfolio was similar to, or lower than, that of the corresponding mutual fund, confirming our reading of the charts in Fig. 2. As a consequence, the MT aggressive strategies have higher Sharpe Ratios than any of the mutual funds. The improvement in risk adjusted returns is significant – more than double in the case of two of the funds, and about 40% higher in the case of the third.

Finally, we note that the MT aggressive strategies have an average holding that is around 12% lower than the equivalent long-only fund. That’s because of the periods in which investment proceeds are held in cash.

Fig. 3: Mutual Fund and MT Aggressive Portfolio Performance January 2005 – June 2014

Mutual Fund vs. MT Aggressive Portfolio Performance

Source: Yahoo Finance.

Conclusion

The aim of market timing is to smooth out the returns by hedging, and preferably avoiding altogether periods of market turmoil. In other words, the objective is to achieve the same, or better, rates of return, with lower volatility and drawdowns. We have demonstrated that this can be done, not only when the underlying investment is in an ETF such as SPY, but also where we hold an investment in one of several popular equity mutual funds. Over a 10-year period the hedge strategies produced consistently higher returns, with lower volatility and drawdown, while putting less capital at risk than their counterpart buy and hold mutual fund investments.

How to Bulletproof Your Portfolio

Summary

How to stay in the market and navigate the rocky terrain ahead, without risking hard won gains.

A hedging program to get you out of trouble at the right time and step back in when skies are clear.

Even a modest ability to time the market can produce enormous dividends over the long haul.

Investors can benefit by using quantitative market timing techniques to strategically adjust their market exposure.

Market timing can be a useful tool to avoid major corrections, increasing investment returns, while reducing volatility and drawdowns.

The Role of Market Timing

Investors have enjoyed record returns since the market lows in March 2009, but sentiment is growing that we may be in the final stages of this extended bull run. The road ahead could be considerably rockier. How do you stay the course, without risking all those hard won gains?

The smart move might be to take some money off the table at this point. But there could be adverse tax effects from cashing out and, besides, you can’t afford to sit on the sidelines and miss another 3,000 points on the Dow. Hedging tools like index options, or inverse volatility plays such as the VelocityShares Daily Inverse VIX Short-Term ETN (NASDAQ:XIV), are too expensive. What you need is a hedging program that will get you out of trouble at the right time – and step back in when the skies are clear. We’re talking about a concept known as market timing.

Market timing is the ability to switch between risky investments such as stocks and less-risky investments like bonds by anticipating the overall trend in the market. It’s extremely difficult to do. But as Nobel prize-winning economist Robert C. Merton pointed out in the 1980s, even a modest ability to time the market can produce enormous dividends over the long haul. This is where quantitative techniques can help – regardless of the nature of your underlying investment strategy.

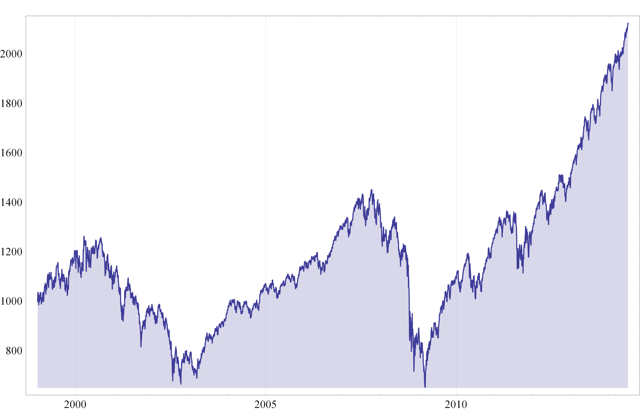
Let’s assume that your investment portfolio is correlated with a broad US equity index – we’ll use the SPDR S&P 500 Trust ETF (NYSEARCA:SPY) as a proxy, for illustrative purposes. While the market has more than doubled over the last 15 years, this represents a modest average annual return of only 7.21%, accompanied by high levels of volatility of 20.48% annually, not to mention sizeable drawdowns in 2000 and 2008/09.

Fig. 1 SPY – Value of $1,000 Jan 1999 – Jul 2014

Fig. 1 SPY - Value of $1,000 Jan 1999 - Jul 2014

Source: Yahoo! Finance, 2014

The aim of market timing is to smooth out the returns by hedging, and preferably avoiding altogether, periods of market turmoil. In other words, the aim is to achieve the same, or better, rates of return, with lower volatility and drawdown.

Market Timing with the VIX Index

The mechanism we are going to use for timing our investment is the CBOE VIX index, a measure of anticipated market volatility in the S&P 500 index. It is well known that the VIX and S&P 500 indices are negatively correlated – when one rises, the other tends to fall. By acting ahead of rising levels of the VIX index, we might avoid difficult market conditions when market volatility is high and returns are likely to be low. Our aim would be to reduce market exposure during such periods and increase exposure when the VIX is in decline.

SSALGOTRADING AD

Forecasting the VIX index is a complex topic in its own right. The approach I am going to take here is simpler: instead of developing a forecasting model, I am going to use an algorithm to “trade” the VIX index. When the trading model “buys” the VIX index, we will assume it is anticipating increased market volatility and lighten our exposure accordingly. When the model “sells” the VIX, we will increase market exposure.

Don’t be misled by the apparent simplicity of this approach: a trading algorithm is often much more complex in its structure than even a very sophisticated forecasting model. For example, it can incorporate many different kinds of non-linear behavior and dynamically adjust its investment horizon. The results from such a trading algorithm, produced by our quantitative modeling system, are set out in the figure below.

Fig. 2a -VIX Trading Algorithm – Equity Curve

Fig. 2a -VIX Trading Algorithm - Equity Curve

Source: TradeStation Technologies Inc.

Fig. 2b -VIX Trading Algorithm – Performance Analysis

Fig. 2b -VIX Trading Algorithm - Performance Analysis

Source: TradeStation Technologies Inc.

Not only is the strategy very profitable, it has several desirable features, including a high percentage of winning trades. If this were an actual trading system, we might want to trade it in production. But, of course, it is only a theoretical model – the VIX index itself is not tradable – and, besides, the intention here is not to trade the algorithm, but to use it for market timing purposes.

Our approach is straightforward: when the algorithm generates a “buy” signal in the VIX, we will reduce our exposure to the market. When the system initiates a “sell”, we will increase our market exposure. Trades generated by the VIX algorithm are held for around five days on average, so we can anticipate rebalancing our portfolio approximately weekly. In what follows, we will assume that we adjust our position by trading the SPY ETF at the closing price the day following a signal from the VIX model. We will apply trading commissions of $1c per share and a further $1c per share in slippage.

Hedging Strategies

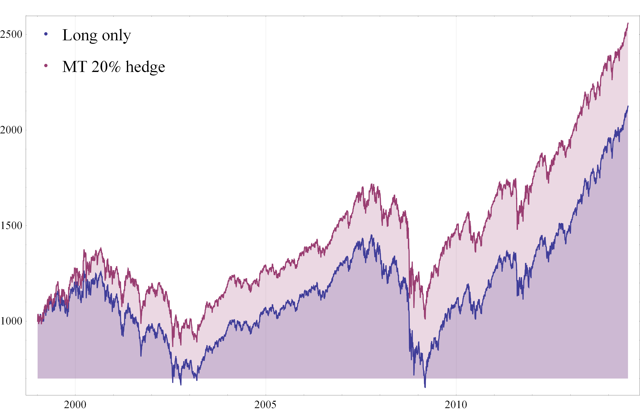
Let’s begin our evaluation by looking at the outcome if we adjust the SPY holding in our market portfolio by 20% whenever the VIX model generates a signal. When the model buys the VIX, we will reduce our original SPY holding by 20%, and when it sells the VIX, we will increase our SPY holding by 20%, using the original holding in the long only portfolio as a baseline. We refer to this in the chart below as the MT 20% hedge portfolio.

Fig. 3 Value of $1000 – Long only vs MT 20% hedge portfolio

Fig. 3 Value of $1000 - Long only vs MT 20% hedge portfolio

Source: Yahoo! Finance, 2014

The hedge portfolio dominates the long only portfolio over the entire period from 1999, producing a total net return of 156% compared to 112% for the SPY ETF. Not only is the rate of return higher, at 10.00% vs. 7.21% annually, volatility in investment returns is also significantly reduced (17.15% vs 20.48%). Although it, too, suffers substantial drawdowns in 2000 and 2008/09, the effects on the hedge portfolio are less severe. It appears that our market timing approach adds value.

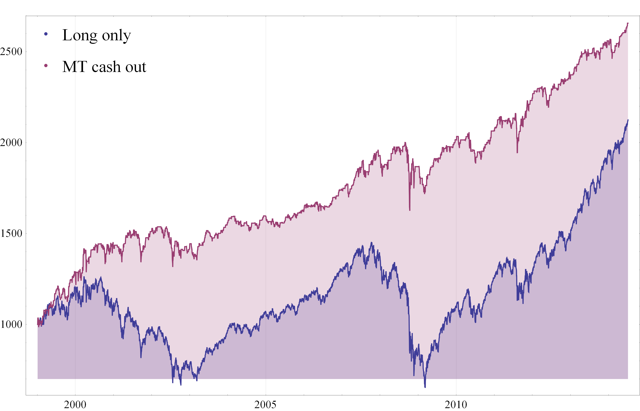
The selection of 20% as a hedge ratio is somewhat arbitrary – an argument can be made for smaller, or larger, hedge adjustments. Let’s consider a different scenario, one in which we exit our long-only position entirely, whenever the VIX algorithm issues a buy order. We will re-buy our entire original SPY holding whenever the model issues a sell order in the VIX. We refer to this strategy variant as the MT cash out portfolio. Let’s look at how the results compare.

Fig. 4 Value of $1,000 – Long only vs MT cash out portfolio

Fig. 4 value of $1,000 - Long only vs MT cash out portfolio

Source: Yahoo! Finance, 2014

The MT cash out portfolio appears to do everything we hoped for, avoiding the downturn of 2000 almost entirely and the worst of the market turmoil in 2008/09. Total net return over the period rises to 165%, with higher average annual returns of 10.62%. Annual volatility of 9.95% is less than half that of the long only portfolio.

Finally, let’s consider a more extreme approach, which I have termed the “MT aggressive portfolio”. Here, whenever the VIX model issues a buy order we sell our entire SPY holding, as with the MT cash out strategy. Now, however, whenever the model issues a sell order on the VIX, we invest heavily in the market, buying double our original holding in SPY (i.e. we are using standard, reg-T leverage of 2:1, available to most investors). In fact, our average holding over the period turns out to be slightly lower than for the original long only portfolio because we are 100% in cash for slightly more than half the time. But the outcome represents a substantial improvement.

Fig. 5 Value of $1,000 – Long only vs. MT aggressive portfolio

Fig. 5 Value of $1,000 - Long only vs. MT aggressive portfolio

Source: Yahoo! Finance, 2014

Total net returns for the MT aggressive portfolio at 330% are about three times that of the original long only portfolio. Annual volatility at 14.90% is greater than for the MT cash out portfolio due to the use of leverage. But this is still significantly lower than the 20.48% annual volatility of the long only portfolio, while the annual rate of return of 21.16% is the highest of the group, by far. And here, too, the hedge strategy succeeds in protecting our investment portfolio from the worst of the effects of downturns in 2000 and 2008.

Conclusion

Whatever the basis for their underlying investment strategy, investors can benefit by using quantitative market timing techniques to strategically adjust their market exposure. Market timing can be a useful tool to avoid major downturns, increasing investment returns while reducing volatility. This could be especially relevant in the weeks and months ahead, as we may be facing a period of greater uncertainty and, potentially at least, the risk of a significant market correction.

Disclosure: The author has no positions in any stocks mentioned, and no plans to initiate any positions within the next 72 hours. The author wrote this article themselves, and it expresses their own opinions. The author is not receiving compensation for it (other than from Seeking Alpha). The author has no business relationship with any company whose stock is mentioned in this article.

How Not to Develop Trading Strategies – A Cautionary Tale

In his post on Multi-Market Techniques for Robust Trading Strategies (http://www.adaptrade.com/Newsletter/NL-MultiMarket.htm) Michael Bryant of Adaptrade discusses some interesting approaches to improving model robustness. One is to use data from several correlated assets to build the model, on the basis that if the algorithm works for several assets with differing price levels, that would tend to corroborate the system’s robustness. The second approach he advocates is to use data from the same asset series at different bars lengths. The example he uses @ES.D at 5, 7 and 9 minute bars. The argument in favor of this approach is the same as for the first, albeit in this case the underlying asset is the same.

I like Michael’s idea in principle, but I wanted to give you a sense of what can all too easily go wrong with GP modeling, even using techniques such as multi-time frame fitting and Monte Carlo simulation to improve robustness testing.

In the chart below I have extended the analysis back in time, beyond the 2011-2012 period that Michael used to build his original model. As you can see, most of the returns are generated in-sample, in the 2011-2012 period. As we look back over the period from 2007-2010, the results are distinctly unimpressive – the strategy basically trades sideways for four years.

Adaptrade ES Strategy in Multiple Time Frames


How do Do It Right

In my view, there is only one, safe way to use GP to develop strategies. Firstly, you need to use a very long span of data – as much as possible, to fit your model. Only in this way can you ensure that the model has encountered enough variation in market conditions to stand a reasonable chance of being able to adapt to changing market conditions in future.

SSALGOTRADING AD

Secondly, you need to use two OOS period. The first OOS span of data, drawn from the start of the data series, is used in the normal way, to visually inspect the performance of the model. But the second span of OOS data, from more recent history, is NOT examined before the model is finalized. This is really important. Products like Adaptrade make it too easy for the system designer to “cheat”, by looking at the recent performance of his trading system “out of sample” and selecting models that do well in that period. But the very process of examining OOS performance introduces bias into the system. It would be like adding a line of code saying something like:

IF (model performance in OOS period > x) do the following….

I am quite sure if I posted a strategy with a line of code like that in it, it would immediately be shot down as being blatantly biased, and quite rightly so. But, if I look at the recent “OOS” performance and use it to select the model, I am effectively doing exactly the same thing.

That is why it is so important to have a second span of OOS data that it not only not used to build the model, but also is not used to assess performance, until after the final model selection is made. For that reason, the second OOS period is referred to as a “double blind” test.

That’s the procedure I followed to build my futures daytrading strategy: I used as much data as possible, dating from 2002. The first 20% of the each data set was used for normal OOS testing. But the second set of data, from Jan 2012 onwards, was my double-blind data set. Only when I saw that the system maintained performance in BOTH OOS periods was I reasonably confident of the system’s robustness.

DoubleBlind

This further explains why it is so challenging to develop higher frequency strategies using GP. Running even a very fast GP modeling system on a large span of high frequency data can take inordinate amounts of time.

The longest span of 5-min bar data that a GP system can handle would typically be around 5-7 years. This is probably not quite enough to build a truly robust system, although if you pick you time span carefully it might be (I generally like to use the 2006-2011 period, which has lots of market variation).

For 15 minute bar data, a well-designed GP system can usually handle all the available data you can throw at it – from 1999 in the case of the Emini, for instance.

Why I don’t Like Fitting Models over Short Time Spans

The risks of fitting models to data in short time spans are intuitively obvious. If you happen to pick a data set in which the market is in a strong uptrend, then your model is going to focus on that kind of market behavior. Subsequently, when the trend changes, the strategy will typically break down.
Monte Carlo simulation isn’t going to change much in this situation: sure, it will help a bit, perhaps, but since the resampled data is all drawn from the same original data set, in most cases the simulated paths will also show a strong uptrend – all that will be shown is that there is some doubt about the strength of the trend. But a completely different scenario, in which, say, the market drops by 10%, is unlikely to appear.

One possible answer to that problem, recommended by some system developers, is simply to rebuild the model when a breakdown is detected. While it’s true that a product like MSA can make detection easier, rebuilding the model is another question altogether. There is no guarantee that the kind of model that has worked hitherto can be re-tooled to work once again. In fact, there may be no viable trading system that can handle the new market dynamics.

Here is a case in point. We have a system that works well on 10 min bars in TF.D up until around May 2012, when MSA indicates a breakdown in strategy performance.

TF.F Monte Carlo

So now we try to fit a new model, along the pattern of the original model, taking account some of the new data.  But it turns out to be just a Band-Aid – after a few more data points the strategy breaks down again, irretrievably.

TF EC 1

This is typical of what often happens when you use GP to build a model using s short span of data. That’s why I prefer to use a long time span, even at lower frequency. The chances of being able to build a robust system that will adapt well to changing market conditions are much higher.

A Robust Emini Trading System

Here, for example is a GP system build on daily data in @ES.D from 1999 to 2011 (i.e. 2012 to 2014 is OOS).

ES.D EC