Momentum Strategies

A few weeks ago I wrote an extensive post on a simple momentum strategy in E-Mini Futures. The basic idea is to buy the S&P500 E-Mini futures when the contract makes a new intraday high. This is subject to the qualification that the Internal Bar Strength fall below a selected threshold level. In order words, after a period of short-term weakness – indicated by the low reading of the Internal Bar Strength – we buy when the futures recover to make a new intraday high, suggesting continued forward momentum.

IBS is quite a useful trading indicator, which you can learn more about in the blog post:

A characteristic of momentum strategies is that they can often be applied successfully across several markets, usually with simple tweaks to the strategy parameters. As a case in point, take our Tech Momentum strategy, listed on the Systematic Strategies Algotrading platform which you can find out more about here:

This swing trading strategy applies similar momentum concepts to exploits long and short momentum effects in technology sector ETFs, focusing on the PROSHARES ULTRAPRO QQQ (TQQQ) and PROSHARES ULTRAPRO SHORT QQQ (SQQQ). Does it work? The results speak for themselves:

In four years of live trading the strategy has produced a compound annual return of 48.9%, with a Sharpe Ratio of 1.78 and Sortino Ratio of 2.98. 2018 is proving to be a banner year for the strategy, which is up by more than 48% YTD.

A very attractive feature of this momentum approach is that it is almost completely uncorrelated with the market and with a beta of just over 1 is hardly more risky than the market portfolio.

You can find out more about the Tech Momentum and other momentum strategies and how to trade them live in your own account on our Strategy Leaderboard:

New Algotrading Platform

Fig1


Systematic Strategies is pleased to announce the launch of its new Algo Trading Platform.  This will allow subscribers to follow a selection of our best strategies in equities, futures and options, for a low monthly subscription fee.

There is no minimum account size, and accounts of up to $250,000 can be traded on the platform.

The strategies are fully systematic and trades are executed automatically in your existing brokerage account, or you can open an account at one of our supported brokers, which include  Interactive Brokers, NinjaTrader, CQG, Gain Capital, AMP, Garwood, and many others.


Fig2


Find Strategies

Short LineFig3


Find Strategies


Short Line

FAQ1 FAQ2


More


Short Line

SYSTEMATIC STRATEGIES LLC

Systematic Strategies is an alternative investments firm utilizing quantitative modeling techniques to develop profitable trading strategies for deployment into global markets. Systematic Strategies seeks qualified investors as defined in Regulation D of the Securities Act of 1933. For information please contact us at info@ systematic-strategies.com or visit www.systematic-strategies.com.


RISK DISCLOSURE

This web site and the information contained herein is not and must not be construed as an offer to sell securities. Certain statements included in this web site, including, without limitation, statements regarding investment goals, strategies, and statements as to the manager’s expectations or opinions are forward-looking statements within the meaning of Section 27A of the Securities Act of 1933 (the “Securities Act”) and Section 21E of the Securities Exchange Act of 1944 (the “Exchange Act”) and are subject to risks and uncertainties. The factors discussed herein could cause actual results and development to be materially different from those expressed in or implied by such forward-looking statements. Accordingly, the information in this web site cannot be construed as to be guaranteed.

Algorithmic Trading on Collective 2


Regular readers will recall my mentioning out VIX Futures scalping strategy which we ran on the Collective2 site for a while:


VIX HFT Scalper


The strategy, while performing very well, proved difficult for subscribers to implement, given the latencies involved in routing orders via the Collective 2 web site.  So we began thinking about slower strategies that investors could follow more easily, placing less reliance on the fill rate for limit orders.

Our VIX ETF Trader strategy has been running on Collective 2 for several months now and is being traded successfully by several subscribers.  The performance so far has been quite good, with net returns of 58.9% from July 2016 and a Sharpe ratio over 2, which is not at all bad for a low frequency strategy.  The strategy enters and exits using a mix of  limit and stop orders, so although some slippage is incurred the trade entries and exits work much more smoothly overall.

Having let the strategy settle for several months trading only the ProShares Short VIX Short-Term Futures ETF (SVXY)we are now ready to ramp things up.  From today the strategy will also trade several other VIX ETF products including the VelocityShares Daily Inverse VIX ST ETN (XIV), ProShares Ultra VIX Short-Term Futures (UVXY) and VelocityShares Daily 2x VIX ST ETN (TVIX).  All of the trades in these products are entered and exited using market or stop orders, and so will be easy for subscribers to follow.  For now we are keeping the required account size pegged at $25,000 although we will review that going forward.  My guess is that a capital allocation should be more than sufficient to trade the product in the kind of size we use on the Collective 2 versions of the strategies, especially if the account uses portfolio margin rather than standard Reg-T.

With the addition of the new products to the portfolio mix, we anticipate the strategy Sharpe ratio with rise to over 3 in the year ahead.


VIX ETF Strategy


The advantage of using a site like Collective 2 from the investor’s viewpoint is that, firstly, you get to see a lot of different trading styles and investment strategies.  You can select the strategies in a wide range of asset classes that fit your own investment preferences and trade several of them live in your own brokerage account.  (Setting up your account for live trading is straightforward, as described on the C2 site).  A major advantage of investing this way is that it doesn’t entail the commitment of capital that is typically required for a hedge fund or managed account investment:  you can trade the strategies in much smaller size, to fit your budget.

From our perspective, we find it a useful way to showcase some of the strategies we trade in our hedge fund, so that if investors want to they can move up to more advanced, but similar investment products.  We plan to launch new strategies on Collective 2 in the near futures , including an equity portfolio strategy and a CTA futures strategy.

If you would like more information, contact us for further details.


Trading Market Sentiment

Text and sentiment analysis has become a very popular topic in quantitative research over the last decade, with applications ranging from market research and political science, to e-commerce.  In this post I am going to outline an approach to the subject, together with some core techniques, that have applications in investment strategy.

In the early days of the developing field of market sentiment analysis, the supply of machine readable content was limited to mainstream providers of financial news such as Reuters or Bloomberg. Over time this has changed with the entry of new competitors in the provision of machine readable news, including, for example, Ravenpack or more recent arrivals like Accern.  Providers often seek to sell not only the raw news feed service, but also their own proprietary sentiment indicators that are claimed to provide additional insight into how individual stocks, market sectors, or the overall market are likely to react to news.  There is now what appears to be a cottage industry producing white papers seeking to demonstrate the value of these services, often accompanied by some impressive pro-forma performance statistics for the accompanying strategies, which include long-only, long/short, market neutral and statistical arbitrage.

For the purpose of demonstration I intend to forego the blandishments of these services, although many are no doubt are excellent, since the reader is perhaps unlikely to have access to them.  Instead, in what follows I will focus on a single news source, albeit a highly regarded one:  the Wall Street Journal.  This is, of course, a simplification intended for illustrative purposes only – in practice one would need to use a wide variety of news sources and perhaps subscribe to a machine readable news feed service.  But similar principles and techniques can be applied to any number of news feeds or online sites.

SSALGOTRADING AD

The WSJ News Archive

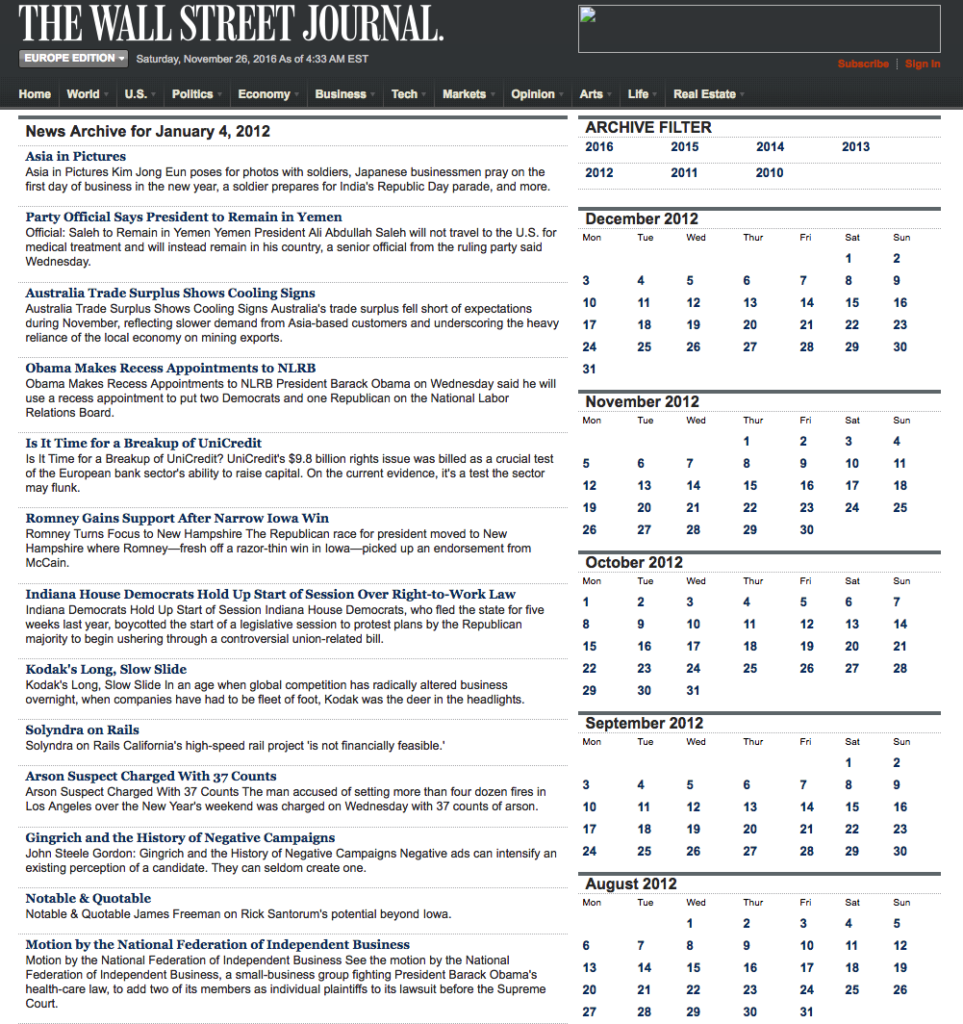
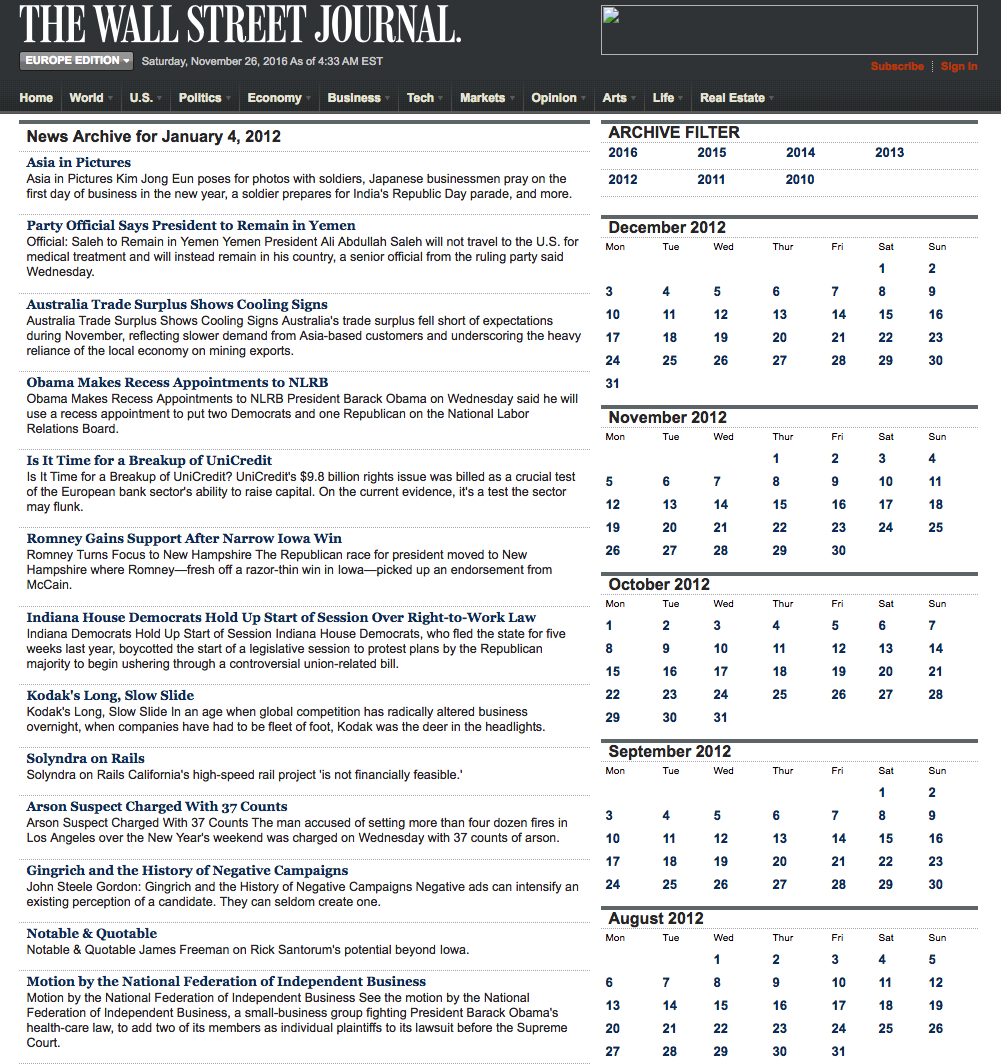
We are going to access the Journal’s online archive, which presents daily news items in a convenient summary format, an example of which is shown below. The archive runs from the beginning of 2012 through to the current day, providing ample data for analysis.  In what follows, I am going to make two important assumptions, neither of which is likely to be 100% accurate – but which will not detract too much from the validity of the research, I hope.  The first assumption is that the news items shown in each daily archive were reported prior to the market open at 9:30 AM.  This is likely to be true for the great majority of the stories, but there are no doubt important exceptions.  Since we intend to treat the news content of each archive as antecedent to the market action during the corresponding trading session, exceptions are likely to introduce an element of look-ahead bias.  The second assumption is that the archive for each day is shown in the form in which it would have appeared on the day in question.  In reality, there are likely to have been revisions to some of the stories made subsequent to their initial publication. So, here too, we must allow for the possibility of look-ahead bias in the ensuing analysis.

fig1


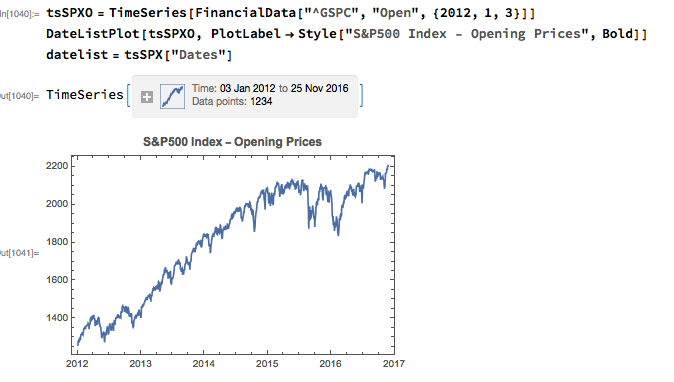
With those caveats out of the way, let’s proceed.  We are going to be using broad market data for the S&P 500 index in the analysis to follow, so the first step is to download daily price series for the index.  Note that we begin with daily opening prices, since we intend to illustrate the application of news sentiment analysis with a theoretical day-trading strategy that takes positions at the start of each trading session, exiting at market close.

fig2

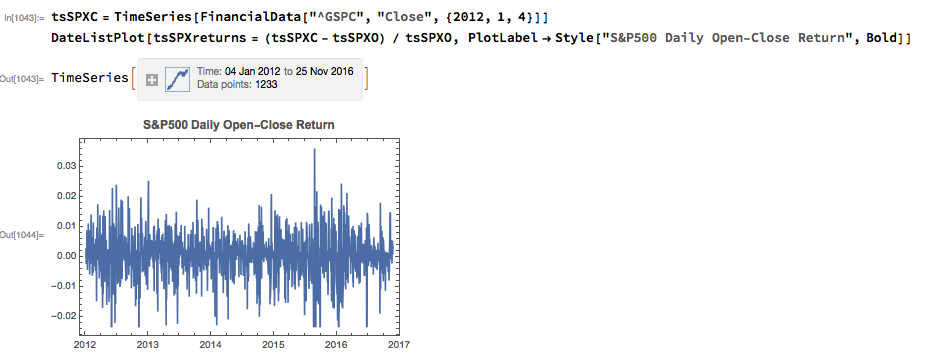
From there we calculate the intraday return in the index, from market open to close, as follows:

fig3

Text Analysis & Classification

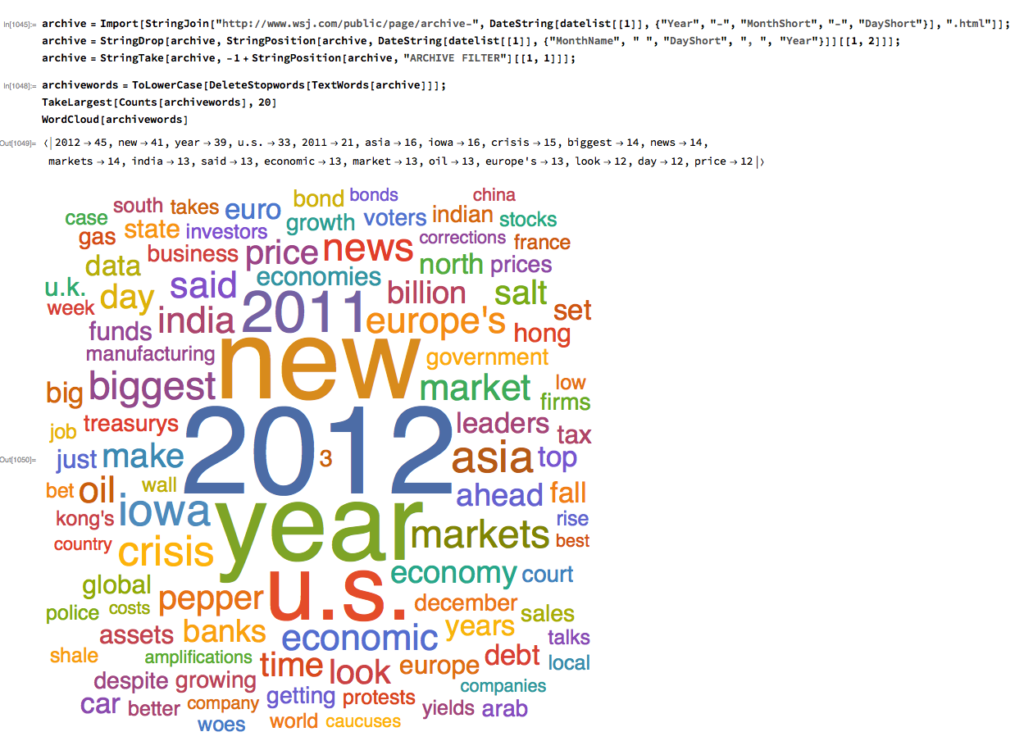
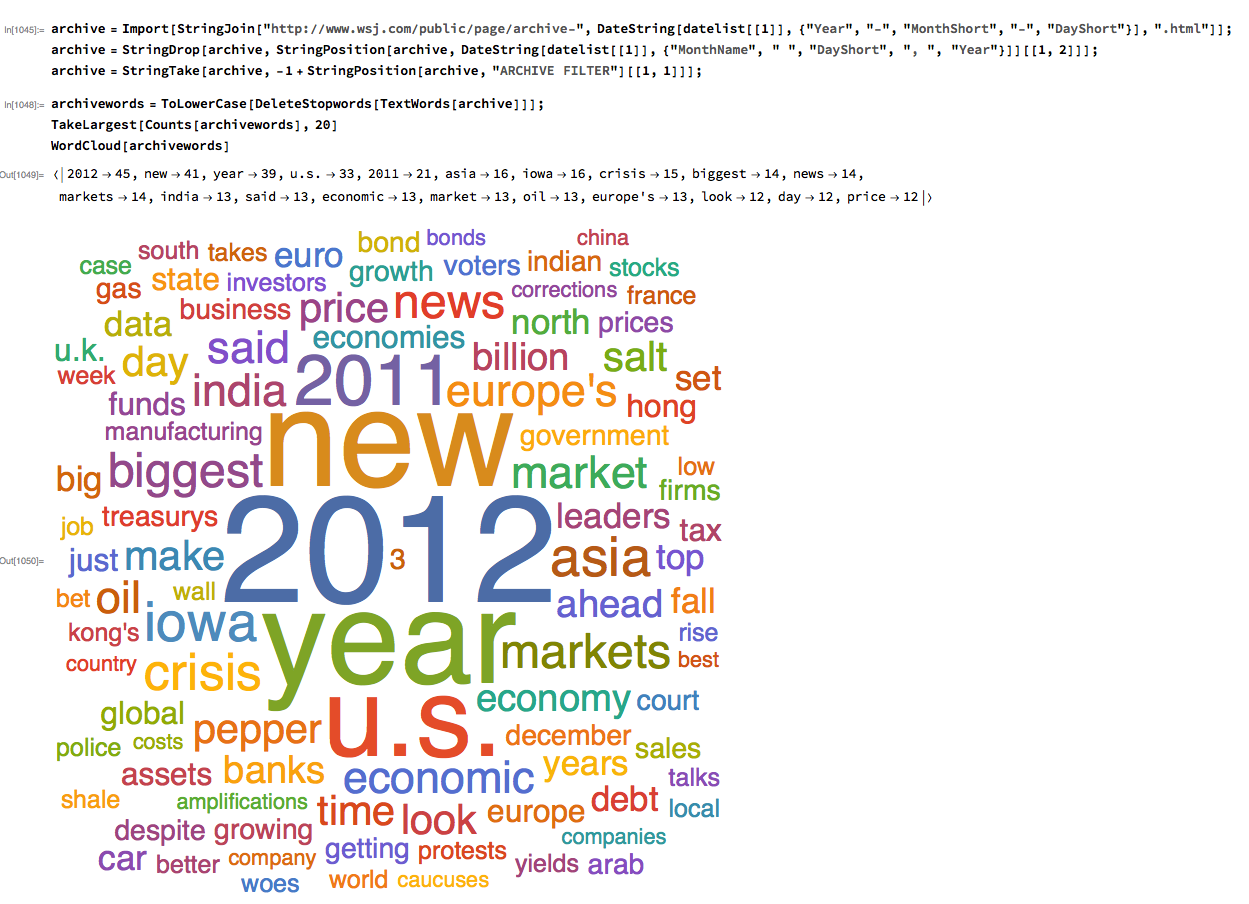
Next we turn to the task of reading the news archive and categorizing its content.  Mathematica makes the importation of html pages very straightforward,  and we can easily crop the raw text string to exclude page headers and footers.  The approach I am going to take is to derive a sentiment indicator based on an analysis of the sentiment of each word in the daily archive.  Before we can do that we must first convert the text into individuals words, stripping out standard stop-words such as “the” and “in” and converting all the text to lower case.  Naturally one can take this pre-processing a great deal further, by identifying and separating out proper nouns, for example.  Once the text processing stage is complete we can quickly summarize the content, for example by looking at the most common words, or by representing the entire archive in the form of a word cloud.  Given that we are using the archive for the first business day of 2012, it is perhaps unsurprising that we find that “2012”, “new” and “year” feature so prominently!

fig4


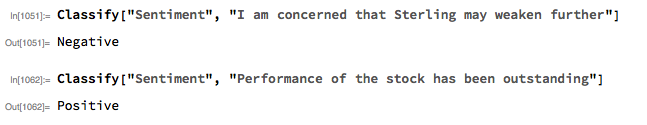
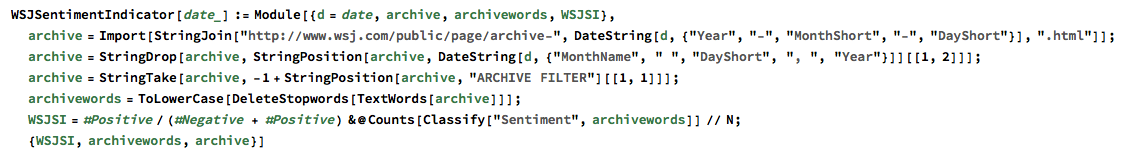
The subject of sentiment analysis is a complex one and I only touch on it here.  For those interested in the subject I can recommend The Text Mining Handbook, by Feldman and Sanger, which is a standard work on the topic.  Here I am going to employ a machine learning classifier provided with Mathematica 11.  It is not terribly sophisticated (or, at least, has not been developed with financial applications especially in mind), but will serve for the purposes of this article.  For those unfamiliar with the functionality, the operation of the sentiment classification algorithm is straightforward enough.  For instance:

fig5

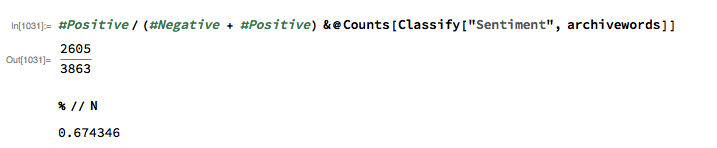
We apply the algorithm to classify each word in the daily news archive and arrive at a sentiment indicator based on the proportion of words that are classified as “positive”.  The sentiment reading for the archive for Jan-3, 2012, for example, turns out to be 67.4%:

fig6

Sentiment Index Analytics

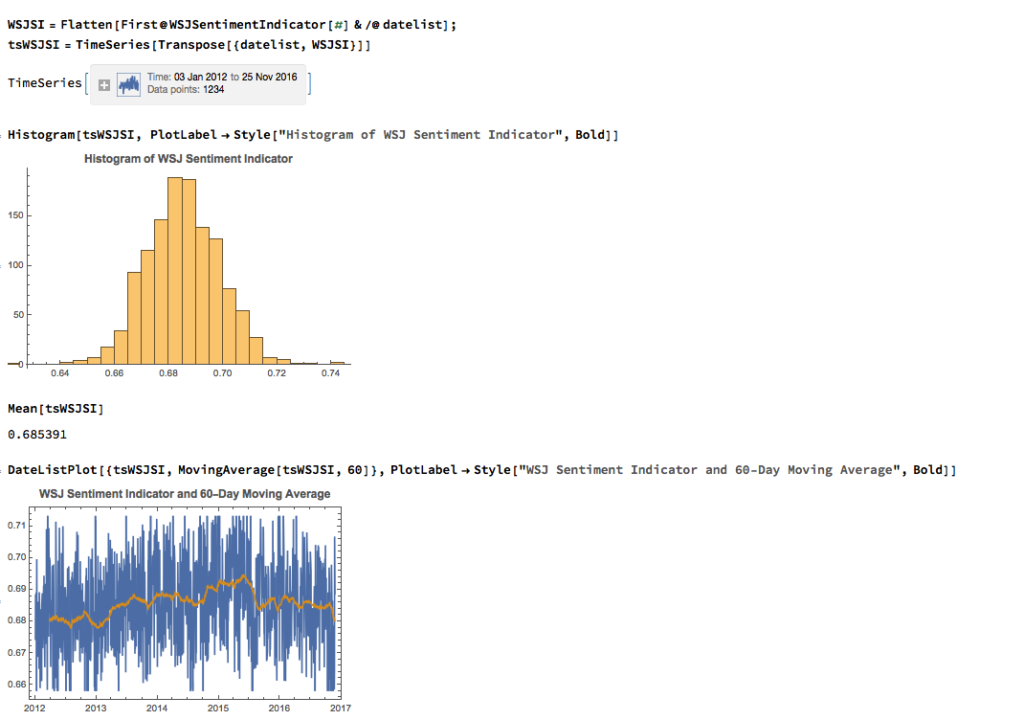
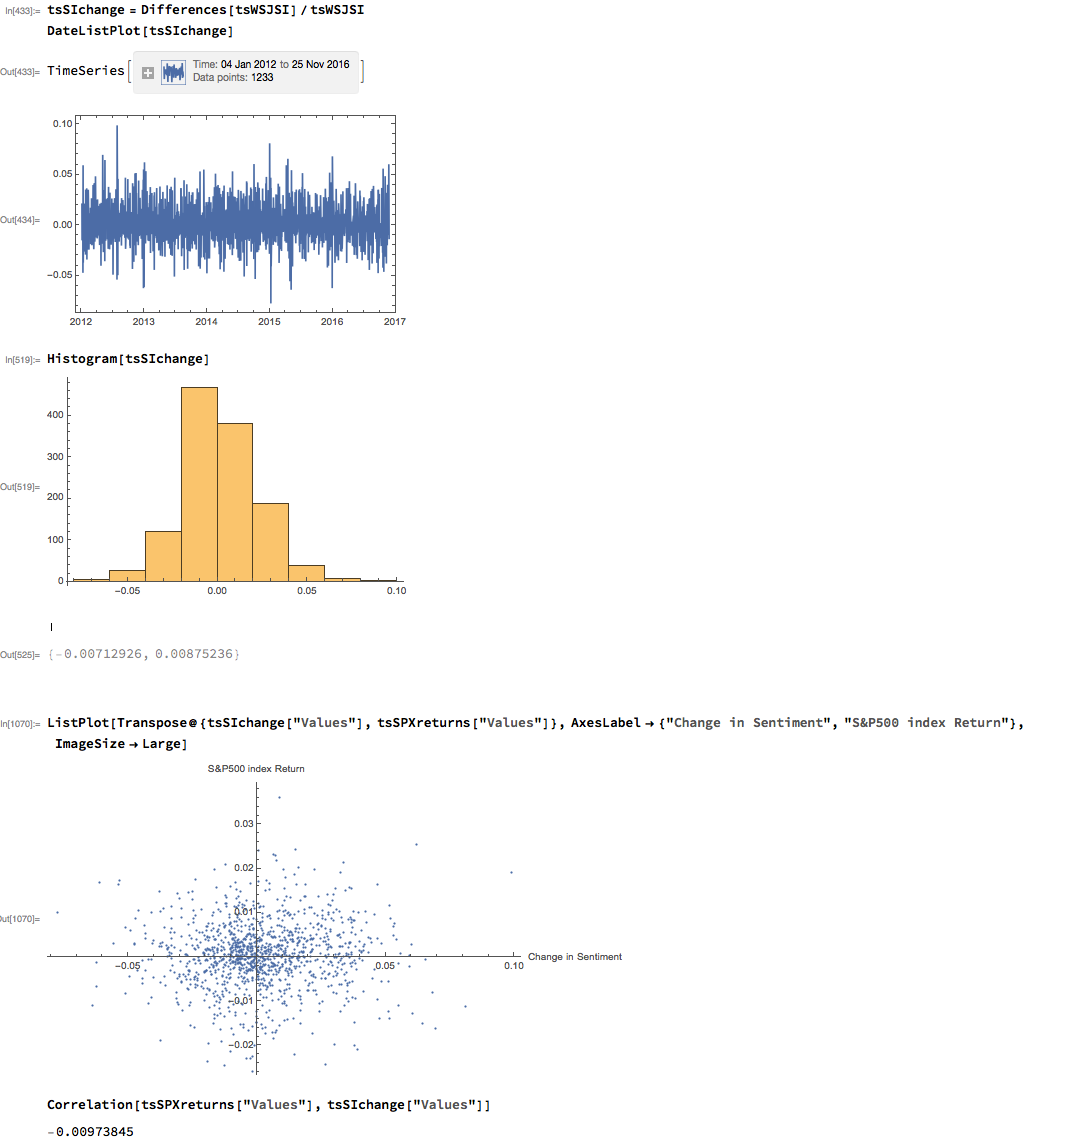
We can automate the process of classifying the entire WSJ archive with just a few lines of code, producing a time series for the daily sentiment indicator, which has an average daily value of  68.5%  – the WSJ crowd tends to be bullish, clearly!  Note how the 60-day moving average of the indicator rises steadily over the period from 2012 through Q1 2015, then abruptly reverses direction, declining steadily thereafter – even somewhat precipitously towards the end of 2016.

fig7


fig8

As with most data series in investment research, we are less interested in the level of a variable, such as a stock price, than we are in the changes in level.   So the next step is to calculate the daily percentage change in the sentiment indicator and examine the correlation with the corresponding intraday return in the S&P 500 Index.  At first glance our sentiment indicator appears to have very little predictive power  – the correlation between indicator changes and market returns is negligibly small overall – but we shall later see that this is not the last word.


fig9


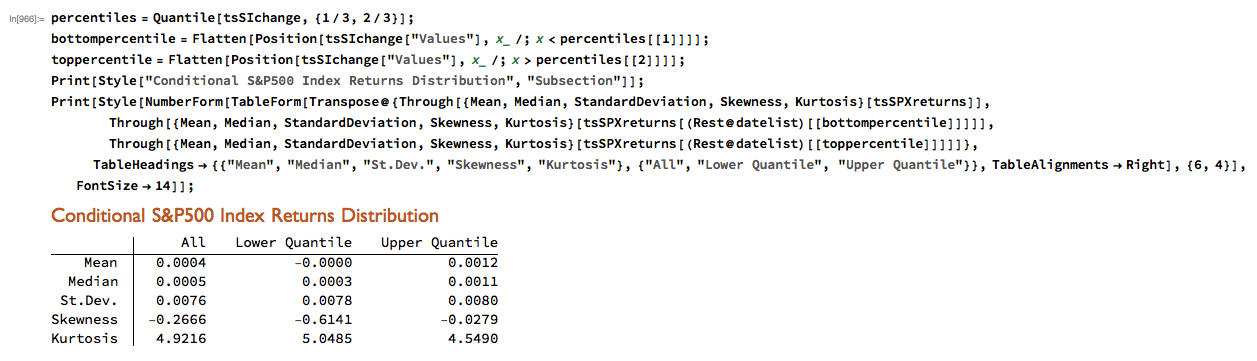
Conditional Distributions

Thus far the results appear discouraging; but as is often the case with this type of analysis we need to look more closely at the conditional distribution of returns.  Specifically, we will examine the conditional distribution of S&P 500 Index returns when changes in the sentiment index are in the upper and lower quantiles of the distribution. This will enable us to isolate the impact of changes in market sentiment at times when the swings in sentiment are strongest.  In the analysis below, we begin by examining the upper and lower third of the distribution of changes in sentiment:

fig10

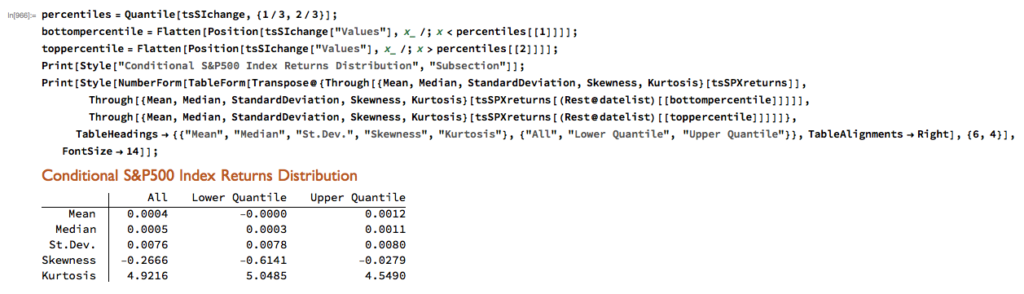
The analysis makes clear that the distribution of S&P 500 Index returns is very different on days when the change in market sentiment is large and positive vs. large and negative. The difference is not just limited to the first moment of the conditional distribution, where the difference in the mean return is large and statistically significant, but also in the third moment.  The much larger, negative skewness means that there is a greater likelihood of a large decline in the market on days in which there is a sizable drop in market sentiment, than on days in which sentiment significantly improves.  In other words, the influence of market sentiment changes is manifest chiefly through the mean and skewness of the conditional distributions of market returns.

A News Trading Algorithm

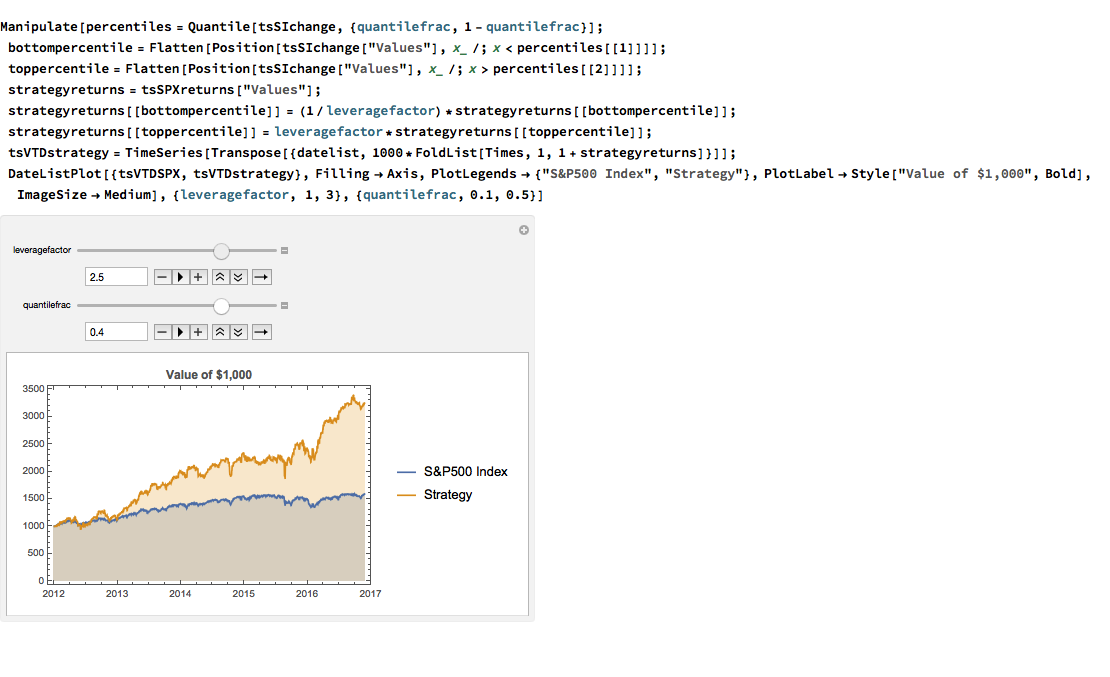
We can capitalize on these effects using a simple trading strategy in which we increase the capital allocated to a long-SPX position on days when market sentiment improves, while reducing exposure on days when market sentiment falls.  We increase the allocation by a factor – designated the leverage factor – on days when the change in the sentiment indicator is in the upper 1/3 of the distribution, while reducing the allocation by 1/leveragefactor on days when the change in the sentiment indicator falls in lower 1/3 of the distribution.  The allocation on other days is 100%.  The analysis runs as follows:

fig13 fig14

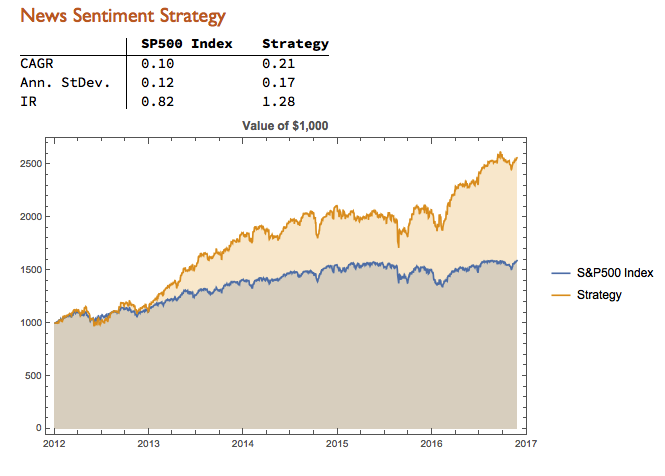
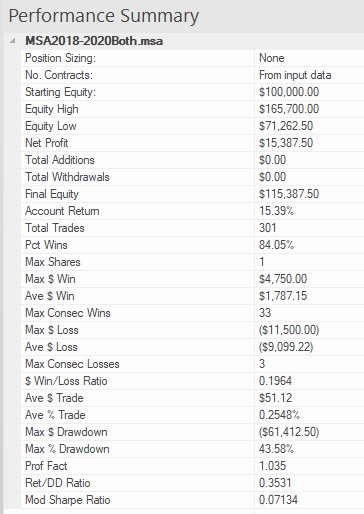
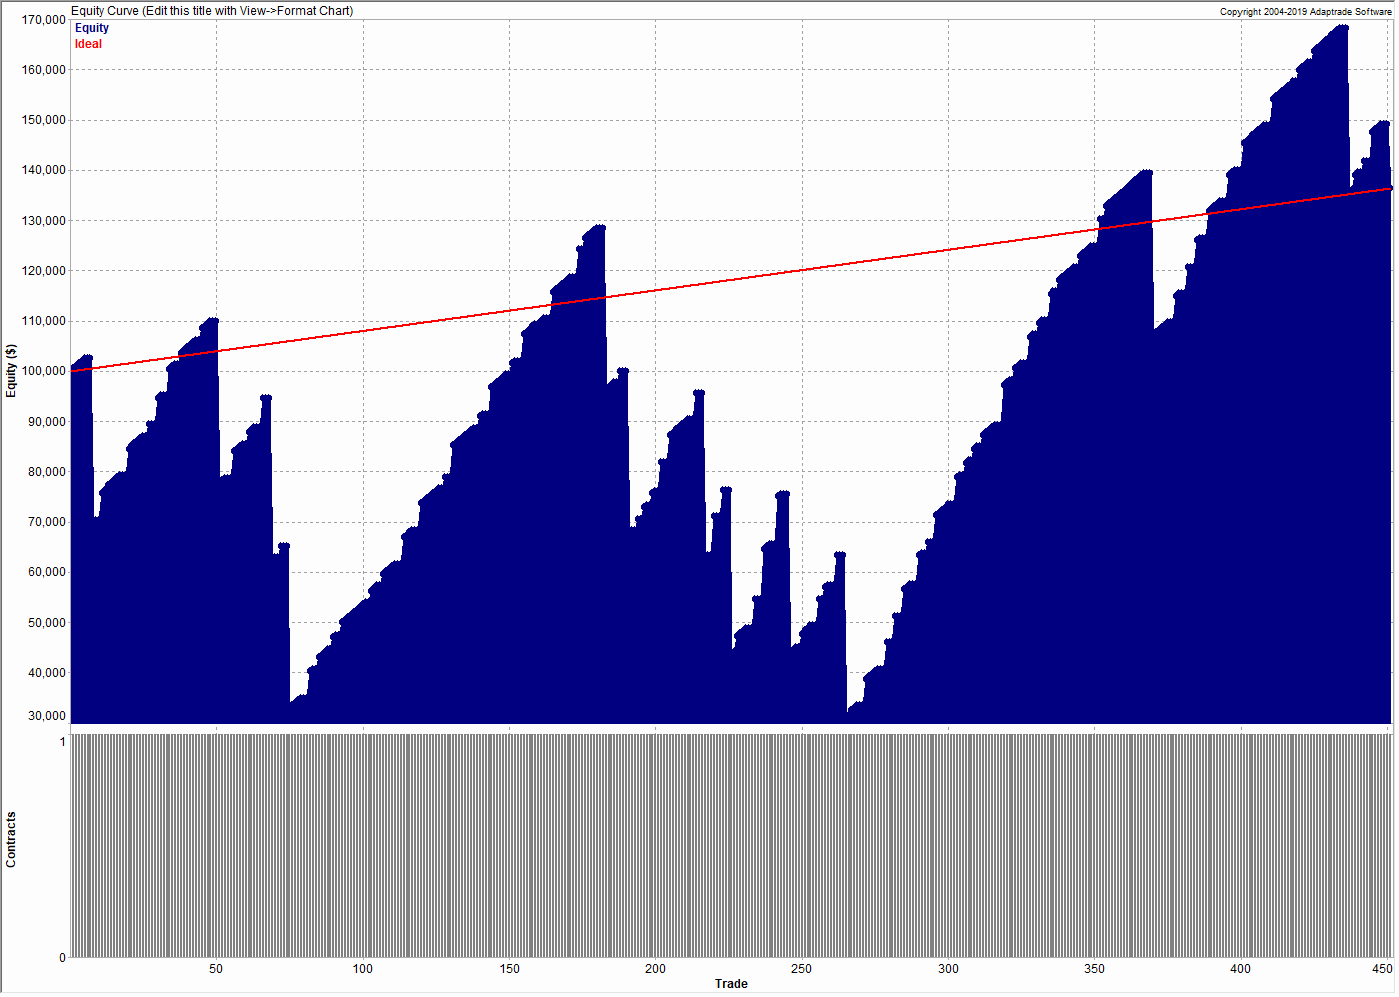
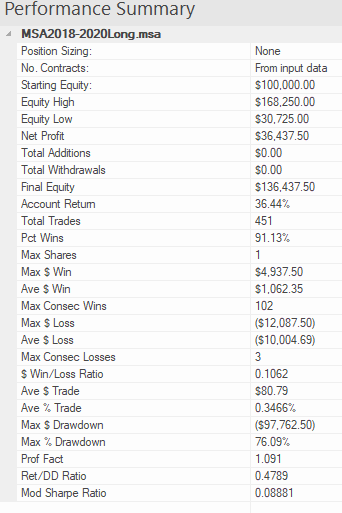
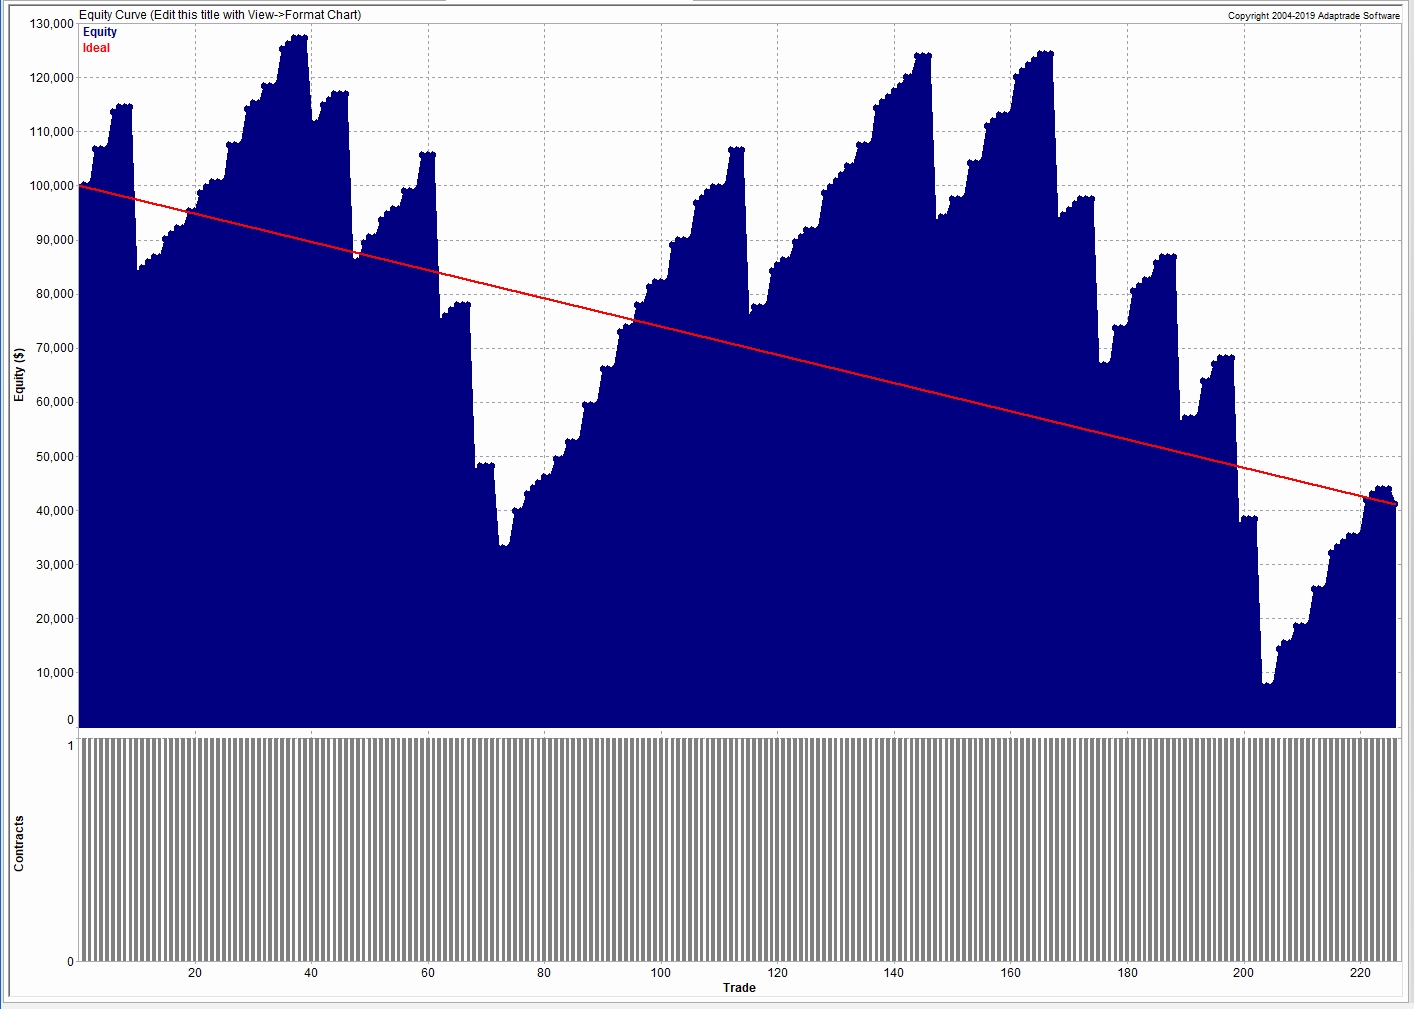
It turns out that, using a leverage factor of 2.0, we can increase the CAGR from 10% to 21% over the period from 2012-2016 using the conditional distribution approach.  This performance enhancement comes at a cost, since the annual volatility of the news sentiment strategy is 17% compared to only 12% for the long-only strategy. However, the overall net result is positive, since the risk-adjusted rate of return increases from 0.82 to 1.28.

We can explore the robustness of the result, comparing different quantile selections and leverage factors using Mathematica’s interactive Manipulate function:

fig12

Conclusion

We have seen that a simple market sentiment indicator can be created quite easily from publicly available news archives, using a standard machine learning sentiment classification algorithm.  A market sentiment algorithm constructed using methods as straightforward as this appears to provide the capability to differentiate the conditional distribution of market returns on days when changes in market sentiment are significantly positive or negative.  The differences in the higher moments of the conditional distribution appears to be as significant as the differences in the mean.  In principle, we can use the insight provided by the sentiment indicator to enhance a long-only day-trading strategy, increasing leverage and allocation on days when changes to market sentiment are positive and reducing them on days when sentiment declines.  The performance enhancements resulting from this approach appear to be significant.

Several caveats apply.  The S&P 500 index is not tradable, of course, and it is not uncommon to find trading strategies that produce interesting theoretical results.  In practice one would be obliged to implement the strategy using a tradable market proxy, such as a broad market ETF or futures contract.  The strategy described here, which enters and exits positions daily, would incur substantial trading costs, that would be further exacerbated by the use of leverage.

Of course there are many other uses one can make of news data, in particular with firm-specific news and sentiment analytics, that fall outside the scope of this article.  Hopefully, however, the methodology described here will provide a sign-post towards further, more practically useful research.


A High Frequency Scalping Strategy on Collective2

Scalping vs. Market Making

A market-making strategy is one in which the system continually quotes on the bid and offer and looks to make money from the bid-offer spread (and also, in the case of equities, rebates).  During a typical trading day, inventories will build up on the long or short side of the book as the market trades up and down.  There is no intent to take a market view as such, but most sophisticated market making strategies will use microstructure models to help decide whether to “lean” on the bid or offer at any given moment. Market makers may also shade their quotes to reduce the buildup of inventory, or even pull quotes altogether if they suspect that informed traders are trading against them (a situation referred to as “toxic flow”).  They can cover short positions through the repo desk and use derivatives to hedge out the risk of an accumulated inventory position.

marketmaking

A scalping strategy shares some of the characteristics of  a market making strategy:  it will typically be mean reverting, seeking to enter passively on the bid or offer and the average PL per trade is often in the region of a single tick.  But where a scalping strategy differs from market making is that it does take a view as to when to get long or short the market, although that view may change many times over the course of a trading session.  Consequently, a scalping strategy will only ever operate on one side of the market at a time, working the bid or offer; and it will typically never build inventory, since will it usually reverse and later try to sell for a profit the inventory it has previously purchased, hopefully at a lower price.

In terms of performance characteristics, a market making strategy will often have a double-digit Sharpe Ratio, which means that it may go for many days, weeks, or months, without taking a loss.  Scalping is inherently riskier, since it is taking directional bets, albeit over short time horizons.  With a Sharpe Ratio in the region of 3 to 5, a scalping strategy will often experience losing days and even losing months.

So why prefer scalping to market making?  It’s really a question of capability.  Competitive advantage in scalping derives from the successful exploitation of identified sources of alpha, whereas  market making depends primarily on speed and execution capability. Market making requires HFT infrastructure with latency measured in microseconds, the ability to layer orders up and down the book and manage order priority.  Scalping algos are generally much less demanding in terms of trading platform requirements: depending on the specifics of the system, they can be implemented successfully on many third party networks.

Developing HFT Futures Strategies

Some time ago my firm Systematic Strategies began research and development on a number of HFT strategies in futures markets.  Our primary focus has always been HFT equity strategies, so this was something of a departure for us, one that has entailed a significant technological obstacles (more on this in due course). Amongst the strategies we developed were several very profitable scalping algorithms in fixed income futures.  The majority trade at high frequency, with short holding periods measured in seconds or minutes, trading tens or even hundreds of times a day.

xtraderThe next challenge we faced was what to do with our research product.  As a proprietary trading firm our first instinct was to trade the strategies ourselves; but the original intent had been to develop strategies that could provide the basis of a hedge fund or CTA offering.  Many HFT strategies are unsuitable for that purpose, since the technical requirements exceed the capabilities of the great majority of standard trading platforms typically used by managed account investors. Besides, HFT strategies typically offer too limited capacity to be interesting to larger, institutional investors.

In the end we arrived at a compromise solution, keeping the highest frequency strategies in-house, while offering the lower frequency strategies to outside investors. This enabled us to keep the limited capacity of the highest frequency strategies for our own trading, while offering investors significant capacity in strategies that trade at lower frequencies, but still with very high performance characteristics.

HFT Bond Scalping

A typical example is the following scalping strategy in US Bond Futures.  The strategy combines two of the lower frequency algorithms we developed for bond futures that scalp around 10 times per session.  The strategy attempts to take around 8 ticks out of the market on each trade and averages around 1 tick per trade.   With a Sharpe Ratio of over 3, the strategy has produced net profits of approximately $50,000 per contract per year, since 2008.    A pleasing characteristic of this and other scalping strategies is their consistency:  There have been only 10 losing months since January 2008, the last being a loss of $7,100 in Dec 2015 (the prior loss being $472 in July 2013!)

Annual P&L

Fig2

Strategy Performance

fig4Fig3


Offering The Strategy to Investors on Collective2

The next challenge for us to solve was how best to introduce the program to potential investors.  Systematic Strategies is not a CTA and our investors are typically interested in equity strategies.  It takes a great deal of hard work to persuade investors that we are able to transfer our expertise in equity markets to the very different world of futures trading. While those efforts are continuing with my colleagues in Chicago, I decided to conduct an experiment:  what if we were to offer a scalping strategy through an online service like Collective2?  For those who are unfamiliar, Collective2 is an automated trading-system platform that allowed the tracking, verification, and auto-trading of multiple systems.  The platform keeps track of the system profit and loss, margin requirements, and performance statistics.  It then allows investors to follow the system in live trading, entering the system’s trading signals either manually or automatically.

Offering a scalping strategy on a platform like this certainly creates visibility (and a credible track record) with investors; but it also poses new challenges.  For example, the platform assumes trading cost of around $14 per round turn, which is at least 2x more expensive than most retail platforms and perhaps 3x-5x more expensive than the cost a HFT firm might pay.  For most scalping strategies that are designed to take a tick out of the market such high fees would eviscerate the returns.  This motivated our choice of US Bond Futures, since the tick size and average trade are sufficiently large to overcome even this level of trading friction.  After a couple of false starts, during which we played around with the algorithms and boosted strategy profitability with a couple of low frequency trades, the system is now happily humming along and demonstrating the kind of performance it should (see below).

For those who are interested in following the strategy’s performance, the link on collective2 is here.


Collective2Perf

trades

Disclaimer

About the results you see on this Web site

Past results are not necessarily indicative of future results.

These results are based on simulated or hypothetical performance results that have certain inherent limitations. Unlike the results shown in an actual performance record, these results do not represent actual trading. Also, because these trades have not actually been executed, these results may have under-or over-compensated for the impact, if any, of certain market factors, such as lack of liquidity. Simulated or hypothetical trading programs in general are also subject to the fact that they are designed with the benefit of hindsight. No representation is being made that any account will or is likely to achieve profits or losses similar to these being shown.

In addition, hypothetical trading does not involve financial risk, and no hypothetical trading record can completely account for the impact of financial risk in actual trading. For example, the ability to withstand losses or to adhere to a particular trading program in spite of trading losses are material points which can also adversely affect actual trading results. There are numerous other factors related to the markets in general or to the implementation of any specific trading program, which cannot be fully accounted for in the preparation of hypothetical performance results and all of which can adversely affect actual trading results.

Material assumptions and methods used when calculating results

The following are material assumptions used when calculating any hypothetical monthly results that appear on our web site.

  • Profits are reinvested. We assume profits (when there are profits) are reinvested in the trading strategy.
  • Starting investment size. For any trading strategy on our site, hypothetical results are based on the assumption that you invested the starting amount shown on the strategy’s performance chart. In some cases, nominal dollar amounts on the equity chart have been re-scaled downward to make current go-forward trading sizes more manageable. In these cases, it may not have been possible to trade the strategy historically at the equity levels shown on the chart, and a higher minimum capital was required in the past.
  • All fees are included. When calculating cumulative returns, we try to estimate and include all the fees a typical trader incurs when AutoTrading using AutoTrade technology. This includes the subscription cost of the strategy, plus any per-trade AutoTrade fees, plus estimated broker commissions if any.
  • “Max Drawdown” Calculation Method. We calculate the Max Drawdown statistic as follows. Our computer software looks at the equity chart of the system in question and finds the largest percentage amount that the equity chart ever declines from a local “peak” to a subsequent point in time (thus this is formally called “Maximum Peak to Valley Drawdown.”) While this is useful information when evaluating trading systems, you should keep in mind that past performance does not guarantee future results. Therefore, future drawdowns may be larger than the historical maximum drawdowns you see here.

Trading is risky

There is a substantial risk of loss in futures and forex trading. Online trading of stocks and options is extremely risky. Assume you will lose money. Don’t trade with money you cannot afford to lose.

Algorithmic Trading

MOVING FROM RESEARCH TO TRADING

I have written recently about the comparative advantages of different programming languages in the context of research and trading (see here).  My sense of it is that there is no single “ideal” programming language – the best strategy is to pick an appropriate tool for the job and there are usually several reasonable choices one could make.

If you are engaged in econometrics research, you might choose a package like RATS, Eviews, Gauss, or Prof. James Davidson’s excellent and inexpensive TSM, which I have used for many years and can recommend highly. For a latency-sensitive high frequency trading application, you will probably want to use something like C++, or possibly a 3rd party algo system like Apama or Tethys. But for algorithmic trading systems of intermediate frequency the choice appears almost unlimited.

Matlab AlgoThe problem with retail trading tools like TradeStation, Multicharts, or Amibroker, is that they are designed primarily for single-asset strategies.  That may be ok for futures trading,where more often than not the focus is on a single underlying, but in equities the opposite is true. Using one of these products to develop and implement a pairs trading strategy is a stretch.   As for portfolio analytics – forget it.

This is where more general, high level languages like R, Matlab or Mathematica come in:  their greater power and flexibility is handling large, multivariate data sets makes it much more straightforward to develop portfolio strategies. And they can often bridge the gap between R&D and implementation quite easily:  code that was used in the research stage can often be quickly re-tooled to work in a production version of the system.  As for production systems, there is now a significant cottage industry of traders who use Matlab in algo trading.  R has a similar following (see here).

In addition to parallelizing the code (for use with the Parallel Computing Toolbox) to speed up the research phase, you might also want to implement a hybrid system by re-coding the slower routines in C++, to create a mex file (for details see here). Matlab’s Profiler is a useful tool for identifying code bottlenecks.  In a recent piece of research in which I was evaluating over 30,000,000 cointegrated portfolios, I discovered to my surprise that the main code bottleneck was the multiple calls to Matlab’s std function, a problem easily fixed with a few lines of C++ code.  The resulting hybrid program executed at more than twice the speed – important when your run time might be several hours, or even days.

HOOKING UP THE EXECUTION PLATFORM

The main challenge for developers using generic tools like Mathematica, Matlab or R is the implementation stage of the project. Providing connectivity to brokerage/execution platforms never seemed high on the list of priorities for Wolfram or Mathworks and things are similarly hit or miss with R.

Belatedly, Mathematica now offers a link to Bloomberg via its Finance Platform.  Matlab, meanwhile, offers a Trading Toolbox, which supposedly offers connectivity , not only to Bloomberg, but also Interactive Brokers and Trading Technologies, amongst other platforms.  Unfortunately, the toolbox interface to IB appears to rely on outdated 1990s ActiveX technology, which is flakey at best.  In tests, I was unable to make progress past the ‘not connected’ error message.

At that point I turned to Yair Altman’s  IB-Matlab product.  Happily, this uses IB’s Java api, which is a great deal more robust than the ActiveX platform.  It’s been some time since I last used IB-Matlab and was pleased to see that Yair has been very busy over the intervening period, building the capabilities of the system and providing very comprehensive documentation for it.  With Yair’s help, it took me no time at all to get up and running and within a day or two the system was executing orders flawlessly in IB’s TWS.  The relatively few snags I ran into were almost all due to IB’s extremely terse error messaging, which often gives almost no clue as to what the issue might be.  Fortunately, Yair is very generous with his time in providing support to his users and his responses to me questions were fast and detailed.

EXECUTION ALGOS

With intermediate  systems trading at frequencies of, say, 5-minutes to daily, one has a choice to make as regards execution.  Given that the strategy is not very latency sensitive, it is certainly conceivable to develop one’s own execution algos in Matlab.  However, platforms like TWS are equipped with native algos, not only from IB, but also other providers like Credit Suisse and JefAD Algofries.

Actually, I have found several of IB’s own algos such as Scaletrader and Accumulate/Distribute to be very effective. Certainly IB seems very proud of them – IB CEO Thomas Peterffy has patented at least one of them. Accumulate/Distribute, for instance, is quite sophisticated, allowing the user to randomize and slice the size and interval between individual orders, use passive or aggressive order types, and pause execution on a news alert, or when the price falls below a moving average, or outside a specified range.

There is much to be said for using algos native to the execution platform rather than reinventing the wheel, providing the cost is reasonable. So, while it is perfectly feasible to build execution algos in Matlab, it typically isn’t necessary – in most cases standard algos will suffice.

There are exceptions, of course.  IB doesn’t offer the  kind of basket-trading capabilities REDIthat are available in advanced algo platforms like Tethys or RediPlus.  In those systems, for example, you can set the level of long/short imbalance in the portfolio that you are willing to tolerate and the algo will speed up or slow down execution of trades in individual components of the basket to maintain the dollar imbalance within that tolerance.  You can also manage the sector risk dynamically during execution.

Those kind of advanced capabilities don’t come cheap and you wont find them at IB, or any other retail platform. If you need that kind of functionality, for example, because you are trading a long/short equity portfolio within a universe of 200-300 names, your best option is probably to switch to a different execution platform.  Otherwise you will need to code a custom algo in your language of choice.

For many quantitative strategies, (at least the low frequency ones) IB’s standard algos are often good enough.  The Accumulate/Distribute algo, for instance, will show a visual representation of the progress of the execution of individuals legs of a pairs trade, and it is easy enough to identify a potential imbalance and adjust the algo parameters in real time. If you are only trading pairs, or small portfolios of cointegrated securities, it probably isn’t worthwhile to develop the sophisticated logic that would be required to handle the adjustment of the execution of individual legs of a trade in a fully automated way.  A large portfolio would be a different matter, however.

MATLAB EXAMPLE

I thought it might be instructive to take a look at how you might implement the execution of a strategy in Matlab, using IB algos. In the Matlab code fragment below, the (2 x nTickers) array tradeActions contains, in the first row, the action we wish to take (1 = BUY, -1 = SELL, -2 = SELL SHORT) and in the second row the (absolute value of) the number of shares we wish to trade for tickers i =1:nTickers. We break each order up into hundred lots and odd lots, routing the former via IB’s Accumulate/Distribute algo and the latter as passive REL orders (note that A/D  will typically randomize the timing of each sub-order, while REL orders are posted directly into the market). The Matlab function AccumulateDistribute implements the most important features of IB’s A/D algo, including random size and time slicing of the order.  Orders are submitted as passive REL orders with zero offset (so they will sit on the current bid or ask) – obviously you would typically want to consider allowing some non-zero offset for less liquid securities.  It is not hard to envisage how one might further enhance the algo to monitor the progress of the execution and speed up or slow down certain orders accordingly.

MatlabA couple of IB api “gotchas” to be aware of:

(i) IB requires unique and monotonically increasing orderIds for each order. One way to do this, suggested by Yair, is to use orderId = round((now-735000)*3e5);  This fails when you are submitting a number of orders sequentially at high speed (say in a for loop), where the time increments are sub-second, so you need to pass the orderID back and force a minimal increment, as I have in the code below.

(ii) It is very important to specify the primary exchange of each security:  securities with identical tickers can be found trading on different exchanges.  Failing to specify the primary exchange in such a case will result in IB rejecting the order with a typically cryptic api message.

Continue reading “Algorithmic Trading”