The Information Content of the Pre- and Post-Market Trading Sessions

I apologize in advance for this rather “wonkish” post, which is aimed chiefly at the high frequency fraternity, or those at least who trade intra-day, in the equity markets.  Such minutiae are the lot of those engaged in high frequency trading.  I promise that my next post will be of more general interest.

Pre- and Post Market Sessions

The pre-market session in US equities runs from 8:00 AM ET, while the post-market session runs until 8:00 PM ET.  The question arises whether these sessions are worth trading, or at the very least, offer a source of data (quotes, trades) that might be relevant to trading the regular session, which of course runs from 9:30 AM to 4:00 PM ET.  Even if liquidity is thin and trades infrequent, and opportunities in the pre- and post-market very limited, it might be that we can improve our trading models by taking into account such information as these sessions do provide, even if we only ever plan to trade during regular trading hours.

It is somewhat challenging to discuss this in great detail, because HFT equity trading is very much in the core competencies of my firm, Systematic Strategies.  However, I hope to offer some ideas, at least, that some readers may find useful.

SSALGOTRADING AD


A Tale of Two Pharmaceutical Stocks

In what follows I am going to make use of two examples from the pharmaceutical industry: Alexion Pharmaceuticals, Inc. (ALXN), which has a market cap of $35Bn and trades around 800,000 shares daily, and Pfizer Inc. (PFE), which has a market cap of over $200Bn and trades close to 50M shares a day.

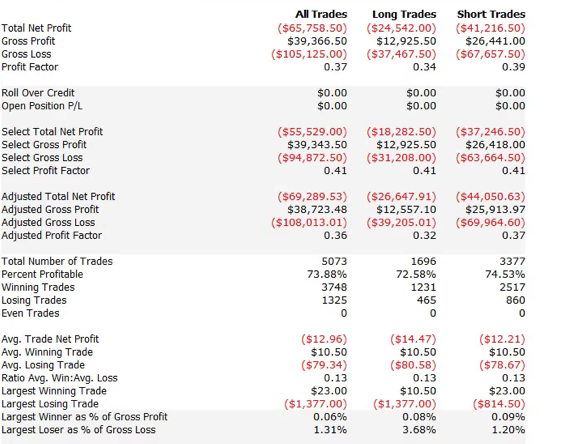
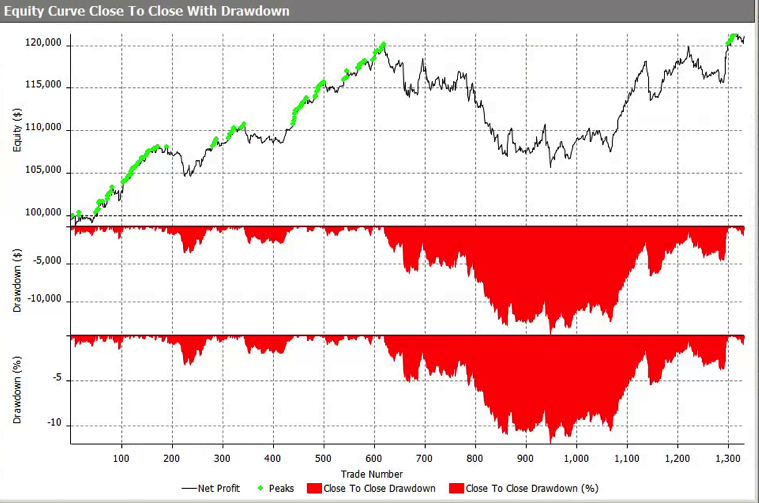
Let’s start by looking at a system trading ALXN during regular market hours.  The system isn’t high frequency, but trades around 1-2 times a day, on average.  The strategy equity curve from 2015 to April 2016 is not at all impressive.


ALXN Regular

ALXN – Regular Session Only


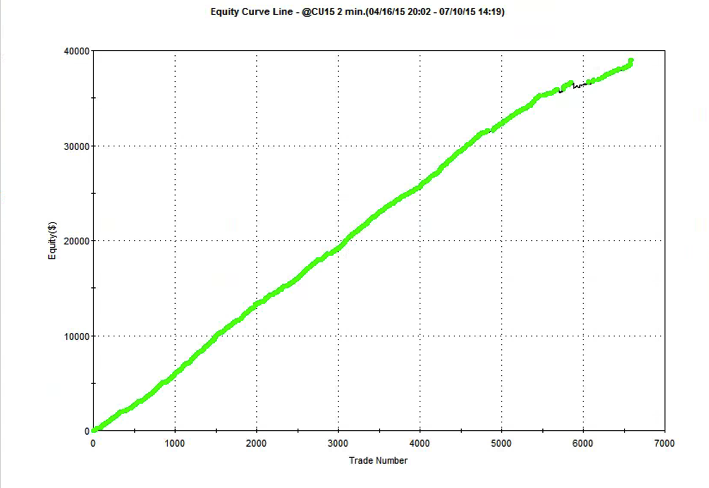
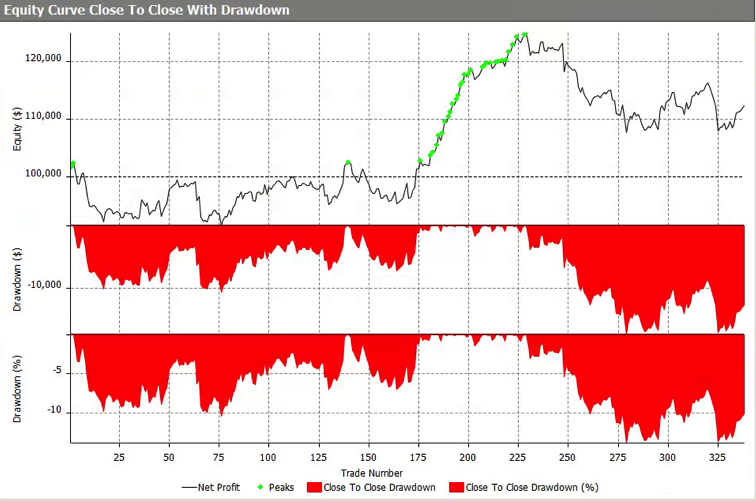
But look at the equity curve for the same strategy when we allow it to run on the pre- and post-market sessions, in addition to regular trading hours.  Clearly the change in the trading hours utilized by the strategy has made a huge improvement in the total gain and risk-adjusted returns.


ALEXN with pre-market

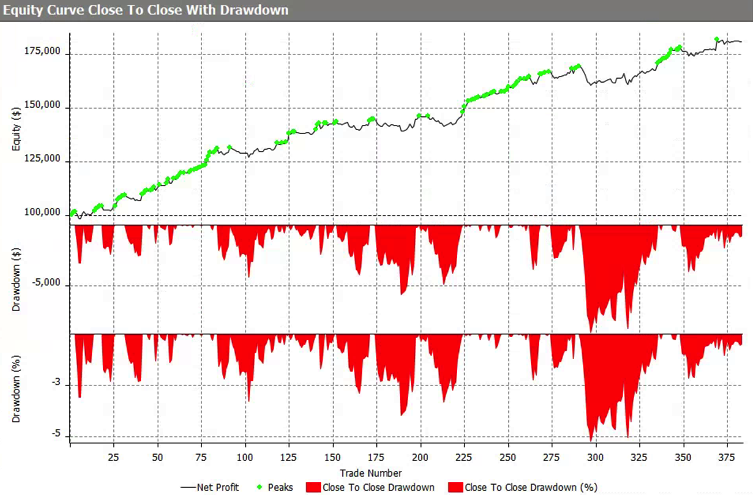
ALXN – with Pre- and Post-Market Sessions


The PFE system trades much more frequently, around 4 times a day, but the story is somewhat similar in terms of how including the pre- and post-market sessions appears to improve its performance.

PFE Regular

PFE – Regular Session Only

PFE with premarket

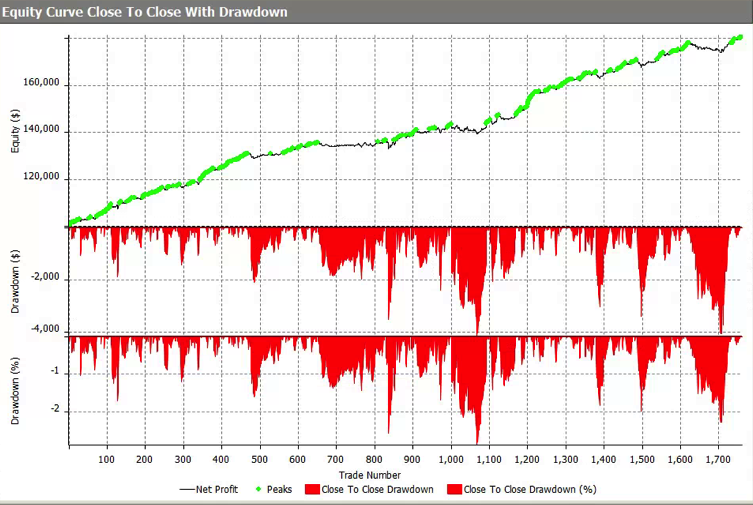
PFE – with Pre- and Post-Market Sessions


Improving Trading Performance

In both cases, clearly, the trading performance of the strategies has improved significantly with the inclusion of the out-of-hours sessions.  In the case of ALXN, we see a modest increase of around 10% in the total number of trades, but in the case of PFE the increase in trading activity is much more marked – around 30%, or more.

The first important question to ask is when these additional trades are occurring.  Assuming that most of them take place during the pre- or post-market, our concern might be whether there is likely to be sufficient liquidity to facilitate trades of the frequency and size we wish to execute.  Of various possible hypotheses, some negative, other positive, we might consider the following:

(a) Bad ticks in the market data feed during out-of-hours sessions give rise to apparently highly profitable “phantom” trades

(b) The market data is valid, but the trades are done in such low volume as to be insignificant for practical purposes (i.e. trades were done for a few hundred lots and additional liquidity is unlikely to be available)

(c) Out-of-hours sessions enable the system to improve profitability by entering or exiting positions in a more timely manner than by trading the regular session alone

(d) Out-of-hours market data improves the accuracy of model forecasts, facilitating a larger number of trades, and/or more profitable trades, during regular market hours

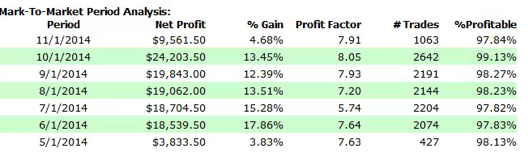
An analysis of the trading activity for the two systems provides important insight as to which of the possible explanations might be correct.
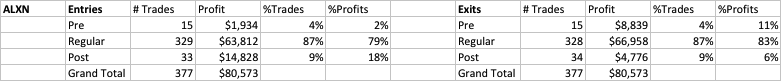

ALXN Analysis

(click to enlarge)

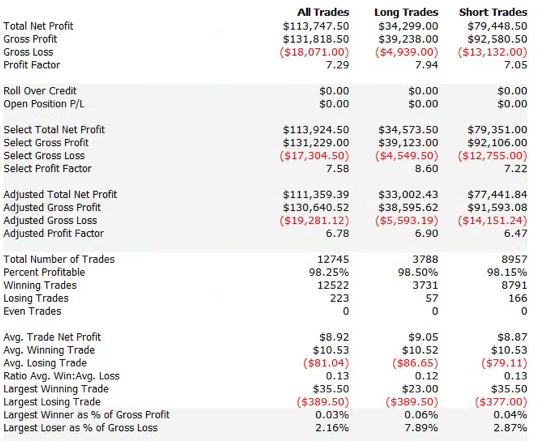
Dealing first with ALXN, we that, indeed, an additional 11% of trades are entered or exited out-of-hours.  However, these additional trades account for somewhere between 17% (on exit) and 20% (on entry) of the total profits.  Furthermore, the size of the average entry trade during the post-market session and of the average exit trade in the pre-market session is more than double that of the average trade entered or exited during regular market hours. That gives concerns that some of the apparent increase in profits may be due to bad ticks at prices away from the market, allowing the system enter or exit trades at unrealistically low or high prices.  Even if many of the trades are good, we will have concerns about the scalability of the strategy in out-of-hours trading, given the relatively poor liquidity in the stock. On the other hand, at least some of the uplift in profits arises from new trades occurring during the regular session. This suggests that, even if we are unable to execute many of the trading opportunities seen during pre- or post-market, the trades from those sessions provides useful additional data points for our model, enabling it to increase the number and/or profitability of trades in the regular session.

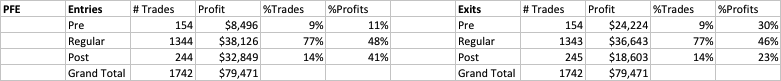
Next we turn to PFE.  We can see straight away that, while the proportion of trades occurring during out-of-hours sessions is around 23%, those trades now account for over 50% of the total profits.  Furthermore, the average PL for trades executed on entry post-market, and on exit pre-market, is more than 4x the average for trades entered or exited during normal market hours.  Despite the much better liquidity in PFE compared to ALXN, this is a huge concern – we might expect to see significant discrepancies occurring between theoretical and actual performance of the strategy, due to the very high dependency on out-of-hours trading.

PFE Analysis

(click to enlarge)

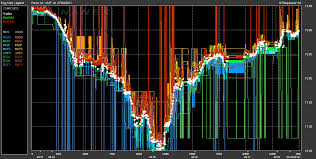
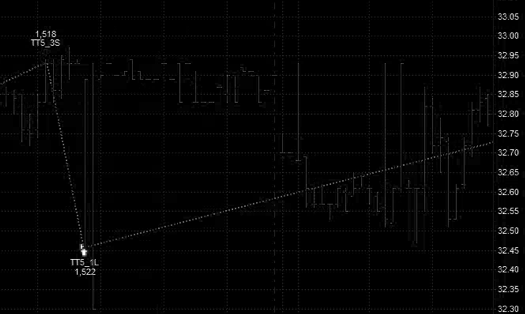
As we dig further into the analysis, we do indeed find evidence that bad data ticks play a disproportionate role.  For example, this trade in PFE which apparently occurred at around 16:10 on 4/6 was almost certainly a phantom trade resulting from a bad data point. It turns out that, for whatever reason, such bad ticks are a common occurrence in the stock and account for a large proportion of the apparent profitability of out-of-hours trading in PFE.


PFE trade


CONCLUSION

We are, of course, only skimming the surface of the analysis that is typically carried out.  One would want to dig more deeply into ways in which the market data feed could be cleaned up and bad data ticks filtered out so as to generate fewer phantom trades.  One would also want to look at liquidity across the various venues where the stocks trade, including dark pools, in order to appraise the scalability of the strategies.

For now, the main message that I am seeking to communicate is that it is often well worthwhile considering trading in the pre- and post-market sessions, not only with a view to generating additional, profitable trading opportunities, but also to gather additional data points that can enhance trading profitability during regular market hours.

Making Money with High Frequency Trading

There is no standard definition of high frequency trading, nor a single type of strategy associated with it. Some strategies generate returns, not by taking any kind of view on market direction, but simply by earning Exchange rebates. In other cases the strategy might try to trade ahead of the news as it flows through the market, from stock to stock (or market to market).  Perhaps the most common and successful approach to HFT is market making, where one tries to earn (some fraction of) the spread by constantly quoting both sides of the market.  In the latter approach, which involves processing vast numbers of order messages and other market data in order to decide whether to quote (or pull a quote), latency is of utmost importance.  I would tend to argue that HFT market making owes its success as much, or more, to computer science than it does to trading or microstructure theory.

By contrast, Systematic Strategies’s approach to HFT has always been model-driven.  We are unable to outgun firms like Citadel or Getco in terms of their speed of execution; so, instead, we focus on developing theoretical models of market behavior, on the assumption that we are more likely to identify a source of true competitive advantage that way.  This leads to slower, less latency-sensitive strategies (the models have to be re-estimated or recomputed in real time), but which may nonetheless trade hundreds of times a day.

A good example is provided by our high frequency scalping strategy in Corn futures, which trades around 100-200 times a day, with a win rate of over 80%.

Corn Monthly PNL EC


One of the most important considerations in engineering a HFT strategy of this kind is to identify a suitable bar frequency.  We find that our approach works best using data at frequencies of 1-5 minutes, trading at latencies of around 1 millisec, whereas other firms are reacting to data tick-by-tick, with latencies measured in microseconds.

Often strategies are built using only data derived from with a single market, based on indicators involving price action, pattern trading rules, volume or volatility signals.  In other cases, however, signals are derived from other, related markets: the VXX-ES-TY complex would be a typical example of this kind of inter-market approach.

SSALGOTRADING AD

When we build strategies we often start by using a simple retail platform like TradeStation or MultiCharts.  We know that if the strategy can make money on a platform with retail levels of order and market data latency (and commission rates), then it should perform well when we transfer it to a production environment, with much lower latencies and costs.  We might be able to trade only 1-2 contracts in TradeStation, but in production we might aim to scale that up to 10-15 contract per trade, or more, depending on liquidity.  For that reason we prefer to trade only intraday, when market liquidity is deepest; but we often find sufficient levels of liquidity to make trading worthwhile 1-2 hours before the open of the day session.

Generally, while we look for outside money for our lower frequency hedge fund strategies, we tend not to do so for our HFT strategies.  After all, what’s the point?  Each strategy has limited capacity and typically requires no more than a $100,000 account, at most.  And besides, with Sharpe Ratios that are typically in double-digits, it’s usually in our economic interest to use all of the capacity ourselves.  Nor do we tend to license strategies to other trading firms.  Again, why would we?  If the strategies work, we can earn far more from trading rather than licensing them.

We have, occasionally, developed strategies for other firms for markets in which we have no interest (the KOSPI springs to mind).  But these cases tend to be the exception, rather than the rule.

High Frequency Trading with ADL – JonathanKinlay.com

Trading Technologies’ ADL is a visual programming language designed specifically for trading strategy development that is integrated in the company’s flagship XTrader product. ADL Extract2 Despite the radically different programming philosophy, my experience of working with ADL has been delightfully easy and strategies that would typically take many months of coding in C++ have been up and running in a matter of days or weeks.  An extract of one such strategy, a high frequency scalping trade in the E-Mini S&P 500 futures, is shown in the graphic above.  The interface and visual language is so intuitive to a trading system developer that even someone who has never seen ADL before can quickly grasp at least some of what it happening in the code.

Strategy Development in Low vs. High-Level Languages
What are the benefits of using a high level language like ADL compared to programming languages like C++/C# or Java that are traditionally used for trading system development?  The chief advantage is speed of development:  I would say that ADL offers the potential up the development process by at least one order of magnitude.  A complex trading system would otherwise take months or even years to code and test in C++ or Java, can be implemented successfully and put into production in a matter of weeks in ADL. In this regard, the advantage of speed of development is one shared by many high level languages, including, for example, Matlab, R and Mathematica.  But in ADL’s case the advantage in terms of time to implementation is aided by the fact that, unlike generalist tools such as MatLab, etc, ADL is designed specifically for trading system development.  The ADL development environment comes equipped with compiled pre-built blocks designed to accomplish many of the common tasks associated with any trading system such as acquiring market data and handling orders.  Even complex spread trades can be developed extremely quickly due to the very comprehensive library of pre-built blocks.

SSALGOTRADING AD

Integrating Research and Development
One of the drawbacks of using a higher  level language for building trading systems is that, being interpreted rather than compiled, they are simply too slow – one or more orders of magnitude, typically – to be suitable for high frequency trading.  I will come on to discuss the execution speed issue a little later.  For now, let me bring up a second major advantage of ADL relative to other high level languages, as I see it.  One of the issues that plagues trading system development is the difficulty of communication between researchers, who understand financial markets well, but systems architecture and design rather less so, and developers, whose skill set lies in design and programming, but whose knowledge of markets can often be sketchy.  These difficulties are heightened where researchers might be using a high level language and relying on developers to re-code their prototype system  to get it into production.  Developers  typically (and understandably) demand a high degree of specificity about the requirement and if it’s not included in the spec it won’t be in the final deliverable.  Unfortunately, developing a successful trading system is a highly non-linear process and a researcher will typically have to iterate around the core idea repeatedly until they find a combination of alpha signal and entry/exit logic that works.  In other words, researchers need flexibility, whereas developers require specificity. ADL helps address this issue by providing a development environment that is at once highly flexible and at the same time powerful enough to meet the demands of high frequency trading in a production environment.  It means that, in theory, researchers and developers can speak a common language and use a common tool throughout the R&D development cycle.  This is likely to reduce the kind of misunderstanding between researchers and developers that commonly arise (often setting back the implementation schedule significantly when they do).

Latency
Of course,  at least some of the theoretical benefit of using ADL depends on execution speed.  The way the problem is typically addressed with systems developed in high level languages like Matlab or R is to recode the entire system in something like C++, or to recode some of the most critical elements and plug those back into the main Matlab program as dlls.  The latter approach works, and preserves the most important benefits of working in both high and low level languages, but the resulting system is likely to be sub-optimal and can be difficult to maintain. The approach taken by Trading Technologies with ADL is very different.  Firstly,  the component blocks are written in  C# and in compiled form should run about as fast as native code.  Secondly, systems written in ADL can be deployed immediately on a co-located algo server that is plugged directly into the exchange, thereby reducing latency to an acceptable level.  While this is unlikely to sufficient for an ultra-high frequency system operating on the sub-millisecond level, it will probably suffice for high frequency systems that operate at speeds above above a few millisecs, trading up to say, around 100 times a day.

Fill Rate and Toxic Flow
For those not familiar with the HFT territory, let me provide an example of why the issues of execution speed and latency are so important.  Below is a simulated performance record for a HFT system in ES futures.  The system is designed to enter and exit using limit orders and trades around 120 times a day, with over 98% profitability, if we assume a 100% fill rate. Monthly PNL 1 Perf Summary 1  So far so good.  But  a 100% fill rate  is clearly unrealistic.  Let’s look at a pessimistic scenario: what if we  got filled on orders only when the limit price was exceeded?  (For those familiar with the jargon, we are assuming a high level of flow toxicity)  The outcome is rather different: Perf Summary 2 Neither scenario is particularly realistic, but the outcome is much more likely to be closer to the second scenario rather than the first if we our execution speed is slow, or if we are using a retail platform such as Interactive Brokers or Tradestation, with long latency wait times.  The reason is simple: our orders will always arrive late and join the limit order book at the back of the queue.  In most cases the orders ahead of ours will exhaust demand at the specified limit price and the market will trade away without filling our order.  At other times the market will fill our order whenever there is a large flow against us (i.e. a surge of sell orders into our limit buy), i.e. when there is significant toxic flow. The proposition is that, using ADL and the its high-speed trading infrastructure, we can hope to avoid the latter outcome.  While we will never come close to achieving a 100% fill rate, we may come close enough to offset the inevitable losses from toxic flow and produce a decent return.  Whether ADL is capable of fulfilling that potential remains to be seen.

More on ADL
For more information on ADL go here.