More on Strategy Robustness

Commentators have made the point that a high % win rate is not enough.

Yes, you obviously want to pay attention to other performance metrics also, such as profit factor. In fact, there is no reason why you shouldn’t consider an objective function that explicitly combines various desirable performance measures, for example:

net profit * % win rate * profit factor

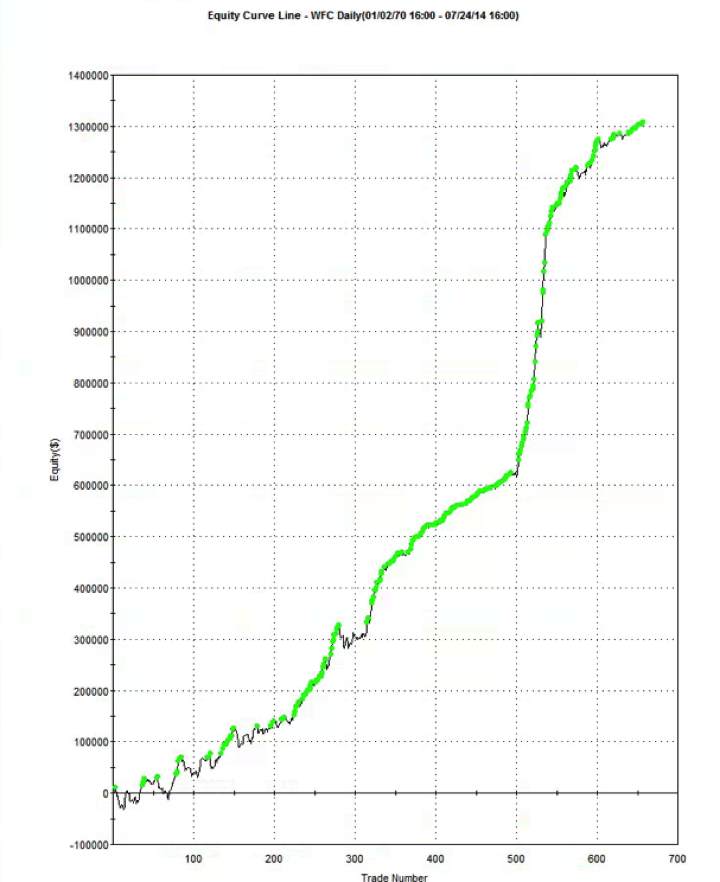
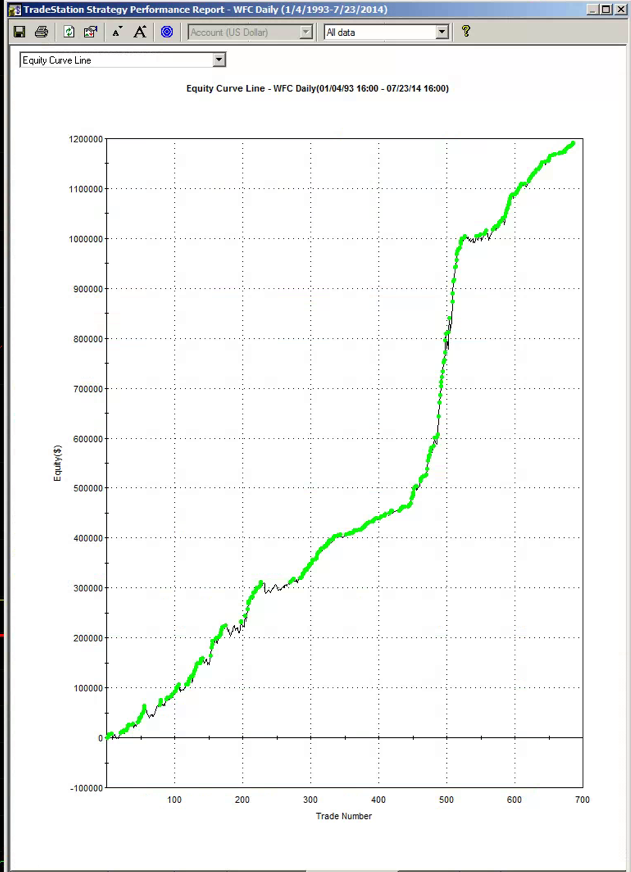
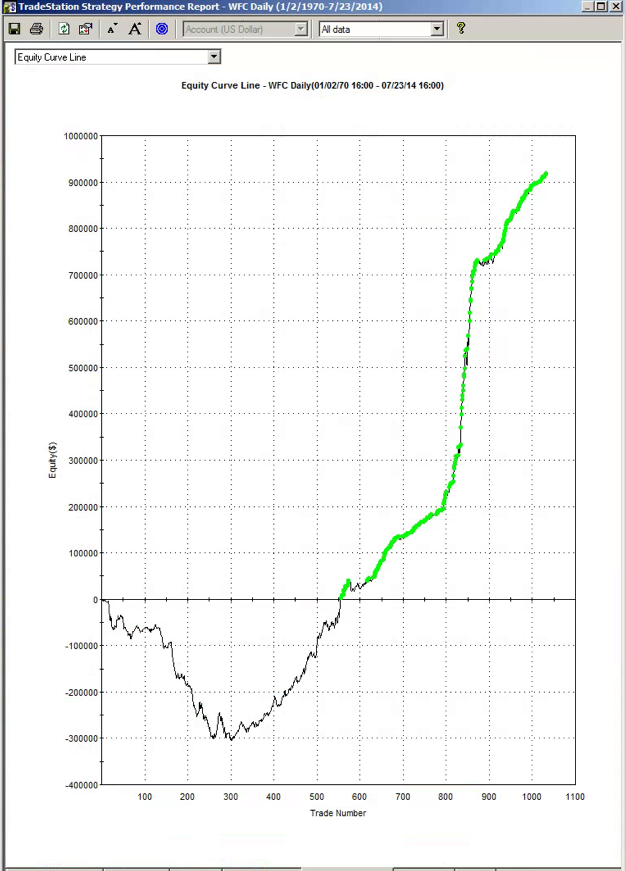
Another approach is to build the model using a data set spanning a different period. I did this with WFC using data from 1990, rather than 1970. Not only was the performance from 1990-2014 better, so too was the performance during the OOS period 1970-1989.  Profit factor was 2.49 and %Win rate was 70% across the 44 year period from 1970.  For the period from 1990, the performance metrics increase to 3.04 and 73%, respectively.

SSALGOTRADING AD

So in this case, it appears, a most robust strategy resulted from using less data, rather than more.  At first this appears counterintuitive. But it’s quite possible for a strategy to be over-condition on behavior that is no longer relevant to the market today. Eliminating such conditioning can sometimes enable strategies to emerge that have greater longevity.

WFC from 1970-2014 (1990 data)

Performance

Optimizing Strategy Robustness

Below is the equity curve for an equity strategy I developed recently, implemented in WFC.  The results appear outstanding:  no losing years in over 20 years, profit factor of 2.76 and average win rate of 75%.  Out-of-sample results (double blind) for 2013 and 2014:  net returns of 27% and 16% YTD.

WFC from 1993-2014


So far so good. However, if we take a step back through the earlier out of sample period, from 1970, the picture is rather less rosy:


WFC from 1970-2014


Now, at this point, some of you will be saying:  nothing to see here – it’s obviously just curve fitting.  To which I would respond that I have seen successful strategies, including several hedge fund products, with far shorter and less impressive back-tests than the initial 20-year history I showed above.

SSALGOTRADING AD

That said, would you be willing to take the risk of trading a strategy such as this one?  I would not:  at the back of my mind would always be the concern that the market might easily revert to the conditions that applied during the 1970s and 1980’s.  I expect many investors would share that concern.

But to the point of this post:  most strategies are designed around the criterion of maximizing net profit.  Occasionally you might come across someone who has considered risk, perhaps in the form of drawdown, or Sharpe ratio.  But, in general, it’s all about optimizing performance.

Suppose that, instead of maximizing performance, your objective was to maximize the robustness of the strategy.  What criteria would you use?

In my own research, I have used a great many different objective functions, often multi-dimensional.  Correlation to the perfect equity curve, net profit / max drawdown and Sortino ratio are just a few examples.  But if I had to guess, I would say that the criteria that tends to produce the most robust strategies and reliable out of sample performance is the maximization of the win rate, subject to a minimum number of trades.

I am not aware of a great deal of theory on this topic. I would be interested to learn of other readers’ experience.