A High Frequency Scalping Strategy on Collective2

Scalping vs. Market Making

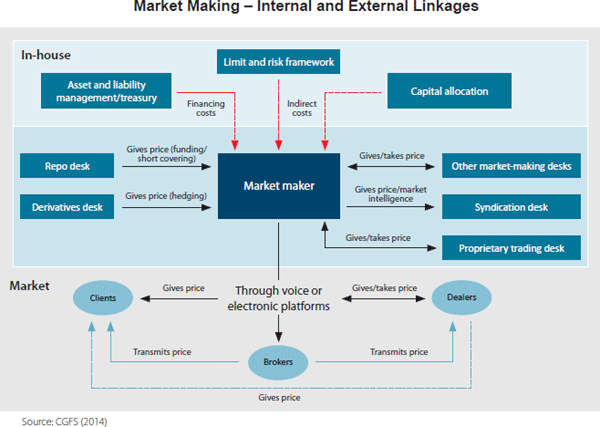
A market-making strategy is one in which the system continually quotes on the bid and offer and looks to make money from the bid-offer spread (and also, in the case of equities, rebates).  During a typical trading day, inventories will build up on the long or short side of the book as the market trades up and down.  There is no intent to take a market view as such, but most sophisticated market making strategies will use microstructure models to help decide whether to “lean” on the bid or offer at any given moment. Market makers may also shade their quotes to reduce the buildup of inventory, or even pull quotes altogether if they suspect that informed traders are trading against them (a situation referred to as “toxic flow”).  They can cover short positions through the repo desk and use derivatives to hedge out the risk of an accumulated inventory position.

marketmaking

A scalping strategy shares some of the characteristics of  a market making strategy:  it will typically be mean reverting, seeking to enter passively on the bid or offer and the average PL per trade is often in the region of a single tick.  But where a scalping strategy differs from market making is that it does take a view as to when to get long or short the market, although that view may change many times over the course of a trading session.  Consequently, a scalping strategy will only ever operate on one side of the market at a time, working the bid or offer; and it will typically never build inventory, since will it usually reverse and later try to sell for a profit the inventory it has previously purchased, hopefully at a lower price.

In terms of performance characteristics, a market making strategy will often have a double-digit Sharpe Ratio, which means that it may go for many days, weeks, or months, without taking a loss.  Scalping is inherently riskier, since it is taking directional bets, albeit over short time horizons.  With a Sharpe Ratio in the region of 3 to 5, a scalping strategy will often experience losing days and even losing months.

So why prefer scalping to market making?  It’s really a question of capability.  Competitive advantage in scalping derives from the successful exploitation of identified sources of alpha, whereas  market making depends primarily on speed and execution capability. Market making requires HFT infrastructure with latency measured in microseconds, the ability to layer orders up and down the book and manage order priority.  Scalping algos are generally much less demanding in terms of trading platform requirements: depending on the specifics of the system, they can be implemented successfully on many third party networks.

Developing HFT Futures Strategies

Some time ago my firm Systematic Strategies began research and development on a number of HFT strategies in futures markets.  Our primary focus has always been HFT equity strategies, so this was something of a departure for us, one that has entailed a significant technological obstacles (more on this in due course). Amongst the strategies we developed were several very profitable scalping algorithms in fixed income futures.  The majority trade at high frequency, with short holding periods measured in seconds or minutes, trading tens or even hundreds of times a day.
xtraderThe next challenge we faced was what to do with our research product.  As a proprietary trading firm our first instinct was to trade the strategies ourselves; but the original intent had been to develop strategies that could provide the basis of a hedge fund or CTA offering.  Many HFT strategies are unsuitable for that purpose, since the technical requirements exceed the capabilities of the great majority of standard trading platforms typically used by managed account investors. Besides, HFT strategies typically offer too limited capacity to be interesting to larger, institutional investors.

In the end we arrived at a compromise solution, keeping the highest frequency strategies in-house, while offering the lower frequency strategies to outside investors. This enabled us to keep the limited capacity of the highest frequency strategies for our own trading, while offering investors significant capacity in strategies that trade at lower frequencies, but still with very high performance characteristics.

HFT Bond Scalping

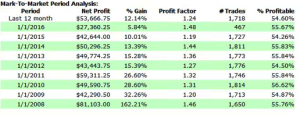
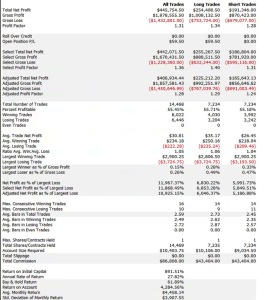
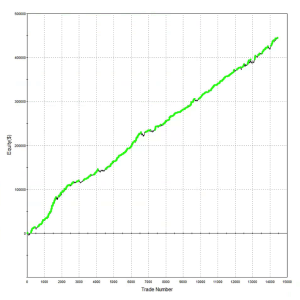
A typical example is the following scalping strategy in US Bond Futures.  The strategy combines two of the lower frequency algorithms we developed for bond futures that scalp around 10 times per session.  The strategy attempts to take around 8 ticks out of the market on each trade and averages around 1 tick per trade.   With a Sharpe Ratio of over 3, the strategy has produced net profits of approximately $50,000 per contract per year, since 2008.    A pleasing characteristic of this and other scalping strategies is their consistency:  There have been only 10 losing months since January 2008, the last being a loss of $7,100 in Dec 2015 (the prior loss being $472 in July 2013!)

Annual P&L

Fig2

Strategy Performance

fig4Fig3


Offering The Strategy to Investors on Collective2

The next challenge for us to solve was how best to introduce the program to potential investors.  Systematic Strategies is not a CTA and our investors are typically interested in equity strategies.  It takes a great deal of hard work to persuade investors that we are able to transfer our expertise in equity markets to the very different world of futures trading. While those efforts are continuing with my colleagues in Chicago, I decided to conduct an experiment:  what if we were to offer a scalping strategy through an online service like Collective2?  For those who are unfamiliar, Collective2 is an automated trading-system platform that allowed the tracking, verification, and auto-trading of multiple systems.  The platform keeps track of the system profit and loss, margin requirements, and performance statistics.  It then allows investors to follow the system in live trading, entering the system’s trading signals either manually or automatically.

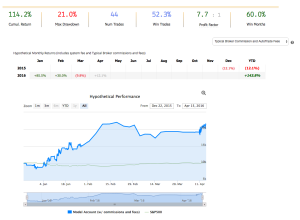
Offering a scalping strategy on a platform like this certainly creates visibility (and a credible track record) with investors; but it also poses new challenges.  For example, the platform assumes trading cost of around $14 per round turn, which is at least 2x more expensive than most retail platforms and perhaps 3x-5x more expensive than the cost a HFT firm might pay.  For most scalping strategies that are designed to take a tick out of the market such high fees would eviscerate the returns.  This motivated our choice of US Bond Futures, since the tick size and average trade are sufficiently large to overcome even this level of trading friction.  After a couple of false starts, during which we played around with the algorithms and boosted strategy profitability with a couple of low frequency trades, the system is now happily humming along and demonstrating the kind of performance it should (see below).

For those who are interested in following the strategy’s performance, the link on collective2 is here.


Collective2Perf

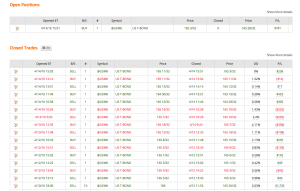
trades

Disclaimer

About the results you see on this Web site

Past results are not necessarily indicative of future results.

These results are based on simulated or hypothetical performance results that have certain inherent limitations. Unlike the results shown in an actual performance record, these results do not represent actual trading. Also, because these trades have not actually been executed, these results may have under-or over-compensated for the impact, if any, of certain market factors, such as lack of liquidity. Simulated or hypothetical trading programs in general are also subject to the fact that they are designed with the benefit of hindsight. No representation is being made that any account will or is likely to achieve profits or losses similar to these being shown.

In addition, hypothetical trading does not involve financial risk, and no hypothetical trading record can completely account for the impact of financial risk in actual trading. For example, the ability to withstand losses or to adhere to a particular trading program in spite of trading losses are material points which can also adversely affect actual trading results. There are numerous other factors related to the markets in general or to the implementation of any specific trading program, which cannot be fully accounted for in the preparation of hypothetical performance results and all of which can adversely affect actual trading results.

Material assumptions and methods used when calculating results

The following are material assumptions used when calculating any hypothetical monthly results that appear on our web site.

  • Profits are reinvested. We assume profits (when there are profits) are reinvested in the trading strategy.
  • Starting investment size. For any trading strategy on our site, hypothetical results are based on the assumption that you invested the starting amount shown on the strategy’s performance chart. In some cases, nominal dollar amounts on the equity chart have been re-scaled downward to make current go-forward trading sizes more manageable. In these cases, it may not have been possible to trade the strategy historically at the equity levels shown on the chart, and a higher minimum capital was required in the past.
  • All fees are included. When calculating cumulative returns, we try to estimate and include all the fees a typical trader incurs when AutoTrading using AutoTrade technology. This includes the subscription cost of the strategy, plus any per-trade AutoTrade fees, plus estimated broker commissions if any.
  • “Max Drawdown” Calculation Method. We calculate the Max Drawdown statistic as follows. Our computer software looks at the equity chart of the system in question and finds the largest percentage amount that the equity chart ever declines from a local “peak” to a subsequent point in time (thus this is formally called “Maximum Peak to Valley Drawdown.”) While this is useful information when evaluating trading systems, you should keep in mind that past performance does not guarantee future results. Therefore, future drawdowns may be larger than the historical maximum drawdowns you see here.

Trading is risky

There is a substantial risk of loss in futures and forex trading. Online trading of stocks and options is extremely risky. Assume you will lose money. Don’t trade with money you cannot afford to lose.

High Frequency Trading: Equities vs. Futures

A talented young system developer I know recently reached out to me with an interesting-looking equity curve for a high frequency strategy he had designed in E-mini futures:

Fig1

Pretty obviously, he had been making creative use of the “money management” techniques so beloved by futures systems designers.  I invited him to consider how it would feel to be trading a 1,000-lot E-mini position when the market took a 20 point dive.  A $100,000 intra-day drawdown might make the strategy look a little less appealing.  On the other hand, if you had already made millions of dollars in the strategy, you might no longer care so much.

SSALGOTRADING AD

A more important criticism of money management techniques is that they are typically highly path-dependent:  if you had started your strategy slightly closer to one of the drawdown periods that are almost unnoticeable on the chart, it could have catastrophic consequences for your trading account.  The only way to properly evaluate this, I advised, was to backtest the strategy over many hundreds of thousands of test-runs using Monte Carlo simulation.  That would reveal all too clearly that the risk of ruin was far larger than might appear from a single backtest.

Next, I asked him whether the strategy was entering and exiting passively, by posting bids and offers, or aggressively, by crossing the spread to sell at the bid and buy at the offer.  I had a pretty good idea what his answer would be, given the volume of trades in the strategy and, sure enough he confirmed the strategy was using passive entries and exits.  Leaving to one side the challenge of executing a trade for 1,000 contracts in this way, I instead ask him to show me the equity curve for a single contract in the underlying strategy, without the money-management enhancement. It was still very impressive.

Fig2


The Critical Fill Assumptions For Passive Strategies

But there is an underlying assumption built into these results, one that I have written about in previous posts: the fill rate.  Typically in a retail trading platform like Tradestation the assumption is made that your orders will be filled if a trade occurs at the limit price at which the system is attempting to execute.  This default assumption of a 100% fill rate is highly unrealistic.  The system’s orders have to compete for priority in the limit order book with the orders of many thousands of other traders, including HFT firms who are likely to beat you to the punch every time.  As a consequence, the actual fill rate is likely to be much lower: 10% to 20%, if you are lucky.  And many of those fills will be “toxic”:  buy orders will be the last to be filled just before the market  moves lower and sell orders will be the last to get filled just as the market moves higher. As a result, the actual performance of the strategy will be a very long way from the pretty picture shown in the chart of the hypothetical equity curve.

One way to get a handle on the problem is to make a much more conservative assumption, that your limit orders will only get filled when the market moves through them.  This can easily be achieved in a product like Tradestation by selecting the appropriate backtest option:

fig3


The strategy performance results often look very different when this much more conservative fill assumption is applied.  The outcome for this system was not at all unusual:

Fig4


Of course, the more conservative assumption applied here is also unrealistic:  many of the trading system’s sell orders would be filled at the limit price, even if the market failed to move higher (or lower in the case of a buy order).  Furthermore, even if they were not filled during the bar-interval in which they were issued, many limit orders posted by the system would be filled in subsequent bars.  But the reality is likely to be much closer to the outcome assuming a conservative fill-assumption than an optimistic one.    Put another way:  if the strategy demonstrates good performance under both pessimistic and optimistic fill assumptions there is a reasonable chance that it will perform well in practice, other considerations aside.

An Example of a HFT Equity Strategy

Let’s contrast the futures strategy with an example of a similar HFT strategy in equities.  Under the optimistic fill assumption the equity curve looks as follows:

Fig5

Under the more conservative fill assumption, the equity curve is obviously worse, but the strategy continues to produce excellent returns.  In other words, even if the market moves against the system on every single order, trading higher after a sell order is filled, or lower after a buy order is filled, the strategy continues to make money.

Fig6

Market Microstructure

There is a fundamental reason for the discrepancy in the behavior of the two strategies under different fill scenarios, which relates to the very different microstructure of futures vs. equity markets.   In the case of the E-mini strategy the average trade might be, say, $50, which is equivalent to only 4 ticks (each tick is worth $12.50).  So the average trade: tick size ratio is around 4:1, at best.  In an equity strategy with similar average trade the tick size might be as little as 1 cent.  For a futures strategy, crossing the spread to enter or exit a trade more than a handful of times (or missing several limit order entries or exits) will quickly eviscerate the profitability of the system.  A HFT system in equities, by contrast, will typically prove more robust, because of the smaller tick size.

Of course, there are many other challenges to high frequency equity trading that futures do not suffer from, such as the multiplicity of trading destinations.  This means that, for instance, in a consolidated market data feed your system is likely to see trading opportunities that simply won’t arise in practice due to latency effects in the feed.  So the profitability of HFT equity strategies is often overstated, when measured using a consolidated feed.  Futures, which are traded on a single exchange, don’t suffer from such difficulties.  And there are a host of other differences in the microstructure of futures vs equity markets that the analyst must take account of.  But, all that understood, in general I would counsel that equities make an easier starting point for HFT system development, compared to futures.

ETFs vs. Hedge Funds – Why Not Combine Both?

Grace Kim, Brand Director at DarcMatter, does a good job of setting out the pros and cons of ETFs vs hedge funds for the family office investor in her LinkedIn post.

She points out that ETFs now offer as much liquidity as hedge funds, both now having around $2.96 trillion in assets.  So, too, are her points well made about the low cost, diversification and ease of investing in ETFs compared to hedge funds.

But, of course, the point of ETF investing is to mimic the return in some underlying market – to gain beta exposure, in the jargon – whereas hedge fund investing is all about alpha – the incremental return that is achieved over and above the return attributable to market risk factors.

SSALGOTRADING AD

But should an investor be forced to choose between the advantages of diversification and liquidity of ETFs on the one hand and the (supposedly) higher risk-adjusted returns of hedge funds, on the other?  Why not both?

Diversified Long/Short ETF Strategies

In fact, there is nothing whatever to prevent an investment strategist from constructing a hedge fund strategy using ETFs.  Just as one can enjoy the hedging advantages of a long/short equity hedge fund portfolio, so, too, can one employ the same techniques to construct long/short ETF portfolios.  Compared to a standard equity L/S portfolio, an ETF L/S strategy can offer the added benefit of exposure to (or hedge against) additional risk factors, including currency, commodity or interest rate.

For an example of this approach ETF long/short portfolio construction, see my post on Developing Long/Short ETF Strategies.  As I wrote in that article:

My preference for ETFs is due primarily to the fact that  it is easier to achieve a wide diversification in the portfolio with a more limited number of securities: trading just a handful of ETFs one can easily gain exposure, not only to the US equity market, but also international equity markets, currencies, real estate, metals and commodities.

More Exotic Hedge Fund Strategies with ETFs

But why stop at vanilla long/short strategies?  ETFs are so varied in terms of the underlying index, leverage and directional bias that one can easily construct much more sophisticated strategies capable of tapping the most obscure sources of alpha.

Take our very own Volatility ETF strategy for example.  The strategy constructs hedged positions, not by being long/short, but by being short/short or long/long volatility and inverse volatility products, like SVXY and UVXY, or VXX and XIV.  The strategy combines not only strategic sources of alpha that arise from factors such as convexity in the levered ETF products, but also short term alpha signals arising from temporary misalignments in the relative value of comparable ETF products.  These can be exploited by tactical, daytrading algorithms of a kind more commonly applied in the context of high frequency trading.

For more on this see for example Investing in Levered ETFs – Theory and Practice.

Does the approach work?  On the basis that a picture is worth a thousand words, let me answer that question as follows:

Systematic Strategies Volatility ETF Strategy

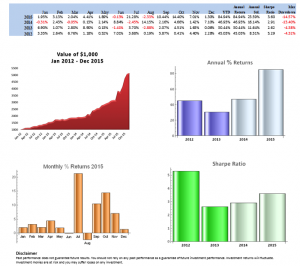
Perf Summary Dec 2015

Conclusion

There is no reason why, in considering the menu of ETF and hedge fund strategies, it should be a case of either-or.  Investors can combine the liquidity, cost and diversification advantages of ETFs with the alpha generation capabilities of well-constructed hedge fund strategies.

A New Approach to Equity Valuation

How Analysts Traditionally Value Equity

fig1I learned the traditional method for producing equity valuations in the 1980’s, from  Chase bank’s excellent credit training program.  The standard technique was to develop several years of projected financial statements, and then discount the cash flows and terminal value to arrive at an NPV. I’m guessing the basic approach hasn’t changed all that much over the last 30-40 years and probably continues to serve as the fundamental building block for M&A transactions and PE deals.

Damadoran

Amongst several excellent texts on the topic I can recommend, for example, Aswath Damodaran’s book on valuation.

Arguably the weakest point in the methodology are the assumptions made about the long term growth rate of the business and the rate used to discount the cash flows to produce the PV.  Since we are dealing with long term projections, small variations in these rates can make a considerable difference to the outcome.

The Monte Carlo Approach

Around 20 years ago I wrote a paper titled “A New Approach to Equity Valuation”, in which I attempted to define a new methodology for equity valuation.  The idea was simple enough:  instead of guessing an appropriate rate to discount the projected cash flows generated by the company, you embed the riskiness into the cash flows themselves, using probability distributions.  That allows you to model the cash flows using Monte Carlo simulation and discount them using the risk-free rate, which is much easier to determine.  In a similar vein,  the model can allow for stochastic growth rates, perhaps also taking into account the arrival of potential new entrants, or disruptive technologies.

I recall taking the idea to an acquaintance of mine who at the time was head of M&A at a prestigious boutique bank in London.  About five minutes into the conversation I realized I had lost him at “Monte Carlo”.  It was yet another instance of the gulf between the fundamental and quantitative approach to investment finance, something I have always regarded as rather artificial.  The line has blurred in several places over the last few decades – option theory of the firm and factor models, to name but two examples – but remains largely intact.  I have met very few equity analysts who have the slightest clue about quantitative research and vice-versa, for that matter.  This is a pity in my view, as there is much to be gained by blending knowledge of the two disciplines.

SSALGOTRADING AD

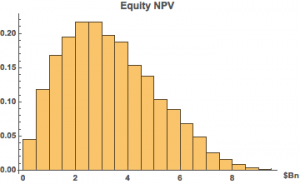
The basic idea of the Monte Carlo approach is to formulate probability distributions for key variables that drive the business, such as sales, gross margin, cost of goods, etc., as well as related growth rates. You then determine the outcome in terms of P&L and cash flows over a large number of simulations, from which you can derive a probability distribution for the firm/equity value.

npv

There are two potential sources of data one can use to build a Monte Carlo model: the historical distributions of the variables and information from line management. It is the latter that is likely to be especially useful, because you can embed management’s expertise and understanding of the business and its competitive environment directly into the model variables, rather than relying upon a single discount rate to account for all the possible sources of variation in the cash flows.

It can get a little complicated, of course: one cannot simply assume that all the variables evolve independently – COGS is likely to fall as a % of sales as sales increase, for example, due to economies of scale. Such interactive effects are critically important and it is necessary to dig deep into the inner workings of the business to model them successfully.  But to those who may view such a task as overwhelmingly complicated I can offer several counter examples.  For instance, in the 1970’s  I worked on large scale simulation models of the North Sea oil fields that incorporated volumes of information from geology to engineering to financial markets.  Another large scale simulation was built to assess how best to manage tanker traffic at one of the world’s busiest sea ports.

Creating a simulation model of  the financials of a single firm is a simple task, by comparison. And, after you have built the model it will typically remain fundamentally unchanged in basic form for many years making the task of producing valuation estimates much easier in future.

Applications of Monte Carlo Methods in Equity Valuation

Ok, so what’s the point?  At the end of the day, don’t you just end up with the same result as from traditional methods, i.e. an estimate of the equity or firm value? Actually no – what you have instead is an estimate of the probability distribution of the value, something decidedly more useful.

For example:

Contract Negotiation

Monte Carlo methods have been applied successfully to model contract negotiation scenarios, for instance for management consulting projects, where several rounds of negotiation are often involved in reaching an agreed pricing structure.

Negotiation

 Stock Selection

You might build a portfolio of value stocks whose share price is below the median value, in the expectation that the majority of the universe will prove to be undervalued, over the long term.  Or you might embed information about the expected value of the equities in your universe (and their cashflow volatilities) into you portfolio construction model.

Private Equity / Mergers & Acquisitions

In a PE or M&A negotiation your model provides a range of values to select from, each of which is associated with an estimated “probability of overpayment”.  For example, your opening bid might be a little below the median value, where it is likely that you are under-bidding for the projected cash flows.  That allows some headroom to increase the bid, if necessary, without incurring too great a risk of over-paying.

Recent Research

A survey of recent research in the field yields some interesting results, amongst them a paper by Magnus Pedersen entitled Monte Carlo Simulation in Financial Valuation (2014).  Pedersen takes a rather different approach to applying Monte Carlo methods to equity valuation.   Specifically, he uses the historical distribution of the price/book ratio to derive the empirical distribution of the equity value rather than modeling the individual cash flows.  This is a sensible compromise for someone who, unlike an analyst at a major sell-side firm, may not have access to management information necessary to build a more sophisticated model.  Nevertheless, Pedersen is able to demonstrate quite interesting results using MC methods to construct equity portfolios (weighted according to the Kelly criterion), in an accompanying paper Portfolio Optimization & Monte Carlo Simulation (2014).

For those who find the subject interesting, Pedersen offers several free books on his web site, which are worth reviewing.

cover_strategies-sp500

Transcendental Spheres

One of the most beautiful equations in the whole of mathematics is the identity (and its derivation):


I recently came across another beautiful mathematical concept that likewise relates the two transcendental numbers e and Pi.

We begin by reviewing the concept of a unit sphere, which in 3-dimensional space is the region of points described by the equation:

We can some generate random coordinates that satisfy the equation, to produce the expected result:

The equation above represents a 3-D unit sphere using the standard Euclidean Norm.  It can be generalized to produce a similar formula for an n-dimensional hyper-sphere:

Another way to generalize the concept is by extending the Euclidean distance measure with what are referred to as p-Norms, or L-p spaces:

The shape of a unit sphere in L-p space can take many different forms, including some that have “corners”.  Here are some examples of 2-dimensional spheres for values of p varying in the range { 0.25, 4}:


which can also be explored in the complex plane:

Reverting to the regular Euclidean metric, let’s focus on the n-dimensional unit hypersphere, whose volume is given by:

To see this, note that the volume of the unit sphere in 2-D space is just  the surface area of a unit circle, which has area V(2) =  π.  Furthermore:

This is the equation for the volume of the unit hypersphere in n dimensions.  Hence we have the following recurrence relationship:

This recursion allows us to prove the equation for the volume of the unit hypersphere, by induction.

The function V(n) take a maximal value of 5.26 for n = 5 dimensions, thereafter declining rapidly towards zero:


In the limit, the volume of the n-dimensional unit hypersphere tends to zero:


Now, consider the sum of the volumes of unit hypersphere in even dimensions, i.e. for n = 0, 2, 4, 6,….  For example, the first few terms of the sum are:


These are the initial terms of a well-known McClaurin expansion, which in the limit produces the following remarkable result:

In other words, the infinite sum of the volumes of n-dimensional unit hyperspheres evaluates to a power relationship between the two most famous transcendental numbers.  The result, known as Gelfond’s constant, is itself a transcendental number: