The Amazon Killer

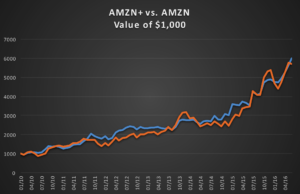
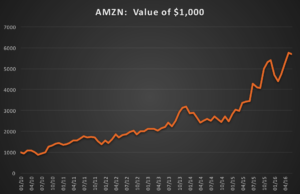
Amazon (NASDAQ:AMZN) has been on a tear over the last decade, especially since the financial crisis of 2008.  If you had been smart (or lucky) enough to buy the stock at the beginning of 2010, each $1,000 you invested would now be worth over $5,700, giving a CAGR of over 31%.

fig 1

Source:  Yahoo! Finance

It’s hard to argue with success, but could you have done better? The answer, surprisingly, is yes – and by a wide margin.

 SSALGOTRADING AD

Introducing AMZN+

I am going to reveal this mystery stock in due course and, I promise you, the investment recommendation is fully actionable.  For now, let’s just refer to it as AMZN+.

A comparison between investments made in AMZN and AMZN+ over the period from January 2010 to June 2016 is shown the chart following.


fig 2


Visually, there doesn’t appear to be much of a difference in overall performance.  However, it is apparent that AMZN+ is a great deal less volatile than its counterpart.

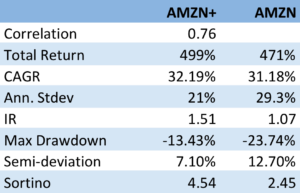
The table below give a more telling account of the relative outperformance by AMZN+.

table 1


The two investments are very highly correlated, with AMZN+ producing an extra 1% per annum in CAGR over the 6 ½ year period.

The telling distinction, however, lies on the risk side of the equation.  Here AMZN+ outperforms AMZN by a wide margin, with an annual standard deviation of only 21% compared to 29%.  What this means is that AMZN+ produces almost a 50% higher return than AMZN per unit of risk (information ratio 1.51 vs. 1.07).

The more conservative risk profile of AMZN+ is also reflected in lower maximum drawdown (-13.43% vs -23.74%), semi-deviation and higher Sortino Ratio (see this article for an explanation of these terms).

Bottom line:  you can produce around the same rate of return with substantially less risk by investing in AMZN+, rather than AMZN.


Comparing Equally Risky Investments

There is another way to make the comparison, which some investors might find more appealing.  Risk is, after all, an altogether more esoteric subject than return, which every investor understands.

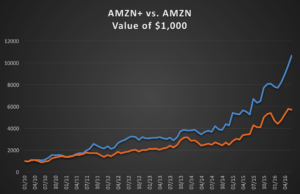
So let’s say the investor adopts the same risk budget as for his original investment in AMZN, i.e. an annual volatility of just over 29%.  We can produce the same overall level of risk in AMZN+, equalizing the riskiness of the two investments, simply by leveraging the investment in AMZN+ by a factor of 1.36, using margin money.  i.e. we borrow $360 and invest a total of $1,360 in AMZN+, for each $1,000 we would have invested in AMZN.  Look at the difference in performance:

fig 3


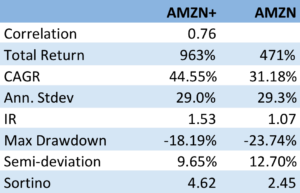
The investor’s total return in AMZN+ would have been 963%, almost double the return in AMZN over the same period and with a CAGR of over 44.5%, more than 13% per annum higher than AMZN.


table 2


Note that, despite having an almost identical annual standard deviation, AMZN+ still enjoys a lower maximum drawdown and downside risk than AMZN.


The Big Reveal

Ok, so what is this mystery stock, AMZN+?  Actually it isn’t a stock:  it’s a simple portfolio, rebalanced monthly, with 66% of the investment being made in AMZN and 34% in the Direxion Daily 20+ Yr Trsy Bull 3X ETF (NYSEArca: TMF).

Well, that’s a little bit of a cheat, although not much of one:  it isn’t too much of a challenge to put $667 of every $1,000 in AMZN and the remaining $333 in TMF, rebalancing the portfolio at the end of every month.

The next question an investor might want to ask is: what other stocks could I apply this approach to?  The answer is: a great many of them.  And where you end up, ultimately, is with the discovery that you can eliminate a great deal of unnecessary risk with a portfolio of around 20-30 well-chosen assets.


The Fundamental Lesson from Portfolio Theory

We saw that AMZN incurred a risk of 29% in annual standard deviation, compared to only 21% for the AMZN+ portfolio.  What does the investor gain by taking that extra 8% in annual risk? Nothing at all – in fact he would have achieved a slightly worse return.

The key take-away from this simple example is the fundamental law of modern portfolio theory:


The market will not compensate an investor for taking diversifiable risk


As they say, diversification is the only free lunch on Wall Street.  So make the most of it.


Crash-Proof Investing

As markets continue to make new highs against a backdrop of ever diminishing participation and trading volume, investors have legitimate reasons for being concerned about prospects for the remainder of 2016 and beyond, even without consideration to the myriad of economic and geopolitical risks that now confront the US and global economies. Against that backdrop, remaining fully invested is a test of nerves for those whose instinct is that they may be picking up pennies in front an oncoming steamroller.  On the other hand, there is a sense of frustration in cashing out, only to watch markets surge another several hundred points to new highs.

In this article I am going to outline some steps investors can take to match their investment portfolios to suit current market conditions in a way that allows them to remain fully invested, while safeguarding against downside risk.  In what follows I will be using our own Strategic Volatility Strategy, which invests in volatility ETFs such as the iPath S&P 500 VIX ST Futures ETN (NYSEArca:VXX) and the VelocityShares Daily Inverse VIX ST ETN (NYSEArca:XIV), as an illustrative example, although the principles are no less valid for portfolios comprising other ETFs or equities.

SSALGOTRADING AD

Risk and Volatility

Risk may be defined as the uncertainty of outcome and the most common way of assessing it in the context of investment theory is by means of the standard deviation of returns.  One difficulty here is that one may never ascertain the true rate of volatility – the second moment – of a returns process; one can only estimate it.  Hence, while one can be certain what the closing price of a stock was at yesterday’s market close, one cannot say what the volatility of the stock was over the preceding week – it cannot be observed the way that a stock price can, only estimated.  The most common estimator of asset volatility is, of course, the sample standard deviation.  But there are many others that are arguably superior:  Log-Range, Parkinson, Garman-Klass to name but a few (a starting point for those interested in such theoretical matters is a research paper entitled Estimating Historical Volatility, Brandt & Kinlay, 2005).

Leaving questions of estimation to one side, one issue with using standard deviation as a measure of risk is that it treats upside and downside risk equally – the “risk” that you might double your money in an investment is regarded no differently than the risk that you might see your investment capital cut in half.  This is not, of course, how investors tend to look at things: they typically allocate a far higher cost to downside risk, compared to upside risk.

One way to address the issue is by using a measure of risk known as the semi-deviation.  This is estimated in exactly the same way as the standard deviation, except that it is applied only to negative returns.  In other words, it seeks to isolate the downside risk alone.

This leads directly to a measure of performance known as the Sortino Ratio.  Like the more traditional Sharpe Ratio, the Sortino Ratio is a measure of risk-adjusted performance – the average return produced by an investment per unit of risk.  But, whereas the Sharpe Ratio uses the standard deviation as the measure of risk, for the Sortino Ratio we use the semi-deviation. In other words, we are measuring the expected return per unit of downside risk.

There may be a great deal of variation in the upside returns of a strategy that would penalize the risk-adjusted returns, as measured by its Sharpe Ratio. But using the Sortino Ratio, we ignore the upside volatility entirely and focus exclusively on the volatility of negative returns (technically, the returns falling below a given threshold, such as the risk-free rate.  Here we are using zero as our benchmark).  This is, arguably, closer to the way most investors tend to think about their investment risk and return preferences.

In a scenario where, as an investor, you are particularly concerned about downside risk, it makes sense to focus on downside risk.  It follows that, rather than aiming to maximize the Sharpe Ratio of your investment portfolio, you might do better to focus on the Sortino Ratio.


Factor Risk and Correlation Risk

Another type of market risk that is often present in an investment portfolio is correlation risk.  This is the risk that your investment portfolio correlates to some other asset or investment index.  Such risks are often occluded – hidden from view – only to emerge when least wanted.  For example, it might be supposed that a “dollar-neutral” portfolio, i.e. a portfolio comprising equity long and short positions of equal dollar value, might be uncorrelated with the broad equity market indices.  It might well be.  On the other hand, the portfolio might become correlated with such indices during times of market turbulence; or it might correlate positively with some sector indices and negatively with others; or with market volatility, as measured by the CBOE VIX index, for instance.

Where such dependencies are included by design, they are not a problem;  but when they are unintended and latent in the investment portfolio, they often create difficulties.  The key here is to test for such dependencies against a variety of risk factors that are likely to be of concern.  These might include currency and interest rate risk factors, for example;  sector indices; or commodity risk factors such as oil or gold (in a situation where, for example, you are investing a a portfolio of mining stocks).  Once an unwanted correlation is identified, the next step is to adjust the portfolio holdings to try to eliminate it.  Typically, this can often only be done in the average, meaning that, while there is no correlation bias over the long term, there may be periods of positive, negative, or alternating correlation over shorter time horizons.  Either way, it’s important to know.

Using the Strategic Volatility Strategy as an example, we target to maximize the Sortino Ratio, subject also to maintaining very lows levels of correlation to the principal risk factors of concern to us, the S&P 500 and VIX indices. Our aim is to create a portfolio that is broadly impervious to changes in the level of the overall market, or in the level of market volatility.


One method of quantifying such dependencies is with linear regression analysis.  By way of illustration, in the table below are shown the results of regressing the daily returns from the Strategic Volatility Strategy against the returns in the VIX and S&P 500 indices.  Both factor coefficients are statistically indistinguishable from zero, i.e. there is significant no (linear) dependency.  However, the constant coefficient, referred to as the strategy alpha, is both positive and statistically significant.  In simple terms, the strategy produces a return that is consistently positive, on average, and which is not dependent on changes in the level of the broad market, or its volatility.  By contrast, for example, a commonplace volatility strategy that entails capturing the VIX futures roll would show a negative correlation to the VIX index and a positive dependency on the S&P500 index.

Regression


Tail Risk

Ever since the publication of Nassim Taleb’s “The Black Swan”, investors have taken a much greater interest in the risk of extreme events.  If the bursting of the tech bubble in 2000 was not painful enough, investors surely appear to have learned the lesson thoroughly after the financial crisis of 2008.  But even if investors understand the concept, the question remains: what can one do about it?

The place to start is by looking at the fundamental characteristics of the portfolio returns.  Here we are not such much concerned with risk, as measured by the second moment, the standard deviation. Instead, we now want to consider the third and forth moments of the distribution, the skewness and kurtosis.

Comparing the two distributions below, we can see that the distribution on the left, with negative skew, has nonzero probability associated with events in the extreme left of the distribution, which in this context, we would associate with negative returns.  The distribution on the right, with positive skew, is likewise “heavy-tailed”; but in this case the tail “risk” is associated with large, positive returns.  That’s the kind of risk most investors can live with.


skewness


Source: Wikipedia


A more direct measure of tail risk is kurtosis, literally, “heavy tailed-ness”, indicating a propensity for extreme events to occur.  Again, the shape of the distribution matters:  a heavy tail in the right hand portion of the distribution is fine;  a heavy tail on the left (indicating the likelihood of large, negative returns) is a no-no.

Let’s take a look at the distribution of returns for the Strategic Volatility Strategy.  As you can see, the distribution is very positively skewed, with a very heavy right hand tail.  In other words, the strategy has a tendency to produce extremely positive returns. That’s the kind of tail risk investors prefer.

SVS


Another way to evaluate tail risk is to examine directly the performance of the strategy during extreme market conditions, when the market makes a major move up or down. Since we are using a volatility strategy as an example, let’s take a look at how it performs on days when the VIX index moves up or down by more than 5%.  As you can see from the chart below, by and large the strategy returns on such days tend to be positive and, furthermore, occasionally the strategy produces exceptionally high returns.


Convexity


The property of producing higher returns to the upside and lower losses to the downside (or, in this case, a tendency to produce positive returns in major market moves in either direction) is known as positive convexity.


Positive convexity, more typically found in fixed income portfolios, is a highly desirable feature, of course.  How can it be achieved?    Those familiar with options will recognize the convexity feature as being similar to the concept of option Gamma and indeed, one way to produce such a payoff is buy adding options to the investment mix:  put options to give positive convexity to the downside, call options to provide positive convexity to the upside (or using a combination of both, i.e. a straddle).


In this case we achieve positive convexity, not by incorporating options, but through a judicious choice of leveraged ETFs, both equity and volatility, for example, the ProShares UltraPro S&P500 ETF (NYSEArca:UPRO) and the ProShares Ultra VIX Short-Term Futures ETN (NYSEArca:UVXY).


Putting It All Together

While we have talked through the various concepts in creating a risk-protected portfolio one-at-a-time, in practice we use nonlinear optimization techniques to construct a portfolio that incorporates all of the desired characteristics simultaneously. This can be a lengthy and tedious procedure, involving lots of trial and error.  And it cannot be emphasized enough how important the choice of the investment universe is from the outset.  In this case, for instance, it would likely be pointless to target an overall positively convex portfolio without including one or more leveraged ETFs in the investment mix.

Let’s see how it turned out in the case of the Strategic Volatility Strategy.


SVS Perf


Note that, while the portfolio Information Ratio is moderate (just above 3), the Sortino Ratio is consistently very high, averaging in excess of 7.  In large part that is due to the exceptionally low downside risk, which at 1.36% is less than half the standard deviation (which is itself quite low at 3.3%).  It is no surprise that the maximum drawdown over the period from 2012 amounts to less than 1%.

A critic might argue that a CAGR of only 10% is rather modest, especially since market conditions have generally been so benign.  I would answer that criticism in two ways.  Firstly, this is an investment that has the risk characteristics of a low-duration government bond; and yet it produces a yield many times that of a typical bond in the current low interest rate environment.

Secondly, I would point out that these results are based on use of standard 2:1 Reg-T leverage. In practice it is entirely feasible to increase the leverage up to 4:1, which would produce a CAGR of around 20%.  Investors can choose where on the spectrum of risk-return they wish to locate the portfolio and the strategy leverage can be adjusted accordingly.


Conclusion

The current investment environment, characterized by low yields and growing downside risk, poses difficult challenges for investors.  A way to address these concerns is to focus on metrics of downside risk in the construction of the investment portfolio, aiming for high Sortino Ratios, low correlation with market risk factors, and positive skewness and convexity in the portfolio returns process.

Such desirable characteristics can be achieved with modern portfolio construction techniques providing the investment universe is chosen carefully and need not include anything more exotic than a collection of commonplace ETF products.

Developing A Volatility Carry Strategy

By way of introduction we begin by reviewing a well known characteristic of the  iPath S&P 500 VIX ST Futures ETN (NYSEArca:VXX).  In common with other long-volatility ETF /ETNs, VXX has a tendency to decline in value due to the upward sloping shape of the forward volatility curve.  The chart below which illustrates the fall in value of the VXX, together with the front-month VIX futures contract, over the period from 2009.


VXXvsVX


This phenomenon gives rise to opportunities for “carry” strategies, wherein a long volatility product such as VXX is sold in expectation that it will decline in value over time.  Such strategies work well during periods when volatility futures are in contango, i.e. when the longer dated futures contracts have higher prices than shorter dated futures contracts and the spot VIX Index, which is typically the case around 70% of the time.  An analogous strategy in the fixed income world is known as “riding down the yield curve”.  When yield curves are upward sloping, a fixed income investor can buy a higher-yielding bill or bond in the expectation that the yield will decline, and the price rise, as the security approaches maturity.  Quantitative easing put paid to that widely utilized technique, but analogous strategies in currency and volatility markets continue to perform well.

The challenge for any carry strategy is what happens when the curve inverts, as futures move into backwardation, often giving rise to precipitous losses.  A variety of hedging schemes have been devised that are designed to mitigate the risk.  For example, one well-known carry strategy in VIX futures entails selling the front month contract and hedging with a short position in an appropriate number of E-Mini S&P 500 futures contracts. In this case the hedge is imperfect, leaving the investor the task of managing a significant basis risk.
SSALGOTRADING AD

The chart of the compounded value of the VXX and VIX futures contract suggests another approach.  While both securities decline in value over time, the fall in the value of the VXX ETN is substantially greater than that of the front month futures contract.  The basic idea, therefore, is a relative value trade, in which we purchase VIX futures, the better performing of the pair, while selling the underperforming VXX.  Since the value of the VXX is determined by the value of the front two months VIX futures contracts, the hedge, while imperfect, is likely to entail less basis risk than is the case for the VIX-ES futures strategy.

Another way to think about the trade is this:  by combining a short position in VXX with a long position in the front-month futures, we are in effect creating a residual exposure in the value of the second month VIX futures contract relative to the first. So this is a strategy in which we are looking to capture volatility carry, not at the front of the curve, but between the first and second month futures maturities.  We are, in effect, riding down the belly of volatility curve.


The Relationship between VXX and VIX Futures

Let’s take a look at the relationship between the VXX and front month futures contract, which I will hereafter refer to simply as VX.  A simple linear regression analysis of VXX against VX is summarized in the tables below, and confirms two features of their relationship.

Firstly there is a strong, statistically significant relationship between the two (with an R-square of 75% ) – indeed, given that the value of the VXX is in part determined by VX, how could there not be?

Secondly, the intercept of the regression is negative and statistically significant.  We can therefore conclude that the underperformance of the VXX relative to the VX is not just a matter of optics, but is a statistically reliable phenomenon.  So the basic idea of selling the VXX against VX is sound, at least in the statistical sense.

Regression


Constructing the Initial Portfolio

In constructing our theoretical portfolio, I am going to gloss over some important technical issues about how to construct the optimal hedge and simply assert that the best one can do is apply a beta of around 1.2, to produce the following outcome:

Table1

VXX-VX Strategy


While broadly positive, with an information ratio of 1.32, the strategy performance is a little discouraging, on several levels.  Firstly, the annual volatility, at over 48%, is uncomfortably high. Secondly, the strategy experiences very substantial drawdowns at times when the volatility curve inverts, such as in August 2015 and January 2016.  Finally, the strategy is very highly correlated with the S&P500 index, which may be an important consideration for investors looking for ways to diversity their stock portfolio risk.


Exploiting Calendar Effects

We will address these issues in short order.  Firstly, however, I want to draw attention to an interesting calendar effect in the strategy (using a simple pivot table analysis).

Calendar

As you can see from the table above, the strategy returns in the last few days of the calendar month tend to be significantly below zero.

The cause of the phenomenon has to do with the way the VXX is constructed, but the important point here is that, in principle, we can utilize this effect to our advantage, by reversing the portfolio holdings around the end of the month.  This simple technique produces a significant improvement in strategy returns, while lowering the correlation:

Table2


Reducing Portfolio Risk and Correlation

We can now address the issue of the residual high level of strategy volatility, while simultaneously reducing the strategy correlation to a much lower level.  We can do this in a straightforward way by adding a third asset, the SPDR S&P 500 ETF Trust (NYSEArca:SPY), in which we will hold a short position, to exploit the negative correlation of the original portfolio.

We then adjust the portfolio weights to maximize the risk-adjusted returns, subject to limits on the maximum portfolio volatility and correlation.  For example, setting a limit of 10% for both volatility and correlation, we achieve the following result (with weights -0.37 0.27 -0.65 for VXX, VX and SPY respectively):


Table3


VXX-VX-SPY


Compared to the original portfolio, the new portfolio’s performance is much more benign during the critical period from Q2-2015 to Q1-2016 and while there remain several significant drawdown periods, notably in 2011, overall the strategy is now approaching an investable proposition, with an information ratio of 1.6 and annual volatility of 9.96% and correlation of 0.1.

Other configurations are possible, of course, and the risk-adjusted performance can be improved, depending on the investor’s risk preferences.


Portfolio Rebalancing

There is an element of curve-fitting in the research process as described so far, in as much as we are using all of the available data to July 2016 to construct a portfolio with the desired characteristics. In practice, of course, we will be required to rebalance the portfolio on a periodic basis, re-estimating the optimal portfolio weights as new data comes in.  By way of illustration, the portfolio was re-estimated using in-sample data to the end of Feb, 2016, producing out-of-sample results during the period from March to July 2016, as follows:

Table4


A detailed examination of the generic problem of how frequently to rebalance the portfolio is beyond the scope of this article and I leave it to interested analysts to perform the research for themselves.


Practical Considerations

In order to implement the theoretical strategy described above there are several important practical steps that need to be considered.


  • It is not immediately apparent how the weights should be applied to a portfolio comprising both ETNs and futures. In practice the best approach is to re-estimate the portfolio using a regression relationship expressed in $-value terms, rather than in percentages, in order to establish the quantity of VXX and SPY stock to be sold per single VX futures contract.
  • Reversing the portfolio holdings in the last few days of the month will add significantly to transaction costs, especially for the position in VX futures, for which the minimum tick size is $50. It is important to factor realistic estimates of transaction costs into the assessment of the strategy performance overall and specifically with respect to month-end reversals.
  • The strategy assumed  the availability of VXX and SPY to short, which occasionally can be a problem. It’s not such a big deal if you are maintaining a long-term short position, but flipping the position around over a few ays at the end of the month might be problematic, from time to time.
  • Also, we should take account of stock loan financing costs, which run to around 2.9% and 0.42% annually for VXX and SPY, respectively. These rates can vary with market conditions and stock availability, of course.
  • It is highly likely that other ETFs/ETNs could profitably be added to the mix in order to further reduce strategy volatility and improve risk-adjusted returns. Likely candidates could include, for example, the Direxion Daily 20+ Yr Trsy Bull 3X ETF (NYSEArca:TMF).
  • We have already mentioned the important issue of portfolio rebalancing. There is an argument for rebalancing more frequently to take advantage of the latest market data; on the other hand, too-frequent changes in the portfolio composition can undermine portfolio robustness, increase volatility and incur higher transaction costs. The question of how frequently to rebalance the portfolio is an important one that requires further testing to determine the optimal rebalancing frequency.
 

Conclusion

We have described the process of constructing a volatility carry strategy based on the relative value of the VXX ETN vs the front-month contract in VIX futures.  By combining a portfolio comprising short positions in VXX and SPY with a long position in VIX futures, the investor can, in principle achieve risk-adjusted returns corresponding to an information ratio of around 1.6, or more. It is thought likely that further improvements in portfolio performance can be achieved by adding other ETFs to the portfolio mix.
 

Is Internal Bar Strength A Random Walk? The Case of Exxon-Mobil

For those who prefer a little more rigor in their quantitative research, I can offer more a somewhat more substantive statistical argument in favor of the IBS indicator discussed in my previous post.

Specifically, we can show quite convincingly that the IBS process is stationary, a highly desirable property much sought-after in, for example, the construction of statistical arbitrage strategies.  Of course, by construction, the IBS is constrained to lie between the values of 0 and 1, so non-stationarity in the mean is highly unlikely.  But, conceivably, there could be some time dependency in the process or in its variance, for instance.  Then there is the further question as to whether the IBS indicator is mean-reverting, which would indicate that the underlying price process likewise has a tendency to mean revert.

Let’s take the IBS series for Exxon-Mobil (XOM) as an example to work with. I have computed the series from the beginning of 1990, and the first 100 values are shown in the plot below.


XOMIBS


Autocorrelation and Unit Root Tests

There appears to be little patterning in the process autocorrelations, and this is confirmed by formal statistical tests which fail to reject the null hypothesis that the first 20 autocorrelations are not, collectively, statistically significant.

XOMIBS Autocorrelations


XOMIBS acf test


SSALGOTRADING AD

Next we test for the presence of a unit root in the IBS process (highly unlikely, given its construction) and indeed, unsurprisingly, the null hypothesis of a unit root is roundly rejected by the Dickey-Fuller and Phillips-Perron tests.


XOMIBS Unit Root


Variance Ratio Tests

We next conduct a formal test to determine whether the IBS series follows a random walk.

The variance ratio test assesses the null hypothesis that a univariate time series y is a random walk. The null model is

y(t) = c + y(t–1) + e(t),

where c is a drift constant (assumed zero for the IBS series) and e(t) are uncorrelated innovations with zero mean.

  • When IID is false, the alternative is that the e(t) are correlated.
  • When IID is true, the alternative is that the e(t) are either dependent or not identically distributed (for example, heteroscedastic).


We test whether the XOM IBS series is a random walk using various step sizes and perform the test with and without the assumption that the innovations are independent and identically distributed.

Switching to Matlab, we proceed as follows:

q = [2 4 8 2 4 8];
flag = logical([1 1 1 0 0 0]);
[h,pValue,stat,cValue,ratio] = vratiotest(XOMIBS,’period’,q,’IID’,flag)

Here h is a vector of Boolean decisions for the tests, with length equal to the number of tests. Values of h equal to 1 indicate rejection of the random-walk null in favor of the alternative. Values of h equal to 0 indicate a failure to reject the random-walk null.

The variable ratio is a vector of variance ratios, with length equal to the number of tests. Each ratio is the ratio of:

  • The variance of the q-fold overlapping return horizon
  • q times the variance of the return series

For a random walk, these ratios are asymptotically equal to one. For a mean-reverting series, the ratios are less than one. For a mean-averting series, the ratios are greater than one.

For the XOM IBS process we obtain the following results:

h =  1   1   1   1   1   1
pValue = 1.0e-51 * [0.0000 0.0000 0.0000 0.0000 0.0000 0.1027]
stat = -27.9267 -21.7401 -15.9374 -25.1412 -20.2611 -15.2808
cValue = 1.9600 1.9600 1.9600 1.9600 1.9600 1.9600
ratio = 0.4787 0.2405 0.1191 0.4787 0.2405 0.1191

The random walk hypothesis is convincingly rejected for both IID and non-IID error terms.  The very low ratio values  indicate that the IBS process is strongly mean reverting.


Conclusion

While standard statistical tests fail to find evidence of any non-stationarity in the Internal Bar Strength signal for Exxon-Mobil, the hypothesis that the series follows a random walk (with zero drift) is roundly rejected by variance ratio tests.  These tests also confirm that the IBS series is strongly mean reverting, as we previously discovered empirically.

This represents an ideal scenario for trading purposes: a signal with the highly desirable properties that is both stationary and mean reverting.  In the case of Exxon-Mobil, there appears to be clear evidence from both statistical tests and empirical trading strategies using the Internal Bar Strength indicator that the tendency of the price series to mean-revert is economically as well as statistically significant.

The Internal Bar Strength Indicator

Internal Bar Strength (IBS) is an idea that has been around for some time.  IBS is based on the position of the day’s close in relation to the day’s range: it takes a value of 0 if the closing price is the lowest price of the day, and 1 if the closing price is the highest price of the day.

More formally:

IBS  =  (Close – Low) / (High – Low)

The IBS effect may be related to intraday over-reaction to news or market movements, which are then ”corrected” the next day.  It serves as a measure of the tendency of a price series to mean-revert over daily horizons.  I use the term “daily” advisedly: so far as I am aware, there has been no research (including my own) demonstrating the existence of an IBS effect at time horizons shorter, or longer, than one day.  Indeed, there has been very little in the way of academic research into the concept of any kind, which is strange considering how compelling are the results it is capable of producing.  Practitioners have been happy enough with that state of affairs, content to deploy this neglected indicator in their trading strategies, where it has often proved to be extremely useful (we use IBS in one of our volatility strategies). Since 2013, however, the cat has been let out of the bag, thanks to an excellent research paper by Alexander Pagonidis, who writes an interesting quantitative finance blog.

The essence of the idea is that stocks that close in the lowest part of the daily range, with an IBS of below, say, 0.2, will tend to rally the next day, while stocks that close in the highest quintile will often decline in value in the following session.  In his paper “The IBS Effect: Mean Reversion in Equity ETFs” (2013), Pagonidis researches the IBS effect in equity index ETFs in the US and several international markets.  He confirms that low IBS values in these assets are associated with high returns in the following day session, while high IBS values are associated with low returns. Average returns when IBS is below 0.20 are .35% ,while average returns when IBS is above 0.80 are -0.13%. According to his research, this effect has been present in equity ETFs since the early 90s and has been highly consistent through time.

SSALGOTRADING AD

IBS Strategy Performance

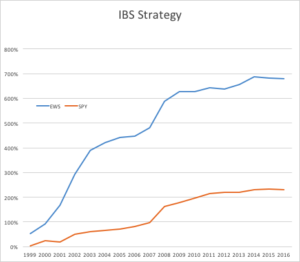
To give the reader some idea of the potential of the IBS effect, I have reproduced below equity curves for the IBS strategy for the SPDR S&P 500 ETF Trust (SPY) and iShares MSCI Singapore ETF (EWS) index ETFs over the period from 1999 to 2016.  The strategy buys at the close when IBS is below 0.2, and sells at the close when IBS exceeds 0.8, liquidating the position at the following market close. Strategy CAGR over the period has been of the order of 13% for SPY and as high as 40% for EWS, ignoring transaction costs.

IBS Strategy Chart SPY EWS


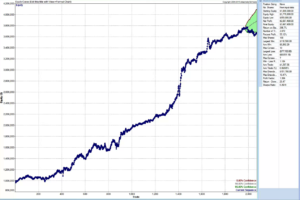
Note that in both cases strategy returns for SPY and EWS have diminished in recent years, turning negative in 2015 and 2016 YTD and this is true for ETFs in general.  It remains to be seen whether this deterioration in strategy performance is temporary or permanent.  There are some indications that the latter holds true, but the evidence is not quite definitive.  For example, the chart below shows daily equity curve for the SPY IBS strategy, with 95% confidence intervals for the latest 100 trades (up to the end of May 2016), constructed using Monte-Carlo bootstrap.  The equity curve appears to have penetrated the lower bound, indicating a statistically significant deterioration in the performance of the IBS strategy for SPY over the last year or so (EWS is similar).  That said, the equity curve does fall inside the boundaries of the 99% confidence interval, so those looking for greater certainty about the possible breakdown of the effect will need to wait a little longer for confirmation.


SPY IBS MSA


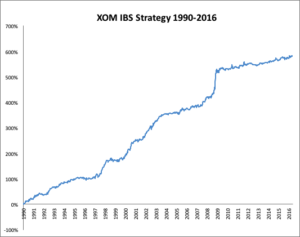
Whatever the outcome may be for SPY and other ETFs going forward, it is certainly true that IBS effects persist strongly for some individual equities, Exxon-Mobil Corp. (XOM) being a case in point (see below).  It’s worth taking note of the exceptional performance of the XOM IBS strategy during the latter quarter of 2008.  I will have much more to say on the application of the IBS indicator for individual equities in a future blog post.


XOM IBS Strategy


The Role of Range, Volume, Bull/Bear Markets, Volatility and Seasonality

Pagonidis goes on to detail several further important findings in relation to IBS.  It is clear from his research that high volatility is related to increased predictability of returns and a more powerful IBS effect, in particular the high IBS-negative return aspect.  As might be expected, the effect is also larger after days with high range, both for high and low IBS extremes.

Volume turns out to be especially important for  U.S. index ETFs:  in fact, the IBS effect only appears to work on high-volume days.

Pagonidis also separates the data into bull and bear market environments, based on whether 200-day returns are positive or not.  The size of the effect is roughly similar in each environment (slightly larger in bear markets), but it is greater in the direction of the overall trend: high IBS readings are followed by larger negative returns during bear markets, and vice versa.

Day of Week Effect

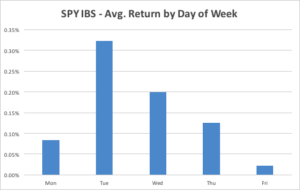
The IBS effect is also strongly seasonal, having the greatest impact on returns from Monday’s close to Tuesday’s close, as illustrated for the SPY ETF in the chart below.  This accounts for the phenomenon known popularly as “Turnaround Tuesday”, i.e. the tendency for the market to recover strongly from losses on a Monday.  The day-of-week effect is weakest for Fridays.


SPY DOW


The mean of the returns distribution is not the only aspect that IBS can predict. Skewness also varies significantly between IBS buckets, with low IBS readings being followed by highly skewed returns, and vice versa. Close-to-close returns after a bottom-bucket IBS day have average skewness of 0.65 across Equity Index ETF products, while top-bucket IBS days are followed by returns with skewness of 0.03. This finding has very useful risk management applications for investors concerned with tail risk.

IBS as a Filter for a Swing Trading Strategy in QQQ

The returns to an IBS-only strategy are both statistically and economically significant. However, commissions will greatly decrease the returns and increase the maximum drawdowns, however, making such an approach challenging in the real world. One alternative is to combine the IBS effect with mean reversion on longer timescales and only take trades when they align.

Pagonidis offers a simple demonstration using the Cutler’s RSI indicator that shows how the IBS effect can be used to boost returns of a swing trading strategy while significantly decreasing the number of trades needed.

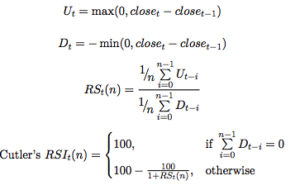
Cutler’s RSI at time t is calculated as follows:


RSI


Pagonidis tests a simple, long-only strategy that trades the PowerShares QQQ Trust, Series 1 (QQQ) ETF using the Cutler’s RSI(3) indicator:

• Go long at the close if RSI(3) < 10

• Maintain the position while RSI(3) ≤ 40

 filter these returns by adding an additional rule based on the value of IBS:

• Enter or maintain long position only if IBS ≤ 0.5

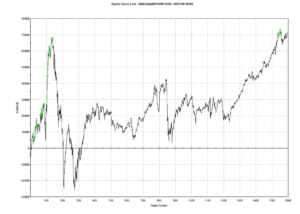
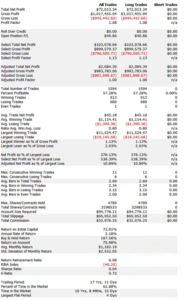
Pangonis claims that the strategy produces rather promising results that “easily beats commissions”;  however, my own rendition of the strategy, assuming commissions of $0.005 per share and slippage of a further $0.02 per share produces results that are distinctly less encouraging:

EC0


Pef0

Strategy Code

For those interested, the code is as follows:

Inputs:
RSILen(3),
RSI_Entry(10),
RSI_Exit(40),
IBS_Threshold(0.5),
Initial_Capital(100000);
Vars:
nShares(100),
RSIval(0),
IBS(0);
RSIval=RSI(C,RSILen);
IBS = (C-L)/(H-L);

nShares = Round(Initial_Capital / Close,0);

If Marketposition = 0 and RSIval > RSI_Entry and IBS < IBS_Threshold then begin
Buy nShares contracts next bar at market;
end;
If Marketposition > 0 and ((RSIval > RSI_Exit) or (IBS_Threshold > IBS_Threshold)) then begin
Sell next bar at market;
end;

Strategy Optimization and Robustness Testing

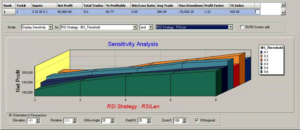
One can further improve performance by optimizing the trading system parameters, using Tradestation’s excellent Walk Forward Optimization (WFO) module.  This allows us to examine the effect of re-calibrating the strategy parameters are regular intervals, testing the optimized model on out-of-sample data sets of various sizes.  WFO can be used, not only optimize a strategy, but also to examine the sensitivity of its performance to changes in the levels of key parameters.  For example, in the case of the QQQ swing trading strategy, we find that profitability increases monotonically with the length of the RSI indicator, and this effect is especially marked when an IBS threshold level of 0.2 is used:

Sensitivity


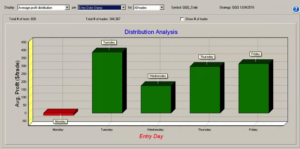
Likewise we can test the consistency of the day-of-the-week effect over several OS data sets of  varying size and these tests are consistent with the pattern seen earlier for the IBS indicator, confirming its role as a filter rule in enhancing system profitability:

Distribution Analysis


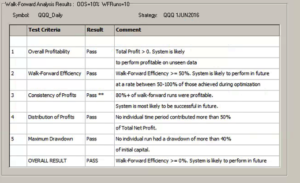
A model that is regularly re-calibrated using WFO is subjected to a series of tests designed to ensure its robustness and consistency in live trading.   The tests include the following:


WFO


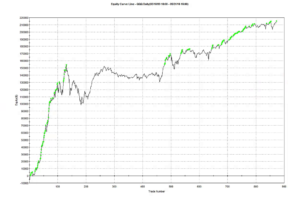
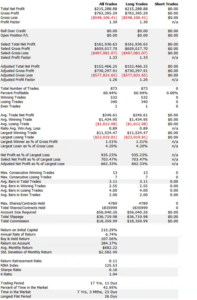
In order to achieve an overall pass rating, the system is required to pass all five tests of its out-of-sample performance, from which Tradestation deems it likely that the system will continue to perform well in live trading.  The results from this procedure appear much more promising than the strategy in its original form, as can be seen from the performance table and equity curve chart shown below.

EC1

Perf1


However, these results include both in-sample and out-of-sample periods.  An examination of the results from the WFO indicate that the overall efficiency of the strategy is around 55%, meaning that the P&L produced by the system in out-of-sample periods amounts to a little over one half of the rate of profit produced during in-sample periods.  Going forward, therefore, we might expect the performance of the system in live trading to be only around half as good as shown here.  While this is still superior to the original system, it may not be considered good enough.  Nonetheless, for the purpose of illustrating the benefits of the IBS indicator as a trade filter, it makes the point.

Another interesting example of an IBS-based trading strategy in the QQQ and SPY ETFs can be found in the following blog post.

Conclusion

Internal Bar Strength is a powerful mean-reversion indicator for equity products traded at daily frequencies, with a consistent effect that has continued from the 1990s through to the current decade. IBS can be used on its own in mean-reversion strategies that have worked well for both US equities and US and International equity index ETFs, or used as a trade filter when combined with other alpha signals.

While there is evidence of a weakening of the IBS effect since around 2013 this is not yet confirmed statistically (at the 99% confidence level) and may simply be the result of normal statistical variation in its efficacy.