Systematic Strategies is Hiring

Systematic Strategies is recruiting for its new London office, opening in the summer.

We will be hiring experienced quantitative researchers, developers and traders who will be engaged in the research and development of medium frequency strategies in equities, derivatives and foreign exchange.  More details will be posted on our web site in due course.

We currently have opportunities for two interns to work in research and trading. Ideal candidates will have an academic background in economics/finance, mathematics, computer science, engineering or physics, together with programming skills in Matlab or Mathematica, and C++ or Python.

We also wish to hire an intern to work in social media marketing.

Candidates must be located in London and have UK/EU citizenship or permanent residence.

Application should send a copy of their resume to: careers@systematic-strategies.com


Beta Convexity

What is a Stock Beta?

Around a quarter of a century ago I wrote a paper entitled “Equity Convexity” which – to my disappointment – was rejected as incomprehensible by the finance professor who reviewed it.  But perhaps I should not have expected more: novel theories are rarely well received first time around.  I remain convinced the idea has merit and may perhaps revisit it in these pages at some point in future.  For now, I would like to discuss a related, but simpler concept: beta convexity.  As far as I am aware this, too, is new.  At least, while I find it unlikely that it has not already been considered, I am not aware of any reference to it in the literature.

SSALGOTRADING AD

We begin by reviewing the elementary concept of an asset beta, which is the covariance of the return of an asset with the return of the benchmark market index, divided by the variance of the return of the benchmark over a certain period:

Beta formula

Asset betas typically exhibit time dependency and there are numerous methods that can be used to model this feature, including, for instance, the Kalman Filter:


http://jonathankinlay.com/2015/02/statistical-arbitrage-using-kalman-filter/

Beta Convexity

In the context discussed here we set such matters to one side.  Instead of considering how an asset beta may vary over time, we look into how it might change depending on the direction of the benchmark index.  To take an example, let’s consider the stock Advaxis, Inc. (Nasdaq: ADXS).  In the charts below we examine the relationship between the daily stock returns and the returns in the benchmark Russell 3000 Index when the latter are positive and negative.


ADXS - Up Beta ADXS - Down Beta


The charts indicate that the stock beta tends to be higher during down periods in the benchmark index than during periods when the benchmark return is positive.  This can happen for two reasons: either the correlation between the asset and the index rises, or the volatility of the asset increases, (or perhaps both) when the overall market declines.  In fact, over the period from Jan 2012 to May 2017, the overall stock beta was 1.31, but the up-beta was only 0.44 while the down-beta was 1.53.  This is quite a marked difference and regardless of whether the change in beta arises from a change in the correlation or in the stock volatility, it could have a significant impact on the optimal weighting for this stock in an equity portfolio.

Ideally, what we would prefer to see is very little dependence in the relationship between the asset beta and the sign of the underlying benchmark.  One way to quantify such dependency is with what I have called Beta Convexity:

Beta Convexity = (Up-Beta – Down-Beta) ^2

A stock with a stable beta, i.e. one for which the difference between the up-beta and down-beta is negligibly small, will have a beta-convexity of zero. One the other hand, a stock that shows instability in its beta relationship with the benchmark will tend to have relatively large beta convexity.


Index Replication using a Minimum Beta-Convexity Portfolio

One way to apply this concept it to use it as a means of stock selection.  Regardless of whether a stock’s overall beta is large or small, ideally we want its dependency to be as close to zero as possible, i.e. with near-zero beta-convexity.  This is likely to produce greater stability in the composition of the optimal portfolio and eliminate unnecessary and undesirable excess volatility in portfolio returns by reducing nonlinearities in the relationship between the portfolio and benchmark returns.

In the following illustration we construct a stock portfolio by choosing the 500 constituents of the benchmark Russell 3000 index that have the lowest beta convexity during the previous 90-day period, rebalancing every quarter (hence all of the results are out-of-sample).  The minimum beta-convexity portfolio outperforms the benchmark by a total of 48.6% over the period from Jan 2012-May 2017, with an annual active return of 5.32% and Information Ratio of 1.36.  The portfolio tracking error is perhaps rather too large at 3.91%, but perhaps can be further reduced with the inclusion of additional stocks.


ResultsTable


Active Monthly


G1000


Active

Conclusion:  Beta Convexity as a New Factor

Beta convexity is a new concept that appears to have a useful role to play in identifying stocks that have stable long term dependency on the benchmark index and constructing index tracking portfolios capable of generating appreciable active returns.

The outperformance of the minimum-convexity portfolio is not the result of a momentum effect, or a systematic bias in the selection of high or low beta stocks.  The selection of the 500 lowest beta-convexity stocks in each period is somewhat arbitrary, but illustrates that the approach can scale to a size sufficient to deploy hundreds of millions of dollars of investment capital, or more.  A more sensible scheme might be, for example, to select a variable number of stocks based on a predefined tolerance limit on beta-convexity.

Obvious steps from here include experimenting with alternative weighting schemes such as value or beta convexity weighting and further refining the stock selection procedure to reduce the portfolio tracking error.

Further useful applications of the concept are likely to be found in the design of equity long/short and  market neural strategies. These I shall leave the reader to explore for now, but I will perhaps return to the topic in a future post.

Futures WealthBuilder

We are launching a new product, the Futures WealthBuilder,  a CTA system that trades futures contracts in several highly liquid financial and commodity markets, including SP500 EMinis, Euros, VIX, Gold, US Bonds, 10-year and five-year notes, Corn, Natural Gas and Crude Oil.  Each  component strategy uses a variety of machine learning algorithms to detect trends, seasonal effects and mean-reversion.  We develop several different types of model for each market, and deploy them according to their suitability for current market conditions.

Performance of the strategy (net of fees) since 2013 is detailed in the charts and tables below.  Notable features include a Sharpe Ratio of just over 2, an annual rate of return of 190% on an account size of $50,000, and a maximum drawdown of around 8% over the last three years.  It is worth mentioning, too, that the strategy produces approximately equal rates of return on both long and short trades, with an overall profit factor above 2.


Fig1


Fig2


Fig3

Fig4


Fig5

Low Correlation

Despite a high level of correlation between several of the underlying markets, the correlation between the component strategies of Futures WealthBuilder are, in the majority of cases, negligibly small (with a few exceptions, such as the high correlation between the 10-year and 5-year note strategies).  This accounts for the relative high level of return in relation to portfolio risk, as measured by the Sharpe Ratio.   We offer strategies in both products chiefly as a mean of providing additional liquidity, rather than for their diversification benefit.

Fig 6

Strategy Robustness

Strategy robustness is a key consideration in the design stage.  We use Monte Carlo simulation to evaluate scenarios not seen in historical price data in order to ensure consistent performance across the widest possible range of market conditions.  Our methodology introduces random fluctuations to historical prices, increasing or decreasing them by as much as 30%.  We allow similar random fluctuations in that value strategy parameters, to ensure that our models perform consistently without being overly-sensitive to the specific parameter values we have specified.  Finally, we allow the start date of each sub-system to vary randomly by up to a year.

The effect of these variations is to produce a wide range of outcomes in terms of strategy performance.  We focus on the 5% worst outcomes, ranked by profitability, and select only those strategies whose performance is acceptable under these adverse scenarios.  In this way we reduce the risk of overfitting the models while providing more realistic expectations of model performance going forward.  This procedure also has the effect of reducing portfolio tail risk, and the maximum peak-to-valley drawdown likely to be produced by the strategy in future.

GC Daily Stress Test

Futures WealthBuilder on Collective 2

We will be running a variant of the Futures WealthBuilder strategy on the Collective 2 site, using a subset of the strategy models in several futures markets(see this page for details).  Subscribers will be able to link and auto-trade the strategy in their own account, assuming they make use of one of the approved brokerages which include Interactive Brokers, MB Trading and several others.

Obviously the performance is unlikely to be as good as the complete strategy, since several component sub-strategies will not be traded on Collective 2.  However, this does give the subscriber the option to trial the strategy in simulation before plunging in with real money.

Fig7


Algorithmic Trading on Collective 2


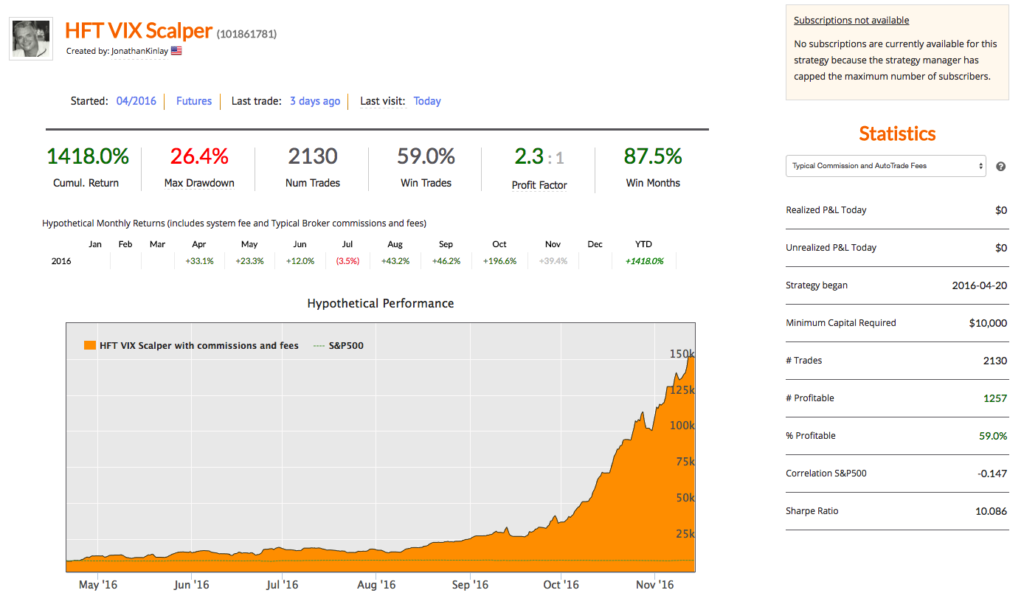
Regular readers will recall my mentioning out VIX Futures scalping strategy which we ran on the Collective2 site for a while:


VIX HFT Scalper


The strategy, while performing very well, proved difficult for subscribers to implement, given the latencies involved in routing orders via the Collective 2 web site.  So we began thinking about slower strategies that investors could follow more easily, placing less reliance on the fill rate for limit orders.

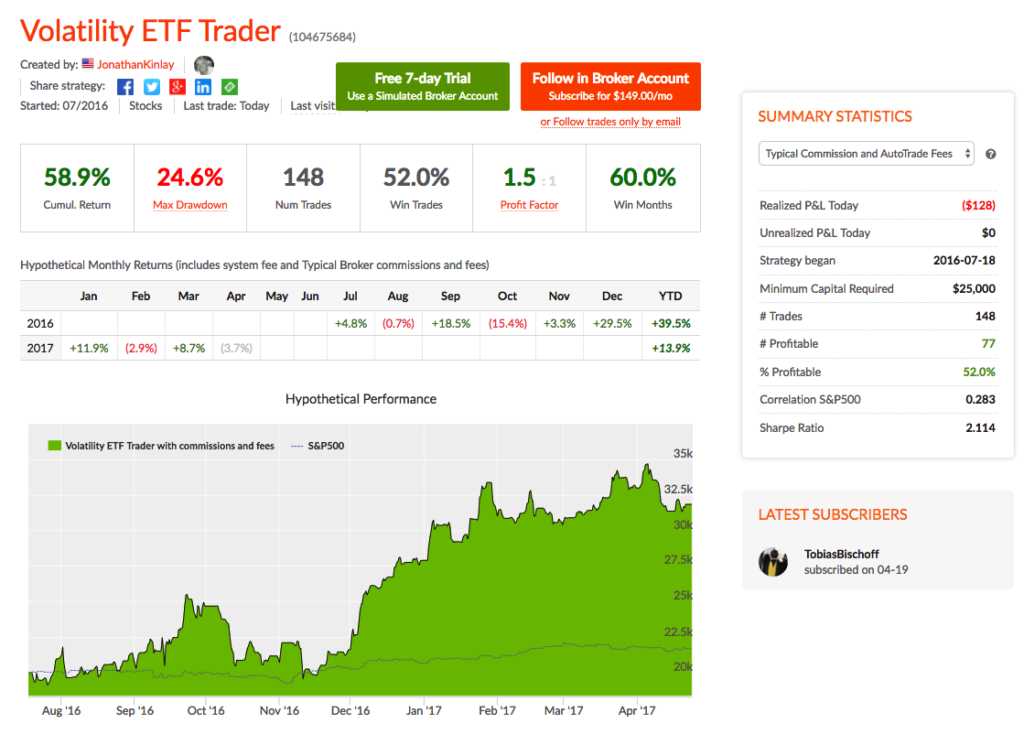
Our VIX ETF Trader strategy has been running on Collective 2 for several months now and is being traded successfully by several subscribers.  The performance so far has been quite good, with net returns of 58.9% from July 2016 and a Sharpe ratio over 2, which is not at all bad for a low frequency strategy.  The strategy enters and exits using a mix of  limit and stop orders, so although some slippage is incurred the trade entries and exits work much more smoothly overall.

Having let the strategy settle for several months trading only the ProShares Short VIX Short-Term Futures ETF (SVXY)we are now ready to ramp things up.  From today the strategy will also trade several other VIX ETF products including the VelocityShares Daily Inverse VIX ST ETN (XIV), ProShares Ultra VIX Short-Term Futures (UVXY) and VelocityShares Daily 2x VIX ST ETN (TVIX).  All of the trades in these products are entered and exited using market or stop orders, and so will be easy for subscribers to follow.  For now we are keeping the required account size pegged at $25,000 although we will review that going forward.  My guess is that a capital allocation should be more than sufficient to trade the product in the kind of size we use on the Collective 2 versions of the strategies, especially if the account uses portfolio margin rather than standard Reg-T.

With the addition of the new products to the portfolio mix, we anticipate the strategy Sharpe ratio with rise to over 3 in the year ahead.


VIX ETF Strategy


The advantage of using a site like Collective 2 from the investor’s viewpoint is that, firstly, you get to see a lot of different trading styles and investment strategies.  You can select the strategies in a wide range of asset classes that fit your own investment preferences and trade several of them live in your own brokerage account.  (Setting up your account for live trading is straightforward, as described on the C2 site).  A major advantage of investing this way is that it doesn’t entail the commitment of capital that is typically required for a hedge fund or managed account investment:  you can trade the strategies in much smaller size, to fit your budget.

From our perspective, we find it a useful way to showcase some of the strategies we trade in our hedge fund, so that if investors want to they can move up to more advanced, but similar investment products.  We plan to launch new strategies on Collective 2 in the near futures , including an equity portfolio strategy and a CTA futures strategy.

If you would like more information, contact us for further details.