Ethical Strategy Design

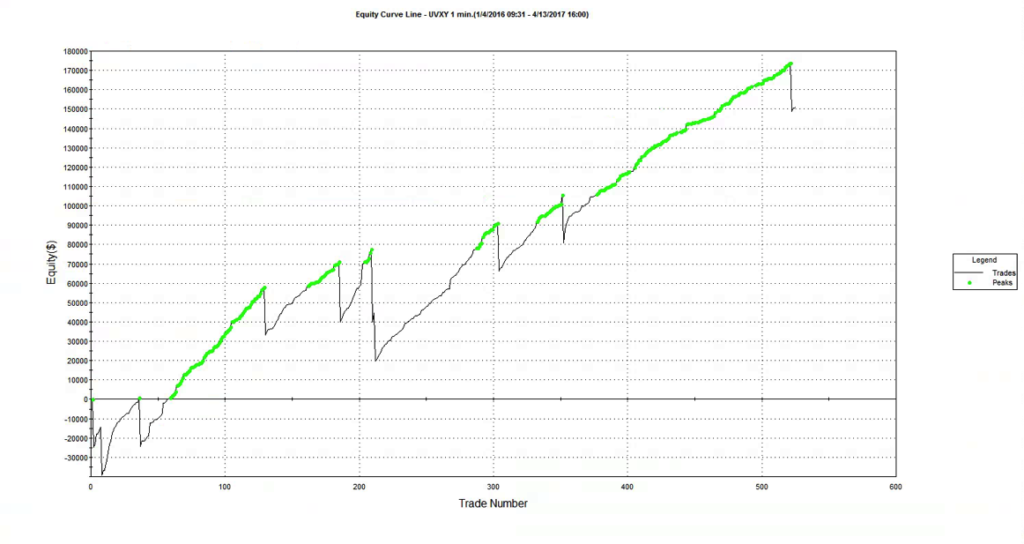
It isn’t often that you see an equity curve like the one shown below, which was produced by a systematic strategy built on 1-minute bars in the ProShares Ultra VIX Short-Term Futures ETF (UVXY):
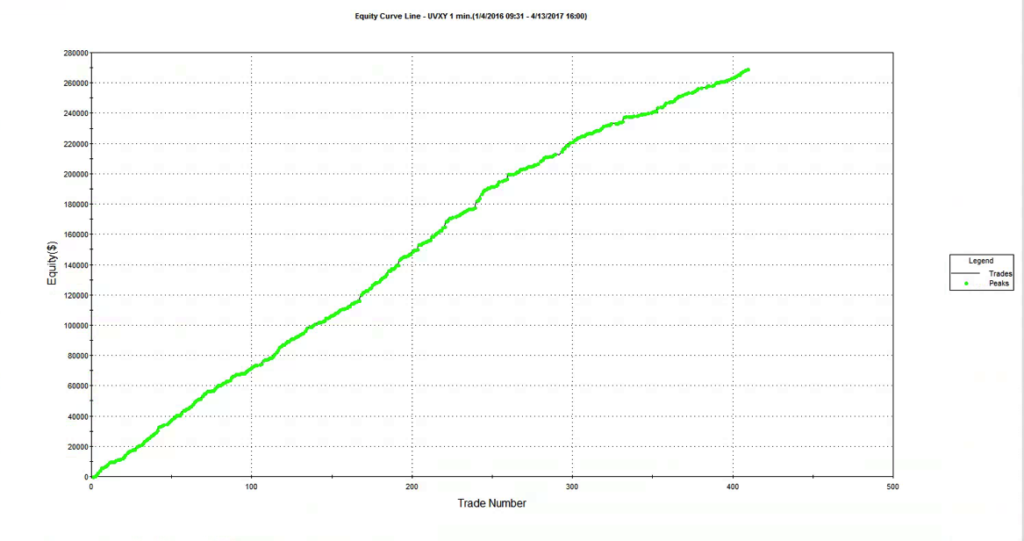
Fig3

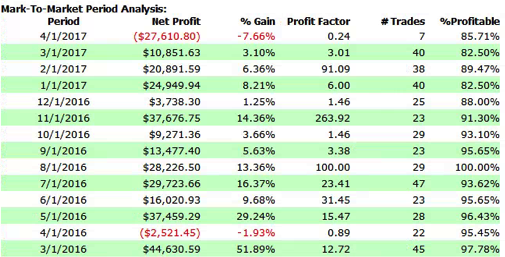
As the chart indicates, the strategy is very profitable, has a very high overall profit factor and a trade win rate in excess of 94%:

Fig4


FIG5


So, what’s not to like?  Well, arguably, one would like to see a strategy with a more balanced P&L, capable of producing profitable trades on the long as well as the short side. That would give some comfort that the strategy will continue to perform well regardless of whether the market tone is bullish or bearish. That said, it is understandable that the negative drift from carry in volatility futures, amplified by the leverage in the leveraged ETF product, makes it is much easier to make money by selling short.  This is  analogous to the long bias in the great majority of equity strategies, which relies on the positive drift in stocks.  My view would be that the short bias in the UVXY strategy is hardly a sufficient reason to overlook its many other very attractive features, any more than long bias is a reason to eschew equity strategies.

SSALGOTRADING AD

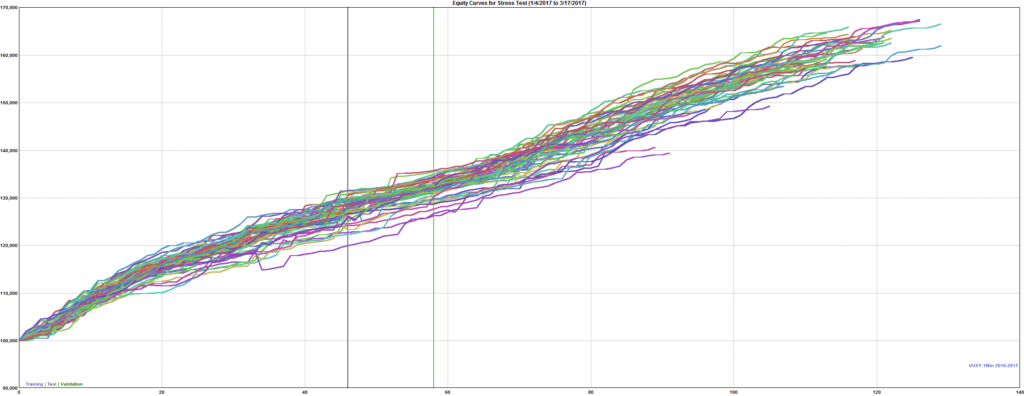
This example is similar to one we use in our training program for proprietary and hedge fund traders, to illustrate some of the pitfalls of strategy development.  We point out that the strategy performance has held up well out of sample – indeed, it matches the in-sample performance characteristics very closely.  When we ask trainees how they could test the strategy further, the suggestion is often made that we use Monte-Carlo simulation to evaluate the performance across a wider range of market scenarios than seen in the historical data.  We do this by introducing random fluctuations into the ETF prices, as well as in the strategy parameters, and by randomizing the start date of the test period.  The results are shown below. As you can see, while there is some variation in the strategy performance, even the worst simulated outcome appears very benign.


Fig2

Around this point trainees, at least those inexperienced in trading system development, tend to run out of ideas about what else could be done to evaluate the strategy.  One or two will mention drawdown risk, but the straight-line equity curve indicates that this has not been a problem for the strategy in the past, while the results of simulation testing suggest that drawdowns are unlikely to be a significant concern, across a broad spectrum of market conditions.  Most trainees simply want to start trading the strategy as soon as possible (although the more cautious of them will suggest trading in simulation mode for a while).

As this point I sometimes offer to let trainees see the strategy code, on condition that they agree to trade the strategy with their own capital.   Being smart people, they realize something must be wrong, even if they are unable to pinpoint what the problem may be.  So the discussion moves on to focus in more detail the question of strategy risk.

A Deeper Dive into Strategy Risk

At this stage I point out to trainees that the equity curve shows the result from realized gains and losses. What it does not show are the fluctuations in equity that occurred before each trade was closed.

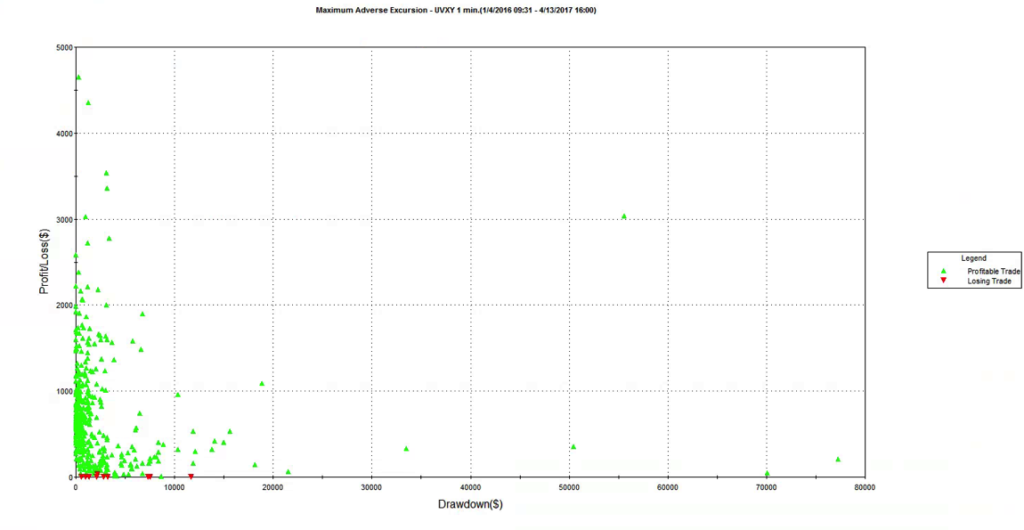
That information is revealed by the following report on the maximum adverse excursion (MAE), which plots the maximum drawdown in each trade vs. the final trade profit or loss.  Once trainees understand the report, the lights begin to come on.  We can see immediately that there were several trades which were underwater to the tune of $30,000, $50,000, or even $70,000 , or more, before eventually recovering to produce a profit.  In the most extreme case the trade was almost $80,000 underwater, before producing a profit of only a few hundred dollars. Furthermore, the drawdown period lasted for several weeks, which represents almost geological time for a strategy operating on 1-minute bars. It’s not hard to grasp the concept that risking $80,000 of your own money in order to make $250 is hardly an efficient use of capital, or an acceptable level of risk-reward.


FIG6 FIG7


FIG8


Next, I ask for suggestions for how to tackle the problem of drawdown risk in the strategy.   Most trainees will suggest implementing a stop-loss strategy, similar to those employed by thousands of  trading firms.  Looking at the MAE chart, it appears that we can avert the worst outcomes with a stop loss limit of, say, $25,000.  However, when we implement a stop loss strategy at this level, here’s the outcome it produces:


FIG9

Now we see the difficulty.  Firstly, what a stop-loss strategy does is simply crystallize the previously unrealized drawdown losses.  Consequently, the equity curve looks a great deal less attractive than it did before.  The second problem is more subtle: the conditions that produced the loss-making trades tend to continue for some time, perhaps as long as several days, or weeks.  So, a strategy that has a stop loss risk overlay will tend to exit the existing position, only to reinstate a similar position more or less immediately.  In other words, a stop loss achieves very little, other than to force the trader to accept losses that the strategy would have made up if it had been allowed to continue.  This outcome is a difficult one to accept, even in the face of the argument that a stop loss serves the purpose of protecting the trader (and his firm) from an even more catastrophic loss.  Because if the strategy tends to re-enter exactly the same position shortly after being stopped out, very little has been gained in terms of catastrophic risk management.

Luck and the Ethics of Strategy Design

What are the learning points from this exercise in trading system development?  Firstly, one should resist being beguiled by stellar-looking equity curves: they may disguise the true risk characteristics of the strategy, which can only be understood by a close study of strategy drawdowns and  trade MAE.  Secondly, a lesson that many risk managers could usefully take away is that a stop loss is often counter-productive, serving only to cement losses that the strategy would otherwise have recovered from.

A more subtle point is that a Geometric Brownian Motion process has a long-term probability of reaching any price level with certainty.  Accordingly, in theory one has only to wait long enough to recover from any loss, no matter how severe.   Of course, in the meantime, the accumulated losses might be enough to decimate the trading account, or even bring down the entire firm (e.g. Barings).  The point is,  it is not hard to design a system with a very seductive-looking backtest performance record.

If the solution is not a stop loss, how do we avoid scenarios like this one?  Firstly, if you are trading someone else’s money, one answer is: be lucky!  If you happened to start trading this strategy some time in 2016, you would probably be collecting a large bonus.  On the other hand, if you were unlucky enough to start trading in early 2017, you might be collecting a pink slip very soon.  Although unethical, when you are gambling with other people’s money, it makes economic sense to take such risks, because the potential upside gain is so much greater than the downside risk (for you). When you are risking with your own capital, however, the calculus is entirely different.  That is why we always trade strategies with our own capital before opening them to external investors (and why we insist that our prop traders do the same).

As a strategy designer, you know better, and should act accordingly.  Investors, who are relying on your skills and knowledge, can all too easily be seduced by the appearance of a strategy’s outstanding performance, overlooking the latent risks it hides.  We see this over and over again in option-selling strategies, which investors continue to pile into despite repeated demonstrations of their capital-destroying potential.  Incidentally, this is not a point about backtest vs. live trading performance:  the strategy illustrated here, as well as many option-selling strategies, are perfectly capable of producing live track records similar to those seen in backtest.  All you need is some luck and an uneventful period in which major drawdowns don’t arise.  At Systematic Strategies, our view is that the strategy designer is under an obligation to shield his investors from such latent risks, even if they may be unaware of them.  If you know that a strategy has such risk characteristics, you should avoid it, and design a better one.  The risk controls, including limitations on unrealized drawdowns (MAE) need to be baked into the strategy design from the outset, not fitted retrospectively (and often counter-productively, as we have seen here).

The acid test is this:  if you would not be prepared to risk your own capital in a strategy, don’t ask your investors to take the risk either.

The ethical principle of “do unto others as you would have them do unto you” applies no less in investment finance than it does in life.

Strategy Code

Code for UVXY Strategy


The New Long/Short Equity

High Frequency Trading Strategies

One of the benefits of high frequency trading strategies lies in their ability to produce risk-adjusted rates of return that are unmatched by anything that the hedge fund or CTA community is capable of producing.  With such performance comes another attractive feature of HFT firms – their ability to make money (almost) every day.  Of course, HFT firms are typically not required to manage billions of dollars, which is just as well given the limited capacity of most HFT strategies.  But, then again, with a Sharpe ratio of 10, who needs outside capital?  This explains why most investors have a difficult time believing the level of performance achievable in the high frequency world – they never come across such performance, because HFT firms generally have little incentive to show their results to external investors.

SSALGOTRADING AD

By and large, HFT strategies remain the province of proprietary trading firms that can afford to make an investment in low-latency trading infrastructure that far exceeds what is typically required for a regular trading or investment management firm.  However, while the highest levels of investment performance lie beyond the reach of most investors and money managers, it is still possible to replicate some of the desirable characteristics of high frequency strategies.

Quantitative Equity Strategy

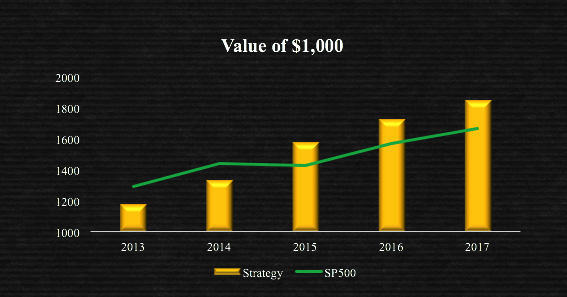
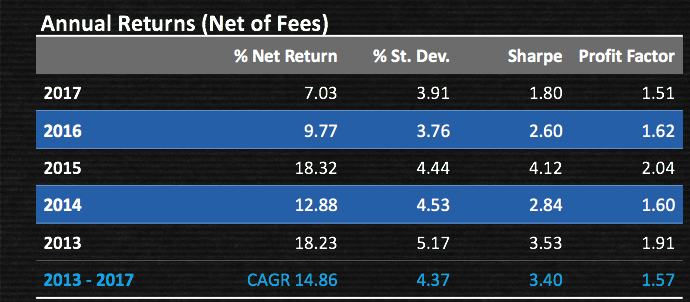
I am going to use an example our Quantitative Equity strategy, which forms part of the Systematic Strategies hedge fund.  The tables and charts below give a broad impression of the performance characteristics of the strategy, which include a CAGR of 14.85% (net of fees) since live trading began in 2013.

Value $1000
The NewEquityLSFig3


This is a strategy that is designed to produce returns on a  par with the S&P 500 index, but with considerably lower risk:  at just over 4%, the annual volatility of the strategy is only around 1/3 that of the index, while the maximum drawdown has been a little over 2% since inception.  This level of portfolio risk is much lower than can typically be achieved in an equity long/short strategy  (equity market neutral is another story, of course). Furthermore, the realized information ratio of 3.4 is in the upper 1%-tile of risk-adjusted performance amongst equity long/short strategies.  So something rather more interesting must be going on that is very different from the typical approach to long/short equity.
TheNewEquityLSFig5


One plausible explanation is that the strategy is exploiting some minor market anomaly that works fine for small amounts of capital, but which cannot be scaled.  But this is not the case here:  the investment universe comprises more than a hundred of the most liquid stocks in US markets, across a broad spectrum of sectors.  And while single-name investment is capped at 10% of average daily volume, this nonetheless provides investment capacity of several hundreds of millions of dollars.

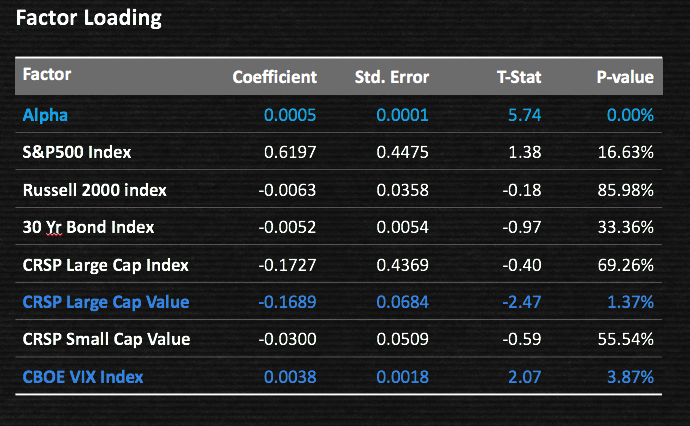
Nor does the reason for the exceptional performance lie in some new portfolio construction technique:  rather, we rely on a straightforward 1/n allocation.  Again, neither is factor exposure the driver of strategy alpha:  as the factor loading table illustrates, strategy performance is largely uncorrelated with most market indices.  It loads significantly on only large cap value, chiefly because the investment universe is defined as comprising the stocks with greatest liquidity (which tend to be large cap value), and on the CBOE VIX index.  The positive correlation with market volatility is a common feature of many types of trading strategy that tend to do better in volatile markets, when short-term investment opportunities are plentiful.

FactorLoadings

While the detail of the strategy must necessarily remain proprietary, I can at least offer some insight that will, I hope, provide food for thought.

We can begin by comparing the returns for two of the stocks in the portfolio, Home Depot and Pfizer.  The charts demonstrate one of important strategy characteristic: not every stock is traded at the same frequency.  Some stocks might be traded once or twice a month; others possibly ten times a day, or more.  In other words, the overall strategy is diversified significantly, not only across assets, but also across investment horizons.  This has a considerable impact on volatility and downside risk in the portfolio.

Home Depot vs. Pfizer Inc.

HD

PFEOverall, the strategy trades an average of 40-60 times a day, or more.   This is, admittedly, towards the low end of the frequency spectrum of HFT strategies – we might describe it as mid-frequency rather than high frequency trading.  Nonetheless,  compared to traditional long/short equity strategies this constitutes a high level of trading activity which, in aggregate, replicates some of the time-diversification benefits of HFT strategies, producing lower strategy volatility.

There is another way in which the strategy mimics, at least partially, the characteristics of a HFT strategy.  The profitability of many (although by no means all) HFT strategies lies in their ability to capture (or, at least, not pay) the bid-offer spread.  That is why latency is so crucial to most HFT strategies – if your aim is to to earn rebates, and/or capture the spread, you must enter and  exit, passively, often using microstructure models to determine when to lean on the bid or offer price.  That in turn depends on achieving a high priority for your orders in the limit order book, which is a function of  latency – you need to be near the top of the queue at all times in order the achieve the required fill rate.

How does that apply here?  While we are not looking to capture the spread, the strategy does seek to avoid taking liquidity and paying the spread.  Where it can do so,  it will offset the bid-offer spread by earning rebates.  In many cases we are able to mitigate the spread cost altogether.  So, while it cannot accomplish what a HFT market-making system can achieve, it can mimic enough of its characteristics – even at low frequency – to produce substantial gains in terms of cost-reduction and return enhancement.  This is important since the transaction volume and portfolio turnover in this approach are significantly greater than for a typical equity long/short strategy.

Portfolio of Strategies vs. Portfolio of Equities

slide06But this feature, while important, is not really the heart of the matter.  Rather, the central point is this:  that the overall strategy is an assembly of individual, independent strategies for each component stock.  And it turns out that the diversification benefit of a portfolio of strategies is generally far greater than for an equal number of stocks, because the equity processes themselves will typically be correlated to a far greater degree than will corresponding trading strategies.  To take the example of the pair of stocks discussed earlier, we find that the correlation between HD and PFE over the period from 2013 to 2017 is around 0.39, based on daily returns.  By comparison, the correlation between the strategies for the two stocks over the same period is only 0.01.

This is generally the case, so that a portfolio of, say, 30 equity strategies, might reasonably be expected to enjoy a level of risk that is perhaps as much as one half that of a portfolio of the underlying stocks, no matter how constructed.  This may be due to diversification in the time dimension, coupled with differences in the alpha generation mechanisms of the underlying strategies – mean reversion vs. momentum, for example

Strategy Robustness Testing

There are, of course, many different aspects to our approach to strategy risk management. Some of these are generally applicable to strategies of all varieties, but there are others that are specific to this particular type of strategy.

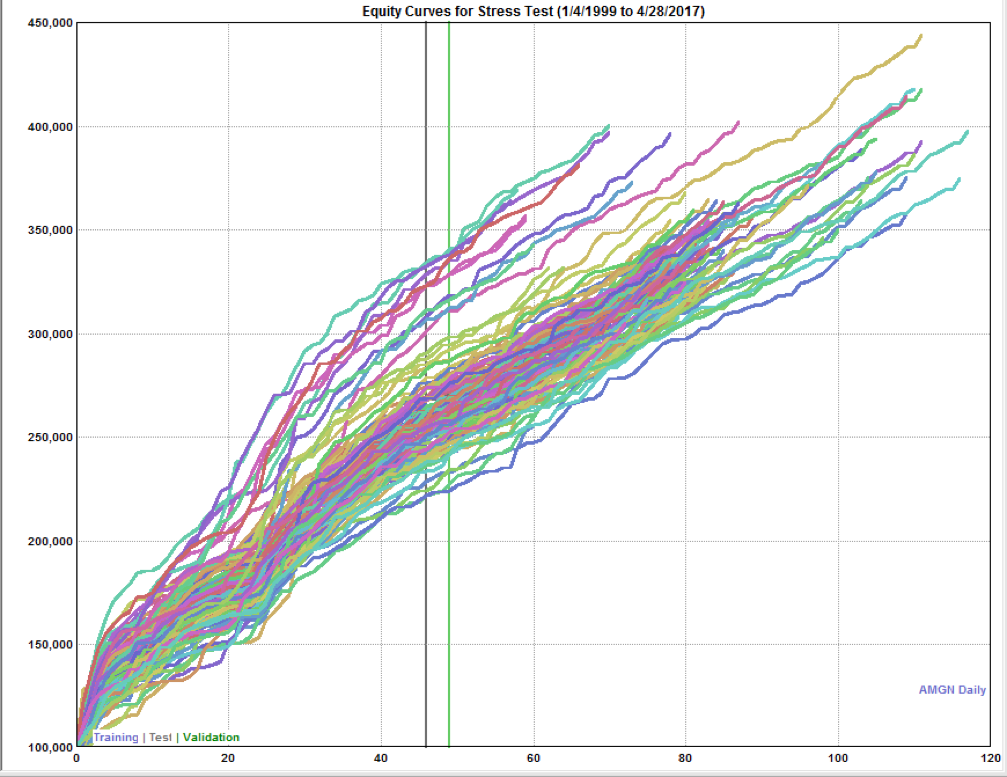
A good example of the latter is how we address the issue of strategy robustness. One of the principal concerns that investors have about quantitive strategies is that they may under-perform during adverse market conditions, or even simply stop working altogether. Our approach is to stress test each of the sub-strategy models using Monte Carlo simulation and examine their performance under a wide range of different scenarios, many of which have never been seen in the historical data used to construct the models.

For instance, we typically allow prices to fluctuate randomly by +/- 30% from historical values. But we also randomize the start date of each strategy by up to a year, which reduces the likelihood of a strategy being selected simply on the strength of a lucky start. Finally, we are interested in ensuring that the performance of each sub-strategy is not overly sensitive to the specific parameter values chosen for each model. Again, we test this using Monte Carlo, assessing the performance of each sub-strategy if the parameter values of the model are varied randomly by up to 30%.

The output of all these simulation tests is compiled into a histogram of performance results, from which we select the worst 5%-tile. Only if the worst outcomes – the 1-in-20 results in the left tail of the performance distribution – meet our performance criteria will the sub-strategy advance to the next stage of evaluation, simulated trading. This gives us – and investors – a level of confidence in the ability of the strategy to continue to perform well regardless of how market conditions evolve over time.

MonteCarlo Stress test


An obvious question to ask at this point is: if this is such a great idea, why don’t more firms use this approach?  The answer is simple: it involves too much research.  In a typical portfolio strategy there is a single investment idea that is applied cross-sectionally to a universe of stocks (factor models, momentum models, etc).  In the strategy portfolio approach, separate strategies must be developed for each stock individually, which takes far more time and effort.  Consequently such strategies must necessarily scale more slowly.

Another downside to the strategy portfolio approach is that it is less able to control the portfolio characteristics.  For instance, the overall portfolio may, on average, have a beta close to zero; but there are likely to be times when a majority of the individual stock strategies align, producing a significantly higher, or lower, beta.  The key here is to ask the question: what matters more – the semblance of risk control, or the actual risk characteristics of the strategy?  In reality, the risk controls of traditional long/short equity strategies often turn out to be more theoretical than real.  Time and again investors have seen strategies that turn out to be downside-correlated with the market, regardless of the purported “market-neutral” characteristics of the portfolio.  I would argue that what matters far more is how the strategy actually performs under conditions of market stress, regardless of how “market neutral” or “sector neutral” it may purport to be.  And while I agree that this is hardly a widely-held view, my argument would be that one cannot expect to achieve above-average performance simply by employing standard approaches at every turn.

Parallels with Fund of Funds Investment

So, is this really a “new approach” to equity long/short? Actually, no.  It is certainly unusual.  But it follows quite closely the model of a proprietary trading firm, or a Fund of Funds. There, as here, the task is to create a combined portfolio of strategies (or managers), rather than by investing directly in the underlying assets.  A Fund of Funds will seek to create a portfolio of strategies that have low correlations to one another, and may operate a meta-strategy for allocating capital to the component strategies, or managers.  But the overall investment portfolio cannot be as easily constrained as an individual equity portfolio can be – greater leeway must be allowed for the beta, or the dollar imbalance in the longs and shorts, to vary from time to time, even if over the long term the fluctuations average out.  With human managers one always has to be concerned about the risk of “style drift” – i.e. when managers move away from their stated investment mandate, methodologies or objectives, resulting in a different investment outcomes.  This can result in changes in the correlation between a strategy and its peers, or with the overall market.  Quantitative strategies are necessarily more consistent in their investment approach – machines generally don’t alter their own source code – making a drift in style less likely.  So an argument can be made that the risk inherent in this form of equity long/short strategy is on a par with – certainly not greater than – that of a typical fund of funds.

Conclusions

An investment approach that seeks to create a portfolio of strategies, rather than of underlying assets, offers a significant advantage in terms of risk reduction and diversification, due to the relatively low levels of correlation between the component strategies.   The trading costs associated with higher frequency trading can be mitigated using passive entry/exit rules designed to avoid taking liquidity and generating exchange rebates.  The downside is that it is much harder to manage the risk attributes of the portfolio, such as the portfolio beta, sector risk, or even the overall net long/short exposure.  But these are indicators of strategy risk, rather than actual risk itself and they often fail to predict the actual risk characteristics of the strategy, especially during conditions of market stress.  Investors may be better served by an approach to long/short equity that seeks to maximize diversification on the temporal axis as well as in terms of the factors driving strategy alpha.


Disclaimer: past performance does not guarantee future results. You should not rely on any past performance as a guarantee of future investment performance. Investment returns will fluctuate. Investment monies are at risk and you may suffer losses on any investment.

Pairs Trading with Copulas

Introduction

In a previous post, Copulas in Risk Management, I covered in detail the theory and applications of copulas in the area of risk management, pointing out the potential benefits of the approach and how it could be used to improve estimates of Value-at-Risk by incorporating important empirical features of asset processes, such as asymmetric correlation and heavy tails.

In this post I will take a very different tack, demonstrating how copula models have potential applications in trading strategy design, in particular in pairs trading and statistical arbitrage strategies.

SSALGOTRADING AD

This is not a new concept – in fact the idea occurred to me (and others) many years ago, when copulas began to be widely adopted in financial engineering, risk management and credit derivatives modeling. But it remains relatively under-explored compared to more traditional techniques in this field. Fresh research suggests that it may be a useful adjunct to the more common methods applied in pairs trading, and may even be a more robust methodology altogether, as we shall see.

Recommended Background Reading

http://jonathankinlay.com/2017/01/copulas-risk-management/

http://jonathankinlay.com/2015/02/statistical-arbitrage-using-kalman-filter/

http://jonathankinlay.com/2015/02/developing-statistical-arbitrage-strategies-using-cointegration/


Pairs Trading with Copulas

Modeling Asset Processes

Introduction

Over the last twenty five years significant advances have been made in the theory of asset processes and there now exist a variety of mathematical models, many of them computationally tractable, that provide a reasonable representation of their defining characteristics.

SSALGOTRADING AD

While the Geometric Brownian Motion model remains a staple of stochastic calculus theory, it is no longer the only game in town.  Other models, many more sophisticated, have been developed to address the shortcomings in the original.  There now exist models that provide a good explanation of some of the key characteristics of asset processes that lie beyond the scope of models couched in a simple Gaussian framework. Features such as mean reversion, long memory, stochastic volatility,  jumps and heavy tails are now readily handled by these more advanced tools.

In this post I review a critical selection of asset process models that belong in every financial engineer’s toolbox, point out their key features and limitations and give examples of some of their applications.


Modeling Asset Processes

Conditional Value at Risk Models

One of the most widely used risk measures is the Value-at-Risk, defined as the expected loss on a portfolio at a specified confidence level. In other words, VaR is a percentile of a loss distribution.
But despite its popularity VaR suffers from well-known limitations: its tendency to underestimate the risk in the (left) tail of the loss distribution and its failure to capture the dynamics of correlation between portfolio components or nonlinearities in the risk characteristics of the underlying assets.

SSALGOTRADING AD

One method of seeking to address these shortcomings is discussed in a previous post Copulas in Risk Management. Another approach known as Conditional Value at Risk (CVaR), which seeks to focus on tail risk, is the subject of this post.  We look at how to estimate Conditional Value at Risk in both Gaussian and non-Gaussian frameworks, incorporating loss distributions with heavy tails and show how to apply the concept in the context of nonlinear time series models such as GARCH.


Var, CVaR and Heavy Tails