Statistical Arbitrage Using the Kalman Filter

One of the challenges with the cointegration approach to statistical arbitrage which I discussed in my previous post, is that cointegration relationships are seldom static: they change quite frequently and often break down completely.  Back in 2009 I began experimenting with a more dynamic approach to pairs trading, based on the Kalman Filter.


In its simplest form, we  model the relationship between a pair of securities in the following way:

beta(t) = beta(t-1) + w     beta(t), the unobserved state variable, that follows a random walk

Y(t) = beta(t)X(t) + v      The observed processes of stock prices Y(t) and X(t)

where:

w ~ N(0,Q) meaning w is gaussian noise with zero mean and variance Q

v ~ N(0,R) meaning v is gaussian noise with variance R

So this is just like the usual pairs relationship Y = beta * X + v, where the typical approach is to estimate beta using least squares regression, or some kind of rolling regression (to try to take account of the fact that beta may change over time).  In this traditional framework, beta is static, or slowly changing.

In the Kalman framework, beta is itself a random process that evolves continuously over time, as a random walk.  Because it is random and contaminated by noise we cannot observe beta directly, but must infer its (changing) value from the observable stock prices X and Y. (Note: in what follows I shall use X and Y to refer to stock prices.  But you could also use log prices, or returns).

Unknown to me at that time,  several other researchers were thinking along the same lines and later published their research.  One such example is Statistical Arbitrage and High-Frequency Data with an Application to Eurostoxx 50 Equities,  Rudy, Dunis, Giorgioni and Laws, 2010.  Another closely related study is  Performance Analysis of Pairs Trading Strategy Utilizing High Frequency Data with an Application to KOSPI 100 Equities, Kim, 2011.  Both research studies follow a very similar path, rejecting beta estimation using rolling regression or exponential smoothing in favor of the Kalman approach and applying a Ornstein-Uhlenbeck model to estimate the half-life of mean reversion of the pairs portfolios.  The studies report very high out-of-sample information ratios that in some cases exceed 3.

I have already made the point that such unusually high performance is typically the result of ignoring the fact that the net PnL per share may lie within the region of the average bid-offer spread, making implementation highly problematic.  In this post I want to dwell on another critical issue that is particular to the Kalman approach: the signal:noise ratio, Q/R, which expresses the ratio of the variance of the beta process to that of the price process.  (Curiously, both papers make the same mistake of labelling Q and R as standard deviations. In fact, they are variances).

Beta, being a random process, obviously contains some noise:  but the hope is that it is less noisy than the price process.  The idea is that the relationship between two stocks is more stable – less volatile – than the stock processes themselves.  On its face, that assumption appears reasonable, from an empirical standpoint.  The question is:  how stable is the beta process, relative to the price process? If the variance in the beta process is  low relative to the price process,  we can determine beta quite accurately over time and so obtain accurate estimates of the true price Y(t), based on X(t).  Then, if we observe a big enough departure in the quoted price Y(t) from the true price at time t, we have a potential trade.

In other words, we are interested in:

alpha(t) = Y(t) – Y*(t) = Y(t) – beta(t) X(t)

where Y(t) and X(t) are the observed stock prices and beta(t) is the estimated value of beta at time t.

As usual, we would standardize the alpha using an estimate of the alpha standard deviation, which is sqrt(R).  (Alternatively, you can estimate the standard deviation of the alpha directly, using a lookback period based on the alpha half-life).

If the standardized alpha is large enough, the model suggests that the price Y(t) is quoted significantly in excess of the true value.  Hence we would short stock Y and buy stock X.  (In this context, where X and Y represent raw prices, you would hold an equal and opposite number of shares in Y and X.  If X and Y represented returns, you would hold equal and opposite market value in each stock).

The success of such a strategy depends critically on the quality of our estimates of alpha, which in turn rest on the accuracy of our estimates of beta. This depends on the noisiness of the beta process, i.e. its variance, Q.  If the beta process is very noisy, i.e. if Q is large, our estimates of alpha are going to be too noisy to be useful as the basis for a reversion strategy.

So, the key question I want to address in this post is: in order for the Kalman approach to be effective in modeling a pairs relationship, what would be an acceptable range for the beta process variance Q ?  (It is often said that what matters in the Kalman framework is not the variance Q, per se, but rather the signal:noise ratio Q/R.  It turns out that this is not strictly true, as we shall see).

To get a handle on the problem, I have taken the following approach:

(i) Simulate a stock process X(t) as a geometric brownian motion process with specified drift and volatility (I used 0%,  5% and 10% for the annual drift, and 10%,  30% and 60% for the corresponding annual volatility).

(ii) simulate a beta(t) process as a random walk with variance Q in the range from 1E-10 to 1E-1.

(iii) Generate the true price process Y(t) = beta(t)* X(t)

(iv) Simulate an observed price process Yobs(t), by adding random noise with variance R to Y(t), with R in the range 1E-6 to 1.0

(v) Calculate the true, known alpha(t) = Y(t) – Yobs(t)

(vi) Fit the Kalman Filter model to the simulated processes and estimate beta(t)  and Yest(t). Hence produce estimates kfalpha(t)  = Yobs(t) – Yest(t) and compare these with the known, true alpha(t).

The charts in Fig. 1 below illustrate the procedure for a stock process X(t) with annual drift of 10%, annual volatility 40%, beta process variance Q of 8.65E-9 and price process variance R of 5.62E-2 (Q/R ratio of 1.54E-7).

Fig 1

Fig. 1 True and Estimated Beta and Alpha Using the Kalman Filter

As you can see, the Kalman Filter does  a very good job of updating its beta estimate to track the underlying, true beta (which, in this experiment, is known). As the noise ratio Q/R is small, the Kalman Filter estimates of the process alpha, kfalpha(t), correspond closely to the true alpha(t), which again are known to us in this experimental setting.  You can examine the relationship between the true alpha(t) and the Kalman Filter estimates kfalpha(t) is the chart in the upmost left quadrant of the figure.  The correlation between the two is around 89%.  With a level of accuracy this good for our alpha estimates, the pair of simulated stocks would make an ideal candidate for a pairs trading strategy.

Of course, the outcome is highly dependent on the values we assume for Q and R (and also to some degree on the assumptions made about the drift and volatility of the price process X(t)).

The next stage of the analysis is therefore to generate a large number of simulated price and beta observations and examine the impact of different levels of Q and R, the variances of the beta and price process.  The results are summarized in the table in Fig 2 below.

Fig 2

 Fig 2. Correlation between true alpha(t) and kfalpha(t) for values of Q and R

As anticipated, the correlation between the true alpha(t) and the estimates produced by the Kalman Filter is very high when the signal:noise ratio is small, i.e. of the order of 1E-6, or less.  Average correlations begin to tail off very quickly when Q/R exceeds this level, falling to as low as 30% when the noise ratio exceeds 1E-3.  With a Q/R ratio of 1E-2 or higher, the alpha estimates become too noisy to be useful.

I find it rather fortuitous, even implausible, that in their study Rudy, et al, feel able to assume a noise ratio of 3E-7 for all of the stock pairs in their study, which just happens to be in the sweet spot for alpha estimation.  From my own research, a much larger value in the region of 1E-3 to 1E-5 is  more typical. Furthermore, the noise ratio varies significantly from pair to pair, and over time.  Indeed, I would go so far as to recommend applying a noise ratio filter to the strategy, meaning that trading signals are ignored when the noise ratio exceeds some specified level.

The take-away is this:  the Kalman Filter approach can be applied very successfully in developing statistical arbitrage strategies, but only for processes where the noise ratio is not too large.  One suggestion is to use a filter rule to supress trade signals generated at times when the noise ratio is too large, and/or to increase allocations to pairs in which the noise ratio is relatively low.


Developing Statistical Arbitrage Strategies Using Cointegration

In his latest book (Algorithmic Trading: Winning Strategies and their Rationale, Wiley, 2013) Ernie Chan does an excellent job of setting out the procedures for developing statistical arbitrage strategies using cointegration.  In such mean-reverting strategies, long positions are taken in under-performing stocks and short positions in stocks that have recently outperformed.

I will leave a detailed description of the procedure to Ernie (see pp 47 – 60), which in essence involves:

(i) estimating a cointegrating relationship between two or more stocks, using the Johansen procedure

(ii) computing the half-life of mean reversion of the cointegrated process, based on an Ornstein-Uhlenbeck  representation, using this as a basis for deciding the amount of recent historical data to be used for estimation in (iii)

(iii) Taking a position proportionate to the Z-score of the market value of the cointegrated portfolio (subtracting the recent mean and dividing by the recent standard deviation, where “recent” is defined with reference to the half-life of mean reversion)

Countless researchers have followed this well worn track, many of them reporting excellent results.  In this post I would like to discuss a few of many considerations  in the procedure and variations in its implementation.  We will follow Ernie’s example, using daily data for the EWF-EWG-ITG triplet of ETFs from April 2006 – April 2012. The analysis runs as follows (I am using an adapted version of the Matlab code provided with Ernie’s book):

Johansen test We reject the null hypothesis of fewer then three cointegrating relationships at the 95% level. The eigenvalues and eigenvectors are as follows:

Eigenvalues The eignevectors are sorted by the size of their eigenvalues, so we pick the first of them, which is expected to have the shortest half-life of mean reversion, and create a portfolio based on the eigenvector weights (-1.046, 0.76, 0.2233).  From there, it requires a simple linear regression to estimate the half-life of mean reversion:

Halflife From which we estimate the half-life of mean reversion to be 23 days.  This estimate gets used during the final, stage 3, of the process, when we choose a look-back period for estimating the running mean and standard deviation of the cointegrated portfolio.  The position in each stock (numUnits) is sized according to the standardized deviation from the mean (i.e. the greater the deviation the larger the allocation). Apply Ci The results appear very promising, with an annual APR of 12.6% and Sharpe ratio of 1.4:   Returns EWA-EWC-IGE

Ernie is at pains to point out that, in this and other examples in the book, he pays no attention to transaction costs, nor to the out-of-sample performance of the strategies he evaluates, which is fair enough.

The great majority of the academic studies that examine the cointegration approach to statistical arbitrage for a variety of investment universes do take account of transaction costs.  For the most part such studies report very impressive returns and Sharpe ratios that frequently exceed 3.  Furthermore, unlike Ernie’s example which is entirely in-sample, these studies typically report consistent out-of-sample performance results also.

But the single, most common failing of such studies is that they fail to consider the per share performance of the strategy.  If the net P&L per share is less than the average bid-offer spread of the securities in the investment portfolio, the theoretical performance of the strategy is unlikely to survive the transition to implementation.  It is not at all hard to achieve a theoretical Sharpe ratio of 3 or higher, if you are prepared to ignore the fact that the net P&L per share is lower than the average bid-offer spread.  In practice, however, any such profits are likely to be whittled away to zero in trading frictions – the costs incurred in entering, adjusting and exiting positions across multiple symbols in the portfolio.

Put another way, you would want to see a P&L per share of at least 1c, after transaction costs, before contemplating implementation of the strategy.  In the case of the EWA-EWC-IGC portfolio the P&L per share is around 3.5 cents.  Even after allowing, say, commissions of 0.5 cents per share and a bid-offer spread of 1c per share on both entry and exit, there remains a profit of around 2 cents per share – more than enough to meet this threshold test.

Let’s address the second concern regarding out-of-sample testing.   We’ll introduce a parameter to allow us to select the number of in-sample days, re-estimate the model parameters using only the in-sample data, and test the performance out of sample.  With a in-sample size of 1,000 days, for instance, we find that we can no longer reject the null hypothesis of fewer than 3 cointegrating relationships and the weights for the best linear portfolio differ significantly from those estimated using the entire data set.

Johansen 2

Repeating the regression analysis using the eigenvector weights of the maximum eigenvalue vector (-1.4308, 0.6558, 0.5806), we now estimate the half-life to be only 14 days.  The out-of-sample APR of the strategy over the remaining 500 days drops to around 5.15%, with a considerably less impressive Sharpe ratio of only 1.09.

osPerfOut-of-sample cumulative returns

One way to improve the strategy performance is to relax the assumption of strict proportionality between the portfolio holdings and the standardized deviation in the market value of the cointegrated portfolio.  Instead, we now require  the standardized deviation of the portfolio market value to exceed some chosen threshold level before we open a position (and we close any open positions when the deviation falls below the threshold).  If we choose a threshold level of 1, (i.e. we require the market value of the portfolio to deviate 1 standard deviation from its mean before opening a position), the out-of-sample performance improves considerably:

osPerf 2

The out-of-sample APR is now over 7%, with a Sharpe ratio of 1.45.

The strict proportionality requirement, while logical,  is rather unusual:  in practice, it is much more common to apply a threshold, as I have done here.  This addresses the need to ensure an adequate P&L per share, which will typically increase with higher thresholds.  A countervailing concern, however, is that as the threshold is increased the number of trades will decline, making the results less reliable statistically.  Balancing the two considerations, a threshold of around 1-2 standard deviations is a popular and sensible choice.

Of course, introducing thresholds opens up a new set of possibilities:  just because you decide to enter based on a 2x SD trigger level doesn’t mean that you have to exit a position at the same level.  You might consider the outcome of entering at 2x SD, while exiting at 1x SD, 0x SD, or even -2x SD.  The possible nuances are endless.

Unfortunately, the inconsistency in the estimates of the cointegrating relationships over different data samples is very common.  In fact, from my own research, it is often the case that cointegrating relationships break down entirely out-of-sample, just as do correlations.  A recent study by Matthew Clegg of over 860,000 pairs confirms this finding (On the Persistence of Cointegration in Pais Trading, 2014) that cointegration is not a persistent property.

I shall examine one approach to  addressing the shortcomings  of the cointegration methodology  in a future post.


Matlab code (adapted from Ernie Chan’s book):

Continue reading “Developing Statistical Arbitrage Strategies Using Cointegration”

The Correlation Signal

The use of correlations is widespread in investment management theory and practice, from the construction of portfolios to the design of hedge trades to statistical arbitrage strategies.

A common difficulty encountered in all of these applications is the variation in correlation: assets that at one time appear to be suitably uncorrelated for hedging purposes, may become much more highly correlated at other times, such as periods of market stress. Conversely, stocks that appear suitable for pairs trading due to the high correlation in their prices or returns, may de-couple at a later time, causing significant losses.

The instability in the level of correlation is further aggravated by the empirical finding that the volatility in correlation is itself time-dependent:  at times the correlations between assets may appear to fluctuate smoothly within a tight range; at other times we might see several fluctuations in the sign of the correlation  coefficient over the course of a few days.

One tool I have found useful in this context is a concept I refer to as the correlation signal, defined at the average correlation divided by the standard deviation of the correlation coefficient.  The chart below illustrates a typical pattern for a pair of Oil and Gas industry stocks.  The blue line is the average daily correlation between the stocks, measured at 5-minute intervals.  The red line is the correlation signal – the average daily correlation divided by the standard deviation in the intra-day correlation.  The stochastic nature of both the correlation coefficient and the correlation signal is quite evident.  Note that the correlation signal, unlike the coefficient, is not constrained within the limits of +/- 1.  At times when the variation in correlation is low the signal an easily exceed those limits by as much as an order of magnitude.

CorrSig Plot

In later posts I will illustrate the usefulness of the correlation signal in portfolio construction and statistical arbitrage.  For now, let me just say that it is a measure of the strength of the correlation as a signal, relative to the noise of random variation in the correlation process.   It can be used to identify situations in which a relationship – whether a positive or negative correlation – appears to be stable or unstable, and therefore viable as a basis for inference, or not.


Crash-Protecting Your Portfolio With CrashMetrics

In a post on LinkedIn I referred to the concept of CrashMetrics and how it can be used for portfolio protection.  It’s a simple approach to the management of extreme risk that works rather well.  It can be summarized as “CAPM for crashes”.  Here’s how it works.

Let’s take Proctor and Gamble as our example stock.  We’ll use daily data from 1970-2014 for the stock and for the S&P 500 Index, as follows:

DateListPlot[PG=TimeSeries[FinancialData[“PG”,{{1970,1,2},{2014,12,31}}]],Filling->Axis]

PG 1970-2014


DateListPlot[SP500=TimeSeries[FinancialData[“^GSPC”,{{1970,1,2},{2014,12,31}}]],Filling->Axis]

SP500 Index 1970-2014


We are also going to need an estimate of the risk free rate of return.  We’ll use a 30-day T-Bill rate:

DateListPlot[TBill=TimeSeries[FinancialData[“^IRX”,{{1970,1,2},{2014,12,31}}]],Filling->Axis]

TBill 1970-2014

CAPM Beta Estimation

Next we convert the annual Bill yields into estimates of the continuously compounded daily return and subtract these from the gross returns for PG and the S&P 500 Index, to create series of excess returns for the stock and the index.

 SP500Dates=SP500[“Times”]
PGReturns=Log[PG[Drop[SP500Dates,1]]]-Log[PG[Drop[SP500Dates,-1]]];
SP500Returns=Log[Drop[SP500[“Values”],1]]-Log[Drop[SP500[“Values”],-1]];
TBillDailyRate=Log[TBill[Drop[SP500Dates,1]]]/250 /. Indeterminate->0;
Histogram[PGXReturns=PGReturns-TBillDailyRate,{-0.05,0.05,0.001}]

PG Excess Returns Hist

Excess Returns PG 1970-2014

SP500 Index Excess Returns Hist

Excess Returns S&P 500 Index 1970-2014

We are now ready to estimate the stock beta for PG, using a simple linear regression model of the excess returns in the stock vs. the excess returns in the S&P 500 Index:

 dataset=Partition[Riffle[SP500XReturns,PGXReturns],2
CAPM = LinearModelFit[dataset,x,x]

CAPM Model

From which we estimate the  beta for PG to be around 0.78 (the slope of the regression line in the scatterplot below).  That seems plausible for a large, diversified consumer goods manufacturer, which is likely to be less volatile than the broad index during normal market conditions.

 Show[ListPlot[dataset],Plot[CAPM[x],{x,-0.05,0.05},PlotStyle->Red]]

CAPM Scatterplot

The CAPM regression shows that around 40% of the variation in excess returns in PG is explained by movements in the broad market (the remainder is due to stock-specific risk factors):

 CAPM[“AdjustedRSquared”] = 0.40

That’s a typically scenario with the CAPM model, which is based on some fairly simple, but rather heroic assumptions that we need not delve too deeply into here.

CrashMetrics Approach

In CrashMetrics we focus exclusively in the left tail of the distribution.  For the S&P 500 index the average excess return is very close to zero, while the daily standard deviation of returns is just over 1.5%.  So let’s focus on down-moves that are, say, at least 3xSD, or larger.  We create a reduced data set comprising days on which the index declined by at least 4.5%, and repeat the regression procedure using just those 54 days:

 Dimensions[reducedDataset=Select[dataset,#[[1]] < -0.045&]{54,2}

 CrashM = LinearModelFit[reducedDataset,x,x]

CrashM Model

 Show[ListPlot[reducedDataset],Plot[CrashM[x],{x,0, -0.25},PlotStyle->Red]]

CrashM Scatterplot

Two points are especially noteworthy.

The first is that the beta for PG during major market down-moves is a lot higher than during normal markets (around 1.34 vs 0.78) and being greater than 1, indicates that during adverse conditions PG tends to exacerbate the down-turn in the broad market.

The second is that the regression R-squared is much higher (0.68) for the CrashMetrics regression model, reflecting the tendency of stocks to correlate more closely with the market index during major sell-offs. In that sense, the “crash-beta” estimate is a more reliable estimate than the regular CAPM beta.

How to Use CrashMetrics

How is this technique helpful to the portfolio manager?

To begin, you might want to estimate crash-betas for all of the stocks in your portfolio and for the portfolio as a whole, to give you a handle on how the portfolio is likely to behave under extreme stress.

You could then choose to make adjustments to the portfolio composition to reduce its crash exposure.  This can be done by reducing the allocations to high crash-beta stocks in favor of low crash-beta stocks.  Alternatively, you can buy tail protection using out-of-the-money put options in high-crash beta stocks.  What’s interesting about this technique is that you might end up paying less for crash-protection than you might think.

Taking our PG test case as an example, this is typically seen as a less risky stock and its options are priced accordingly.  Consequently, the Gamma in the options looks cheap when considering how the stock behaves during market crashes.  Conversely, options in very volatile stocks (AAPL springs  to mind, for example), are likely to be relatively highly priced, but may offer less protection during a crash scenario, depending on the behavior of the stock during major market declines.


Just in Time: Programming Grows Up – JonathanKinlay.com

Move over C++: Modern Programming Languages Combine Productivity and Efficiency

Like many in the field of quantitative research, I have programmed in several different languages over the years: Assembler, Fortran, Algol, Pascal, APL, VB, C, C++, C#, Matlab, R, Mathematica.  There is an even longer list of languages I have never bothered with:  Cobol, Java, Python, to name but three.

In general, the differences between many of these are much fewer than their similarities:  they reserve memory; they have operators; they loop.  Several have ghastly syntax requiring random punctuation that supposedly makes the code more intelligible, but in practice does precisely the opposite.  Some, like Objective C, are so ugly and poorly designed they should have been strangled at birth.  The ubiquity of C is due, not to its elegance, but to the fact that it was one of the first languages distributed for free to impecunious students.  The greatest benefit of most languages is that they compile to machine code that executes quickly.  But the task of coding in them is often an unpleasant, inefficient process that typically involves reinvention of the wheel multiple times over and massive amounts of tedious debugging.   Who, after all, doesn’t enjoy unintelligible error messages like “parsec error in dynamic memory heap allocator” – when the alternative, comprehensible version would be so prosaic:  “in line 51 you missed one of those curly brackets we insist on for no good reason”.

There have been relatively few steps forward that actually have had any real significance.  Most times, the software industry operates rather like the motor industry:  while the consumer pines for, say, a new kind of motor that will do 1,000 miles to the gallon without looking like an electric golf cart, manufacturers announce, to enormous fanfare, trivia like heated wing mirrors.

SSALGOTRADING AD

The first language I came across that seemed like a material advance was APL, a matrix-based language that offers lots of built-in functionality, very much like MatLab.  Achieving useful end-results in a matter of days or weeks, rather than months, remains one of the great benefits of such high-level languages. Unfortunately, like all high-level languages that are weakly typed, APL, MatLab, R, etc, are interpreted rather than compiled. And so I learned about the perennial trade-off that has plagued systems development over the last 30 years: programming productivity vs. execution efficiency.  The great divide between high level, interpreted languages and lower-level, compiled languages, would remain forever, programming language experts assured us, because of the lack of type-specificity in the former.

High-level language designers did what they could, offering ever-larger collections of sophisticated, built-in operators and libraries that use efficient machine-code instructions, as well as features such as parallel processing, to speed up execution.  But, while it is now feasible to develop smaller applications in a few lines of  Matlab or Mathematica that have perfectly acceptable performance characteristics, major applications (trading platforms, for example) seemed ordained to languish forever in the province of languages whose chief characteristic appears to be the lack of intelligibility of their syntax.

I was always suspicious of this thesis.  It seemed to me that it should not be beyond the wit of man to design a programming language that offers straightforward, type-agnostic syntax that can be compiled.  And lo:  this now appears to have come true.

Of the multitude of examples that will no doubt be offered up over the next several years I want to mention two – not because I believe them to be the “final word” on this important topic, but simply as exemplars of what is now possible, as well as harbingers of what is to come.

Trading Technologies ADL 

ADL

The first, Trading Technologies’ ADL, I have written about at length already.  In essence, ADL is a visual programming language focused on trading system development.  ADL allows the programmer to deploy highly-efficient, pre-built code blocks as icons that are dragged and dropped onto a programming canvass and assembled together using logic connections represented by lines drawn on the canvass.  From my experience, ADL outpaces any other high-level development tool by at least an order of magnitude, but without sacrificing (much) efficiency in execution, firstly because the code blocks are written in native C#, and secondly, because completed systems are deployed on an algo server with a sub-millisecond connectivity to the exchange.


Julia

The second example is a language called Julia, which you can find out more about here.  To quote from the web site:

“Julia is a high-level, high-performance dynamic programming language for technical computing.  Julia features optional typing, multiple dispatch, and good performance, achieved using type inference and just-in-time (JIT) compilation, implemented using LLVM

The language syntax is indeed very straightforward and logical.  As to performance, the evidence appears to be that it is possible to achieve execution speeds that match or even exceed those achieved by languages like Java or C++.

How High Level Programming Languages Match Up

The following micro-benchmark results, provided on the Julia web site, were obtained on a single core (serial execution) on an Intel® Xeon® CPU E7-8850 2.00GHz CPU with 1TB of 1067MHz DDR3 RAM, running Linux:

Benchmark

We need not pretend that this represents any kind of comprehensive speed test of Julia or its competitors.  Still, it’s worth dwelling on a few of the salient results.  The first thing that strikes me is how efficient Fortran, the grand-daddy of programming languages, remains in comparison to more modern alternatives, including the C benchmark.   The second result I find striking is how slow the much-touted Python is compared to Julia, Go and C.  The third result is how poorly MatLab, Octave and R perform on several of the tests.  Finally, and in some ways the greatest surprise at all is the execution efficiency of Mathematica relative to other high-level languages like MatLab and R.  It appears that Wolfram has made enormous progress in improving the speed of Mathematica, presumably through the vast expansion of highly efficient built-in operators and functions that have been added in recent releases (see chart below).

mathematica fns

Source:  Wolfram

Mathematica even compares favorably to Python on several of the tests.  Given that, why would anyone spend time learning a language like Python, which offers neither the development advantages of Mathematica, nor the speed advantages of C (or Fortran, Java or Julia)?

In any event, the main point is this:  it appears that, in 2015, we can finally look forward to dispensing with legacy programing languages and their primitive syntax and instead develop large, scalable systems that combine programming productivity and execution efficiency.  And that is reason enough for any self-respecting quant to rejoice.

My best wishes to you all for the New Year.

It’s Starting to Look Like 1929 All Over Again

As the commentators at Phoenix Capital point out, the CAPE (cyclical adjusted price to earnings) is showing a reading that suggests the market is now as overvalued as it was in 2007. The only times in history that the market has been more overvalued was during the 1929 bubble and the Tech bubble.

CAPE


Total stock market cap to GDP, a metric that Warren Buffett’s calls the “single best measure” of stock market value has reached 130%. It’s the highest reading since the DOTCOM bubble (which was 153%). Put another way, stocks are even more overvalued than they were in 2007 and have only been more overvalued during the Tech Bubble: the single biggest stock market bubble in 100 years.

MCapGDP

Meanwhile,  per Phoenix Capital:

1)   Investor sentiment is back to super bullish autumn 2007 levels.

2)   Insider selling to buying ratios are back to autumn 2007 levels.

3)   Money market fund assets are at 2007 levels (indicating that investors have gone “all in” with stocks).

4)   Mutual fund cash levels are at a historic low (again investors are “all in” with stocks).

5)   Margin debt (money borrowed to buy stocks) is near record highs.

In plain terms, the market is overvalued, overbought, overextended, and over leveraged. This is a recipe for a correction if not a collapse.

There are only two ways out of this:  either GDP picks up, or the market corrects.  The Fed is betting the farm on the former outcome.  In a sense, it is following a kind of martingale strategy, because the size of the its gamble increases with the level of over-valuation (whether you measure the risk in terms of potential market losses, or increased unemployment-related costs).  So, as per gambling theory, providing the bet size is unlimited, the subsequent win (it terms of the surpluses generated from a sizable pickup in GDP ) will be more than enough to offset the costs of supporting the market to these nosebleed levels.  In a sense, Bernanke was correct: the bet size is unlimited, if you own the printing presses for the world’s de-facto reserve currency.  But what this fails to take account of is the possibility, however remote, of a decoupling from the US$ standard.  The world’s appetite for US dollars might yet prove finite.  In which case, watch out below.

Money Management – the Good, the Bad and the Ugly

The infatuation of futures traders with the subject of money management, (more aptly described as position sizing), is something of a puzzle for someone coming from a background in equities or forex.  The idea is, simply, that one can improve one’s  trading performance through the judicious use of leverage, increasing the size of a position at times and reducing it at others.

MM Grapgic

Perhaps the most widely known money management technique is the Martingale, where the size of the trade is doubled after every loss.  It is easy to show mathematically that such a system must win eventually, provided that the bet size is unlimited.  It is also easy to show that, small as it may be, there is a non-zero probability of a long string of losing trades that would bankrupt the trader before he was able to recoup all his losses.  Still, the prospect offered by the Martingale strategy is an alluring one: the idea that, no matter what the underlying trading strategy, one can eventually be certain of winning.  And so a virtual cottage industry of money management techniques has evolved.

One of the reasons why the money management concept is prevalent in the futures industry compared to, say, equities or f/x, is simply the trading mechanics.  Doubling the size of a position in futures might mean trading an extra contract, or perhaps a ten-lot; doing the same in equities might mean scaling into and out of multiple positions comprising many thousands of shares.  The execution risk and cost of trying to implement a money management program in equities has historically made the  idea infeasible, although that is less true today, given the decline in commission rates and the arrival of smart execution algorithms.  Still, money management is a concept that originated in the futures industry and will forever be associated with it.

SSALGOTRADING AD

Van Tharp on Position Sizing
I was recently recommended to read Van Tharp’s Definitive Guide to Position Sizing, which devotes several hundred pages to the subject.  Leaving aside the great number of pages of simulation results, there is much to commend it.  Van Tharp does a pretty good job of demolishing highly speculative and very dangerous “money management” techniques such as the Kelly Criterion and Ralph Vince’s Optimal f, which make unrealistic assumptions of one kind or another, such as, for example, that there are only two outcomes, rather than the multiple possibilities from a trading strategy, or considering only the outcome of a single trade, rather than a succession of trades (whose outcome may not be independent).  Just as  with the Martingale, these techniques will often produce unacceptably large drawdowns.  In fact, as I have pointed out elsewhere, the use of leverage which many so-called money management techniques actually calls for increases in the risk in the original strategy, often reducing its risk-adjusted return.

As Van Tharp points out, mathematical literacy is not one of the strongest suits of futures traders in general and the money management strategy industry reflects that.

But Van Tharp  himself is not immune to misunderstanding mathematical concepts.  His central idea is that trading systems should be rated according to its System Quality Number, which he defines as:

SQN  = (Expectancy / standard deviation of R) * square root of Number of Trades

R is a central concept of Van Tharp’s methodology, which he defines as how much you will lose per unit of your investment.  So, for example, if you buy a stock today for $50 and plan to sell it if it reaches $40,  your R is $10.  In cases like this you have a clear definition of your R.  But what if you don’t?  Van Tharp sensibly recommends you use your average loss as an estimate of R.

Expectancy, as Van Tharp defines it, is just the expected profit per trade of the system expressed as a multiple of R.  So

SQN = ( (Average Profit per Trade / R) / standard deviation (Average Profit per Trade / R) * square root of Number of Trades

Squaring both sides of the equation, we get:

SQN^2  =  ( (Average Profit per Trade )^2 / R^2) / Variance (Average Profit per Trade / R) ) * Number of Trades

The R-squared terms cancel out, leaving the following:

SQN^2     =  ((Average Profit per Trade ) ^ 2 / Variance (Average Profit per Trade)) *  Number of Trades

Hence,

SQN = (Average Profit per Trade / Standard Deviation (Average Profit per Trade)) * square root of Number of Trades

There is another name by which this measure is more widely known in the investment community:  the Sharpe Ratio.

On the “Optimal” Position Sizing Strategy
In my view,  Van Tharp’s singular achievement has been to spawn a cottage industry out of restating a fact already widely known amongst investment professionals, i.e. that one should seek out strategies that maximize the Sharpe Ratio.

Not that seeking to maximize the Sharpe Ratio is a bad idea – far from it.  But then Van Tharp goes on to suggest that one should consider only strategies with a SQN of greater than 2, ideally much higher (he mentions SQNs of the order of 3-6).

But 95% or more of investable strategies have a Sharpe Ratio less than 2.  In fact, in the world of investment management a Sharpe Ratio of 1.5 is considered very good.  Barely a handful of funds have demonstrated an ability to maintain a Sharpe Ratio of greater than 2 over a sustained period (Jim Simon’s Renaissance Technologies being one of them).  Only in the world of high frequency trading do strategies typically attain the kind of Sharpe Ratio (or SQN) that Van Tharp advocates.  So while Van Tharp’s intentions are well meaning, his prescription is unrealistic, for the majority of investors.

One recommendation of Van Tharp’s that should be taken seriously is that there is no single “best” money management strategy that suits every investor.  Instead, position sizing should be evolved through simulation, taking into account each trader or investor’s preferences in terms of risk and return.  This makes complete sense: a trader looking to make 100% a year and willing to risk 50% of his capital is going to adopt a very different approach to money management, compared to an investor who will be satisfied with a 10% return, provided his risk of losing money is very low.  Again, however, there is nothing new here:  the problem of optimal allocation based on an investor’s aversion to risk has been thoroughly addressed in the literature for at least the last 50 years.

What about the Equity Curve Money Management strategy I discussed in a previous post?  Isn’t that a kind of Martingale?  Yes and no.  Indeed, the strategy does require us to increase the original investment after a period of loss. But it does so, not after a single losing trade, but after a series of losses from which the strategy is showing evidence of recovering.  Furthermore, the ECMM system caps the add-on investment at some specified level, rather than continuing to double the trade size after every loss, as in a Martingale.

But the critical difference between the ECMM and the standard Martingale lies in the assumptions about dependency in the returns of the underlying strategy. In the traditional Martingale, profits and losses are independent from one trade to the next.  By contrast, scenarios where ECMM is likely to prove effective are ones where there is dependency in the underlying strategy, more specifically, negative autocorrelation in returns over some horizon.  What that means is that periods of losses or lower returns tend to be followed by periods of gains, or higher returns.  In other words, ECMM works when the underlying strategy has a tendency towards mean reversion.

CONCLUSION
The futures industry has spawned a myriad of position sizing strategies.  Many are impractical, or positively dangerous, leading as they do to significant risk of catastrophic loss.  Generally, investors should seek out strategies with higher Sharpe Ratios, and use money management techniques only to improve the risk-adjusted return.  But there is no universal money management methodology that will suit every investor.  Instead, money management should be conditioned on each individual investors risk preferences.

High Frequency Trading with ADL – JonathanKinlay.com

Trading Technologies’ ADL is a visual programming language designed specifically for trading strategy development that is integrated in the company’s flagship XTrader product. ADL Extract2 Despite the radically different programming philosophy, my experience of working with ADL has been delightfully easy and strategies that would typically take many months of coding in C++ have been up and running in a matter of days or weeks.  An extract of one such strategy, a high frequency scalping trade in the E-Mini S&P 500 futures, is shown in the graphic above.  The interface and visual language is so intuitive to a trading system developer that even someone who has never seen ADL before can quickly grasp at least some of what it happening in the code.

Strategy Development in Low vs. High-Level Languages
What are the benefits of using a high level language like ADL compared to programming languages like C++/C# or Java that are traditionally used for trading system development?  The chief advantage is speed of development:  I would say that ADL offers the potential up the development process by at least one order of magnitude.  A complex trading system would otherwise take months or even years to code and test in C++ or Java, can be implemented successfully and put into production in a matter of weeks in ADL. In this regard, the advantage of speed of development is one shared by many high level languages, including, for example, Matlab, R and Mathematica.  But in ADL’s case the advantage in terms of time to implementation is aided by the fact that, unlike generalist tools such as MatLab, etc, ADL is designed specifically for trading system development.  The ADL development environment comes equipped with compiled pre-built blocks designed to accomplish many of the common tasks associated with any trading system such as acquiring market data and handling orders.  Even complex spread trades can be developed extremely quickly due to the very comprehensive library of pre-built blocks.

SSALGOTRADING AD

Integrating Research and Development
One of the drawbacks of using a higher  level language for building trading systems is that, being interpreted rather than compiled, they are simply too slow – one or more orders of magnitude, typically – to be suitable for high frequency trading.  I will come on to discuss the execution speed issue a little later.  For now, let me bring up a second major advantage of ADL relative to other high level languages, as I see it.  One of the issues that plagues trading system development is the difficulty of communication between researchers, who understand financial markets well, but systems architecture and design rather less so, and developers, whose skill set lies in design and programming, but whose knowledge of markets can often be sketchy.  These difficulties are heightened where researchers might be using a high level language and relying on developers to re-code their prototype system  to get it into production.  Developers  typically (and understandably) demand a high degree of specificity about the requirement and if it’s not included in the spec it won’t be in the final deliverable.  Unfortunately, developing a successful trading system is a highly non-linear process and a researcher will typically have to iterate around the core idea repeatedly until they find a combination of alpha signal and entry/exit logic that works.  In other words, researchers need flexibility, whereas developers require specificity. ADL helps address this issue by providing a development environment that is at once highly flexible and at the same time powerful enough to meet the demands of high frequency trading in a production environment.  It means that, in theory, researchers and developers can speak a common language and use a common tool throughout the R&D development cycle.  This is likely to reduce the kind of misunderstanding between researchers and developers that commonly arise (often setting back the implementation schedule significantly when they do).

Latency
Of course,  at least some of the theoretical benefit of using ADL depends on execution speed.  The way the problem is typically addressed with systems developed in high level languages like Matlab or R is to recode the entire system in something like C++, or to recode some of the most critical elements and plug those back into the main Matlab program as dlls.  The latter approach works, and preserves the most important benefits of working in both high and low level languages, but the resulting system is likely to be sub-optimal and can be difficult to maintain. The approach taken by Trading Technologies with ADL is very different.  Firstly,  the component blocks are written in  C# and in compiled form should run about as fast as native code.  Secondly, systems written in ADL can be deployed immediately on a co-located algo server that is plugged directly into the exchange, thereby reducing latency to an acceptable level.  While this is unlikely to sufficient for an ultra-high frequency system operating on the sub-millisecond level, it will probably suffice for high frequency systems that operate at speeds above above a few millisecs, trading up to say, around 100 times a day.

Fill Rate and Toxic Flow
For those not familiar with the HFT territory, let me provide an example of why the issues of execution speed and latency are so important.  Below is a simulated performance record for a HFT system in ES futures.  The system is designed to enter and exit using limit orders and trades around 120 times a day, with over 98% profitability, if we assume a 100% fill rate. Monthly PNL 1 Perf Summary 1  So far so good.  But  a 100% fill rate  is clearly unrealistic.  Let’s look at a pessimistic scenario: what if we  got filled on orders only when the limit price was exceeded?  (For those familiar with the jargon, we are assuming a high level of flow toxicity)  The outcome is rather different: Perf Summary 2 Neither scenario is particularly realistic, but the outcome is much more likely to be closer to the second scenario rather than the first if we our execution speed is slow, or if we are using a retail platform such as Interactive Brokers or Tradestation, with long latency wait times.  The reason is simple: our orders will always arrive late and join the limit order book at the back of the queue.  In most cases the orders ahead of ours will exhaust demand at the specified limit price and the market will trade away without filling our order.  At other times the market will fill our order whenever there is a large flow against us (i.e. a surge of sell orders into our limit buy), i.e. when there is significant toxic flow. The proposition is that, using ADL and the its high-speed trading infrastructure, we can hope to avoid the latter outcome.  While we will never come close to achieving a 100% fill rate, we may come close enough to offset the inevitable losses from toxic flow and produce a decent return.  Whether ADL is capable of fulfilling that potential remains to be seen.

More on ADL
For more information on ADL go here.

Equity Curve Money Management

Amongst a wide variety of money management methods that have evolved over the years, a perennial favorite is the use of the equity curve to guide position sizing.  The most common version of this technique is to add to the existing position (whether long or short) depending on the relationship between the current value of the account equity (realized + unrealized PL) and its moving average.  According to whether you believe that the  equity curve is momentum driven, or mean reverting, you will add to your existing position when the equity move above (or, on the case of mean-reverting, below) the long term moving average.

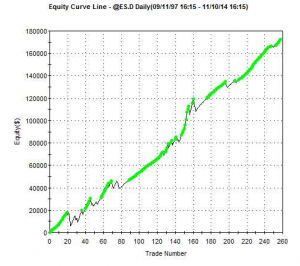
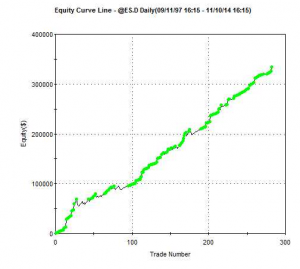
In this article I want to discuss a  slightly different version of equity curve money management, which is mean-reversion oriented.  The underlying thesis is that your trading strategy has good profit characteristics, and while it suffers from the occasional, significant drawdown, it can be expected to recover from the downswings.  You should therefore be looking to add to your positions when the equity curve moves down sufficiently, in the expectation that the trading strategy will recover.  The extra contracts you add to your position during such downturns  with increase the overall P&L. To illustrate the approach I am going to use a low frequency strategy on the S&P500 E-mini futures contract (ES).  The performance of the strategy is summarized in the chart and table below. EC PNL

(click to enlarge)

The overall results of the strategy are not bad:  at over 87% the  win rate is high as, too, is the profit factor of 2.72.  And the strategy’s performance, although hardly stellar, has been quite consistent over the period from 1997.  That said, most  the profits derive from the long side, and the strategy suffers from the occasional large loss, including a significant drawdown of over 18% in 2000.

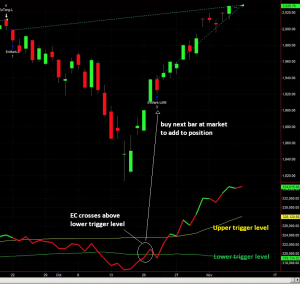
I am going to use this underlying strategy to illustrate how its performance can be improved with equity curve money management (ECMM).  To start, we calculate a simple moving average of the equity curve, as before.  However, in this variation of ECMM we then calculate offsets  that are a number of standard deviations above or below the moving average.  Typical default values for the moving average length might be 50 bars for a daily series, while we might  use, say,  +/- 2 S.D. above and below the moving average as our trigger levels. The idea is that we add to our position when the equity curve falls below the lower threshold level (moving average – 2x S.D) and then crosses back above it again.  This is similar to how a trader might use Bollinger bands, or an oscillator like Stochastics.  The chart below illustrates the procedure.

ED.D Chart with ECMM

The lower and upper trigger levels are shown as green and yellow lines in the chart indicator (note that in this variant of ECMM we only use the lower level to add to positions).

After a significant drawdown early in October the equity curve begins to revert and crosses back over the lower threshold level on Oct 21.  Applying our ECMM rule, we add to our existing long position the next day, Oct 22 (the same procedure would apply to adding to short positions).  As you can see, our money management trade worked out very well, since the EC did continue to mean-revert as expected. We closed the trade on Nov 11, for a substantial, additional profit.

Now we have illustrated the procedure, let’s being to explore the potential of the ECMM idea in more detail.  The first important point to understand is what ECMM will NOT do: i.e. reduce risk.  Like all money management techniques that are designed to pyramid into positions, ECMM will INCREASE risk, leading to higher drawdowns.  But ECMM should also increase profits:  so the question is whether the potential for greater profits is sufficient to offset the risk of greater losses.  If not, then there is a simpler alternative method of increasing profits: simply increase position size!  It follows that one of the key metrics of performance to focus on in evaluating this technique is the ratio of PL to drawdown.  Let’s look at some examples for our baseline strategy.

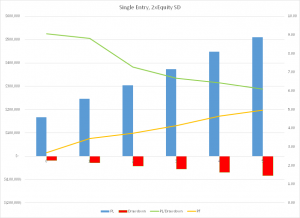
Single Entry, 2SD

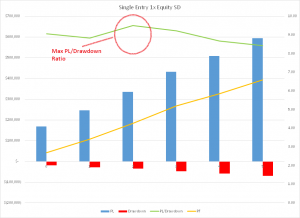
The chart shows the effect of adding a specified number of contracts to our existing long or short position whenever the equity curve crosses back above the lower trigger level, which in this case is set at 2xS.D below the 50-day moving average of the equity curve.  As expected, the overall strategy P&L increases linearly in line with the number of additional contracts traded, from a base level of around $170,000, to over $500,000 when we trade an additional five contracts.  So, too, does the profit factor rise from around 2.7 to around 5.0. That’s where the good news ends. Because, just as the strategy PL increases, so too does the size of the maximum drawdown, from $(18,500) in the baseline case to over $(83,000) when we trade an additional five contracts.  In fact, the PL/Drawdown ratio declines from over 9.0 in the baseline case, to only 6.0 when we trade the ECMM strategy with five additional contracts.  In terms of risk and reward, as measured by the PL/Drawdown ratio, we would be better off simply trading the baseline strategy:  if we traded 3 contracts instead of 1 contract, then without any money management at all we would have made total profits of around $500,000, but with a drawdown of just over $(56,000).  This is the same profit as produced with the 5-contract ECMM strategy, but with a drawdown that is $23,000 smaller.

SSALGOTRADING AD

How does this arise?  Quite simply, our ECMM money management trades as not all automatic winners from the get-go (even if they eventually produce profits.  In some cases, having crossed above the lower threshold level, the equity curve will subsequently cross back down below it again.  As it does so, the additional contracts we have traded are now adding to the strategy drawdown.

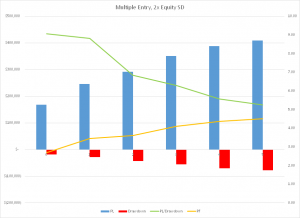
This suggests that there might be a better alternative.  How about if, instead of doing a single ECMM trade for, say, 5 additional contracts, we instead add an additional contract each time the equity curve crosses above the lower threshold level.  Sure, we might give up some extra profits, but our drawdown should be lower, right? That turns out to be true.  Unfortunately, however, profits are impacted more than the drawdown, so as a result the PL/Drawdown ratio shows the same precipitous decline:

Multiple Entry, 2SD

Once again, we would be better off trading the baseline strategy in larger size, rather than using ECMM, even when we scale into the additional contracts.

What else can we try?  An obvious trick to try is tweaking the threshold levels.  We can do this by adjusting the # of standard deviations at which to set the trigger levels.  Intuitively, it might seem that the obvious thing to do is set the threshold levels further apart, so that ECMM trades are triggered less frequently.  But, as it turns out, this does not produce the desired effect.  Instead, counter-intuitively, we have to set the threshold levels CLOSER to the moving average, at only +/-1x S.D.  The results are shown in the chart below.

Single Entry, 1SD

With these settings, the strategy PL and profit factor increase linearly, as before.  So too does the strategy drawdown, but at a slower rate.  As a consequence, the PL/Drawdown ration actually RISES, before declining at a moderate pace.  Looking at the chart, it is apparent the optimal setting is trading two additional contracts with a threshold setting one standard deviation below the 50-day moving average of the equity curve.

Below are the overall results.  With these settings the baseline strategy plus ECMM produces total profits of $334,000, a profit factor of 4.27 and a drawdown of $(35,212), making the PL/Drawdown ratio 9.50.  Producing the same rate of profits using the baseline strategy alone would require us to trade two contracts, producing a slightly higher drawdown of almost $(37,000).  So our ECMM strategy has increased overall profitability on a risk-adjusted basis.

EC with ECMM PNL ECMM

(Click to enlarge)

CONCLUSION

It is certainly feasible to improve not only the overall profitability of a strategy using equity curve money management, but also the risk-adjusted performance.  Whether ECMM will have much effect depends on the specifics of the underlying strategy, and the level at which the ECMM parameters are set to.  These can be optimized on a walk-forward basis.

EASYLANGUAGE CODE

Inputs:

MALen(50),
SDMultiple(2),
PositionMult(1),
ExitAtBreakeven(False);

Var:
OpenEquity(0),
EquitySD(0),
EquityMA(0),
UpperEquityLevel(0),
LowerEquityLevel(0),
NShares(0);

OpenEquity=OpenPositionProfit+NetProfit;a
EquitySD=stddev(OpenEquity,MALen);
EquityMA=average(OpenEquity,MALen);
UpperEquityLevel=EquityMA + SDMultiple*EquitySD;
LowerEquityLevel=EquityMA-SDMultiple*EquitySD;
NShares=CurrentContracts*PositionMult;
If OpenEquity crosses above LowerEquityLevel then begin
If Marketposition > 0 then begin
Buy(“EnMark-LMM”) NShares shares next bar at market;
end;
If Marketposition < 0 then begin
Sell Short(“EnMark-SMM”) NShares shares next bar at market;
end;
end;
If ExitAtBreakeven then begin

If OpenEquity crosses above EquityMA then begin
If Marketposition > 1 then begin
Sell Short (“ExBE-LMM”) (Currentcontracts-1) shares next bar at market;
end;
If Marketposition < -1 then begin
Buy (“ExBE-SMM”) (Currentcontracts-1) shares next bar at market;
end;

end;
end;

Building Systematic Strategies – A New Approach

Anyone active in the quantitative space will tell you that it has become a great deal more competitive in recent years.  Many quantitative trades and strategies are a lot more crowded than they used to be and returns from existing  strategies are on the decline.

THE CHALLENGE

The Challenge

Meanwhile, costs have been steadily rising, as the technology arms race has accelerated, with more money being spent on hardware, communications and software than ever before.  As lead times to develop new strategies have risen, the cost of acquiring and maintaining expensive development resources have spiraled upwards.  It is getting harder to find new, profitable strategies, due in part to the over-grazing of existing methodologies and data sets (like the E-Mini futures, for example). There has, too, been a change in the direction of quantitative research in recent years.  Where once it was simply a matter of acquiring the fastest pipe to as many relevant locations as possible, the marginal benefit of each extra $ spent on infrastructure has since fallen rapidly.  New strategy research and development is now more model-driven than technology driven.


THE OPPORTUNITY

The Opportunity

What is needed at this point is a new approach:  one that accelerates the process of identifying new alpha signals, prototyping and testing new strategies and bringing them into production, leveraging existing battle-tested technologies and trading platforms.


GENETIC PROGRAMMING

Genetic programming, which has been around since the 1990’s when its use was pioneered in proteomics, enjoys significant advantages over traditional research and development methodologies.

GP

GP is an evolutionary-based algorithmic methodology in which a system is given a set of simple rules, some data, and a fitness function that produces desired outcomes from combining the rules and applying them to the data.   The idea is that, by testing large numbers of possible combinations of rules, typically in the  millions, and allowing the most successful rules to propagate, eventually we will arrive at a strategy solution that offers the required characteristics.

ADVANTAGES OF GENETIC PROGRAMMING

AdvantagesThe potential benefits of the GP approach are considerable:  not only are strategies developed much more quickly and cost effectively (the price of some software and a single CPU vs. a small army of developers), the process is much more flexible. The inflexibility of the traditional approach to R&D is one of its principle shortcomings.  The researcher produces a piece of research that is subsequently passed on to the development team.  Developers are usually extremely rigid in their approach: when asked to deliver X, they will deliver X, not some variation on X.  Unfortunately research is not an exact science: what looks good in a back-test environment may not pass muster when implemented in live trading.  So researchers need to “iterate around” the idea, trying different combinations of entry and exit logic, for example, until they find a variant that works.  Developers are lousy at this;  GP systems excel at it.

CHALLENGES FOR THE GENETIC PROGRAMMING APPROACH

So enticing are the potential benefits of GP that it begs the question as to why the approach hasn’t been adopted more widely.  One reason is the strong preference amongst researchers for an understandable – and testable – investment thesis.  Researchers – and, more importantly, investors –  are much more comfortable if they can articulate the premise behind a strategy.  Even if a trade turns out to be a loser, we are generally more comfortable buying a stock on the supposition of, say,  a positive outcome of a pending drug trial, than we are if required to trust the judgment of a black box, whose criteria are inherently unobservable.

GP Challenges

Added to this, the GP approach suffers from three key drawbacks:  data sufficiency, data mining and over-fitting.  These are so well known that they hardly require further rehearsal.  There have been many adverse outcomes resulting from poorly designed mechanical systems curve fitted to the data. Anyone who was active in the space in the 1990s will recall the hype over neural networks and the over-exaggerated claims made for their efficacy in trading system design.  Genetic Programming, a far more general and powerful concept,  suffered unfairly from the ensuing adverse publicity, although it does face many of the same challenges.

A NEW APPROACH

I began working in the field of genetic programming in the 1990’s, with my former colleague Haftan Eckholdt, at that time head of neuroscience at Yeshiva University, and we founded a hedge fund, Proteom Capital, based on that approach (large due to Haftan’s research).  I and my colleagues at Systematic Strategies have continued to work on GP related ideas over the last twenty years, and during that period we have developed a methodology that address the weaknesses that have held back genetic programming from widespread adoption.

Advances

Firstly, we have evolved methods for transforming original data series that enables us to avoid over-using the same old data-sets and, more importantly, allows new patterns to be revealed in the underlying market structure.   This effectively eliminates the data mining bias that has plagued the GP approach. At the same time, because our process produces a stronger signal relative to the background noise, we consume far less data – typically no more than a couple of years worth.

Secondly, we have found we can enhance the robustness of prototype strategies by using double-blind testing: i.e. data sets on which the performance of the model remains unknown to the machine, or the researcher, prior to the final model selection.

Finally, we are able to test not only the alpha signal, but also multiple variations of the trade expression, including different types of entry and exit logic, as well as profit targets and stop loss constraints.

OUTCOMES:  ROBUST, PROFITABLE STRATEGIES

outcomes

Taken together, these measures enable our GP system to produce strategies that not only have very high performance characteristics, but are also extremely robust.  So, for example, having constructed a model using data only from the continuing bull market in equities in 2012 and 2013, the system is nonetheless capable of producing strategies that perform extremely well when tested out of sample over the highly volatility bear market conditions of 2008/09.

So stable are the results produced by many of the strategies, and so well risk-controlled, that it is possible to deploy leveraged money-managed techniques, such as Vince’s fixed fractional approach.  Money management schemes take advantage of the high level of consistency in performance to increase the capital allocation to the strategy in a way that boosts returns without incurring a high risk of catastrophic loss.  You can judge the benefits of applying these kinds of techniques in some of the strategies we have developed in equity, fixed income, commodity and energy futures which are described below.

CONCLUSION

After 20-30 years of incubation, the Genetic Programming approach to strategy research and development has come of age. It is now entirely feasible to develop trading systems that far outperform the overwhelming majority of strategies produced by human researchers, in a fraction of the time and for a fraction of the cost.

SAMPLE GP SYSTEMS

Sample

SSALGOTRADING AD

emini    emini MM

NG  NG MM

SI MMSI

US US MM