What is a Covered Call?
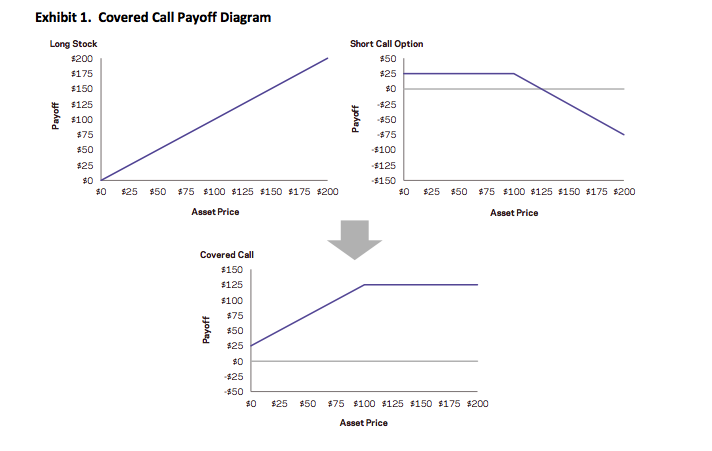
A covered call (or covered write or buy-write) is a long position in a security and a short position in a call option on that security. The diagram below constructs the covered call payoff diagram, including the option premium, at expiration when the call option is written at a $100 strike with a $25 option premium.

Equity index covered calls are an attractive strategy to many investors because they have realized returns not much lower than those of the equity market but with much lower volatility. But investors often do the trade for the wrong reasons: there are a number of myths about covered writes that persist even amongst professional options traders. I have heard most, if not all of them professed by seasons floor traders on the American Stock Exchange and, I confess, I have even used one or two of them myself. Roni Israelov and Larn Nielsen of AQR Capital Management, LLC have done a fine job of elucidating and then dispelling these misunderstandings about the strategy, in their paper Covered Call Strategies: One Fact and Eight Myths, Financial Analysts Journal, Vol. 70, No. 6, 2014.

The Cover Call Strategy and its Benefits for Investors
The covered call strategy has generated attention due to its attractive historical risk-adjusted returns. For example, the CBOE S&P 500 BuyWrite Index, the industry-standard covered call benchmark, is commonly described as providing average returns comparable to the S&P 500 Index with approximately two-thirds the volatility, supported by statistics such as those shown below.

The key advantages of the strategy (compared to an outright, delta-one position) include lower volatility, beta and tail risk. As a consequence, the strategy produces higher risk-adjusted rates if return (Sharpe Ratio). Note, too, the beta convexity of the strategy, a topic I cover in this post:
http://jonathankinlay.com/2017/05/beta-convexity/
Although the BuyWrite Index has historically demonstrated similar total returns to the S&P 500, it does so with a reduced beta to the S&P 500 Index. However, it is important to also understand that the BuyWrite Index is more exposed to negative S&P 500 returns than positive returns. This asymmetric relationship to the S&P 500 is consistent with its payoff characteristics and results from the fact that a covered call strategy sells optionality. What this means in simple terms is that while drawdowns are somewhat mitigated by the revenue associated with call writing, the upside is capped by those same call options.
Understandably, a strategy that produces equity-like return with lower beta and lower risk attracts considerable attention from investors. According to Moringstar, growth in assets under management in covered call strategies has been over 25% per year over the 10 years through June 2014 with over $45 billion currently invested.
Myths about the Covered Call Strategy
Many option strategies are the subject of investor myths, partly, I suppose, because option strategies are relatively complicated and entail risks in several dimensions. So it is quite easy for investors to become confused. Simple anecdotes are attractive because they appear to cut through the complexity with an easily understood metaphor, but they can often be misleading. An example is the widely-held view – even amongst professional option traders – is that selling volatility via strangles is a less risk approach than selling at-the-money straddles. Intuitively, this makes sense: why wouldn’t selling straddles that have strike prices (far) away from the current spot price be less risky than selling straddles that have strike prices close to the spot price? But, in fact, it turns out that selling straddles is the less risky the two strategies – see this post for details:
http://jonathankinlay.com/2016/11/selling-volatility/
Likewise, the covered call strategy is subject to a number of “urban myths”, that turn out to be unfounded:
Myth 1: Risk exposure is described by the payoff diagram
That is only true at expiration. Along the way, the positions will be marked-to-market and may produce a substantially different payoff if the trade is terminated early. The same holds true for a zero-coupon bond – we know the terminal value for certain, but there can be considerable variation in the value of the asset from day to day.
Myth 2: Covered calls provide downside protection
This is partially true, but only in a very limited sense. Unlike a long option hedge, the “protection” in a buy-write strategy is limited to only the premium collected on the option sale, a relatively modest amount in most cases. Consider a covered call position on a $100 stock with a $10 at-the-money call premium. The covered call can potentially lose $90 and the long call option can lose $10. Each position has the same 50% exposure to the stock, but the covered call’s downside risk is disproportionate to its stock exposure. This is consistent with the covered call’s realized upside and downside betas as discussed earlier.
Myth 3: Covered calls generate income.
Remember that income is revenue minus costs.
It is true that option selling generates positive cash flow, but this incorrectly leads investors to the conclusion that covered calls generate investment income. Just as is the case with bond issuance, the revenue generated from selling the call option is not income (though, like income, the cash flows received from selling options are considered taxable for many investors). In order for there to be investment income or earnings, the option must be sold at a favorable price – the option’s implied volatility needs to be higher than the stock’s expected volatility.
Myth 4: Covered calls on high-volatility stocks and/or shorter-dated options provide higher yield.
Though true that high volatility stocks and short-dated options command higher annualized premiums, insurance on riskier assets should rationally command a higher premium and selling insurance more often per year should provide higher annual premiums. However, these do not equate to higher net income or yield. For instance, if options are properly priced (e.g., according to the Black-Scholes pricing model), then selling 12 at-the-money options will generate approximately 3.5 times the cash flow of selling a single annual option, but this does not unequivocally translate into higher net profits as discussed earlier. Assuming fairly priced options, higher revenue is not necessarily a mechanism for increasing investment income.
The key point here is that what matters is value, not price. In other words, expected investment profits are generated by the option’s richness, not the option’s price. For example, if you want to short a stock with what you consider to be a high valuation, then the goal is not to find a stock with a high price, but rather one that is overpriced relative to its fundamental value. The same principle applies to options. It is not appropriate to seek an option with a high price or other characteristics associated with high prices. Investors must instead look for options that are expensive relative to their fundamental value. Put another way, the investor should seek out options trading at a higher implied volatility than the likely futures realized volatility over the life of the option.
Myth 5: Time decay of options written works in your favor.
While it is true that the value of an option declines over time as it approaches expiration, that is not the whole story. In fact an option’s expected intrinsic value increases as the underlying security realizes volatility. What matters is whether the realized volatility turns out to be lower than the volatility baked into the option price – the implied volatility. In truth, an option’s time decay only works in the seller’s favor if the option is initially priced expensive relative to its fundamental value. If the option is priced cheaply, then time decay works very much against the seller.
Myth 6: Covered calls are appropriate if you have a neutral to moderately bullish view.
This myth is an over-simplification. In selling a call option you are expressing a view, not only on the future prospects for the stock, but also on its likely future volatility. It is entirely possible that the stock could stall (or even decline) and yet the value of the option you have sold rises due, say, to takeover rumors. A neutral view on the stock may imply a belief that the security price will not move far from its current price rather than its expected return is zero. If so, then a short straddle position is a way to express that view — not a covered call — because, in this case, no active position should be taken in the security.
Myth 7: Overwriting pays you for doing what you were going to do anyway
This myth is typically posed as the following question: if you have a price target for selling a stock you own, why not get paid to write a call option struck at that price target?
In fact this myth exposes the critical difference between a plan and a contractual obligation. If the former case, suppose that the stock hits your target price very much more quickly than you had anticipated, perhaps as a result of a new product announcement that you had not anticipated at the time you set your target. In those circumstances you might very well choose to maintain your long position and revise your price target upwards. This is an example of a plan – a successful one – that can be adjusted to suit circumstances as they change.
A covered call strategy is an obligation, rather than a plan. You have pre-sold the stock at the target price and, in the above scenario, you cannot change your mind in order to benefit from additional potential upside in the stock.
In other words, with a covered call strategy you have monetized the optionality that is inherent in any plan and turned it into a contractual obligation in exchange for a fee.
Myth 8: Overwriting allows you to buy a stock at a discounted price.
Here is how this myth is typically framed: if a stock that you would like to own is currently priced at $100 and that you think is currently expensive, you can act on that opinion by selling a naked put option at a $95 strike price and collect a premium of say $1. Then, if the price subsequently declines below the strike price, the option will likely be exercised thus requiring you to buy the stock for $95. Including the $1 premium, you effectively buy the stock at a 6% discount. If the option is not exercised you keep the premium as income. So, this type of outcome for selling naked put options may also lead you to conclude that the equivalent covered call strategy makes sense and is valuable.
But this argument is really a sleight of hand. In our example above, if the option is exercised, then when you buy the stock for $95 you won’t care what the stock price was when you sold the option. What matters is the stock price on the date the option was exercised. If the stock price dropped all the way down to $80, the $95 purchase price no longer seems like a discount. Your P&L will show a mark-to-market loss of $14 ($95 – $80 – $1). The initial stock price is irrelevant and the $1 premium hardly helps.
Conclusion: How to Think About the Covered Call Strategy
Investors should ignore the misleading storytelling about obtaining downside buffers and generating income. A covered call strategy only generates income to the extent that any other strategy generates income, by buying or selling mispriced securities or securities with an embedded risk premium. Avoid the temptation to overly focus on payoff diagrams. If you believe the index will rise and implied volatilities are rich, a covered call is a step in the right direction towards expressing that view.
If you have no view on implied volatility, there is no reason to sell options, or covered calls
Aby znaleźć legalne kasyna online w Polsce, odwiedź stronę pl.kasynopolska10.com/legalne-kasyna/, partnera serwisu recenzującego kasyna online – KasynoPolska10.


