High Frequency Scalping Strategies

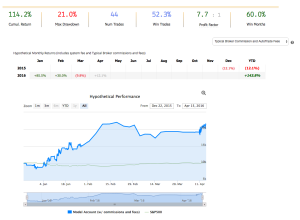
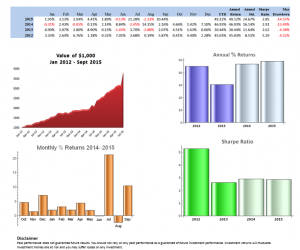
HFT scalping strategies enjoy several highly desirable characteristics, compared to low frequency strategies.  A case in point is our scalping strategy in VIX futures, currently running on the Collective2 web site:

  • The strategy is highly profitable, with a Sharpe Ratio in excess of 9 (net of transaction costs of $14 prt)
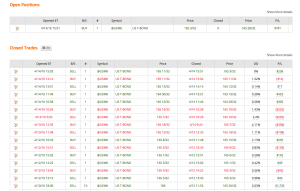
  • Performance is consistent and reliable, being based on a large number of trades (10-20 per day)
  • The strategy has low, or negative correlation to the underlying equity and volatility indices
  • There is no overnight risk


VIX HFT Scalper


Background on HFT Scalping Strategies

The attractiveness of such strategies is undeniable.  So how does one go about developing them?

It is important for the reader to familiarize himself with some of the background to  high frequency trading in general and scalping strategies in particular.  Specifically, I would recommend reading the following blog posts:

http://jonathankinlay.com/2015/05/high-frequency-trading-strategies/

http://jonathankinlay.com/2014/05/the-mathematics-of-scalping/


Execution vs Alpha Generation in HFT Strategies

The key to understanding HFT strategies is that execution is everything.  With low frequency strategies a great deal of work goes into researching sources of alpha, often using highly sophisticated mathematical and statistical techniques to identify and separate the alpha signal from the background noise.  Strategy alpha accounts for perhaps as much as 80% of the total return in a low frequency strategy, with execution making up the remaining 20%.  It is not that execution is unimportant, but there are only so many basis points one can earn (or save) in a strategy with monthly turnover.  By contrast, a high frequency strategy is highly dependent on trade execution, which may account for 80% or more of the total return.  The algorithms that generate the strategy alpha are often very simple and may provide only the smallest of edges.  However, that very small edge, scaled up over thousands of trades, is sufficient to produce a significant return. And since the risk is spread over a large number of very small time increments, the rate of return can become eye-wateringly high on a risk-adjusted basis:  Sharpe Ratios of 10, or more, are commonly achieved with HFT strategies.

In many cases an HFT algorithm seeks to estimate the conditional probability of an uptick or downtick in the underlying, leaning on the bid or offer price accordingly.  Provided orders can be positioned towards the front of the queue to ensure an adequate fill rate, the laws of probability will do the rest.  So, in the HFT context, much effort is expended on mitigating latency and on developing techniques for establishing and maintaining priority in the limit order book.  Another major concern is to monitor order book dynamics for signs that book pressure may be moving against any open orders, so that they can be cancelled in good time, avoiding adverse selection by informed traders, or a buildup of unwanted inventory.

In a high frequency scalping strategy one is typically looking to capture an average of between 1/2 to 1 tick per trade.  For example, the VIX scalping strategy illustrated here averages around $23 per contract per trade, i.e. just under 1/2 a tick in the futures contract.  Trade entry and exit is effected using limit orders, since there is no room to accommodate slippage in a trading system that generates less than a single tick per trade, on average. As with most HFT strategies the alpha algorithms are only moderately sophisticated, and the strategy is highly dependent on achieving an acceptable fill rate (the proportion of limit orders that are executed).  The importance of achieving a high enough fill rate is clearly illustrated in the first of the two posts referenced above.  So what is an acceptable fill rate for a HFT strategy?

Fill Rates

I’m going to address the issue of fill rates by focusing on a critical subset of the problem:  fills that occur at the extreme of the bar, also known as “extreme hits”. These are limit orders whose prices coincide with the highest (in the case of a sell order) or lowest (in the case of a buy order) trade price in any bar of the price series. Limit orders at prices within the interior of the bar are necessarily filled and are therefore uncontroversial.  But limit orders at the extremities of  the bar may or may not be filled and it is therefore these orders that are the focus of attention.

By default, most retail platform backtest simulators assume that all limit orders, including extreme hits, are filled if the underlying trades there.  In other words, these systems typically assume a 100% fill rate on extreme hits.  This is highly unrealistic:  in many cases the high or low of a bar forms a turning point that the price series visits only fleetingly before reversing its recent trend, and does not revisit for a considerable time.  The first few orders at the front of the queue will be filled, but many, perhaps the majority of, orders further down the priority order will be disappointed.  If the trader is using a retail trading system rather than a HFT platform to execute his trades, his limit orders are almost always guaranteed to rest towards the back of the queue, due to the relatively high latency  of his system.  As a result, a great many of his limit orders – in particular, the extreme hits – will not be filled.

The consequences of missing a large number of trades due to unfilled limit orders are likely to be catastrophic for any HFT strategy. A simple test that is readily available  in most backtest systems is to change the underlying assumption with regard to the fill rate on extreme hits – instead of assuming that 100% of such orders are filled, the system is able to test the outcome if limit orders are filled only if the price series subsequently exceeds the limit price.  The outcome produced under this alternative scenario is typically extremely adverse, as illustrated in first blog post referenced previously.


Fig4

In reality, of course, neither assumption is reasonable:  it is unlikely that either 100% or 0% of a strategy’s extreme hits will be filled – the actual fill rate will likely lie somewhere between these two outcomes.   And this is the critical issue:  at some level of fill rate the strategy will move from profitability into unprofitability.  The key to implementing a HFT scalping strategy successfully is to ensure that the execution falls on the right side of that dividing line.

Implementing HFT Scalping Strategies in Practice

One solution to the fill rate problem is to spend millions of dollars building HFT infrastructure.  But for the purposes of this post let’s assume that the trader is confined to using a retail trading platform like Tradestation or Interactive Brokers.  Are HFT scalping systems still feasible in such an environment?  The answer, surprisingly, is a qualified yes – by using a technique that took me many years to discover.

To illustrate the method I will use the following HFT scalping system in the E-Mini S&P500 futures contract.  The system trades the E-Mini futures on 3 minute bars, with an average hold time of 15 minutes.  The average trade is very low – around $6, net of commissions of $8 prt.  But the strategy appears to be highly profitable ,due to the large number of trades – around 50 to 60 per day, on average.


fig-4

fig-3

So far so good.  But the critical issue is the very large number of extreme hits produced by the strategy.  Take the trading activity on 10/18 as an example (see below).  Of 53 trades that day, 25 (47%) were extreme hits, occurring at the high or low price of the 3-minute bar in which the trade took place.


fig5


Overall, the strategy extreme hit rate runs at 34%, which is extremely high.  In reality, perhaps only 1/4 or 1/3 of these orders will actually execute – meaning that remainder, amounting to around 20% of the total number of orders, will fail.  A HFT scalping strategy cannot hope to survive such an outcome.  Strategy profitability will be decimated by a combination of missed, profitable trades and  losses on trades that escalate after an exit order fails to execute.

So what can be done in such a situation?

Manual Override, MIT and Other Interventions

One approach that will not work is to assume naively that some kind of manual oversight will be sufficient to correct the problem.  Let’s say the trader runs two versions of the system side by side, one in simulation and the other in production.  When a limit order executes on the simulation system, but fails to execute in production, the trader might step in, manually override the system and execute the trade by crossing the spread.  In so doing the trader might prevent losses that would have occurred had the trade not been executed, or force the entry into a trade that later turns out to be profitable.  Equally, however, the trader might force the exit of a trade that later turns around and moves from loss into profit, or enter a trade that turns out to be a loser.  There is no way for the trader to know, ex-ante, which of those scenarios might play out.  And the trader will have to face the same decision perhaps as many as twenty times a day.  If the trader is really that good at picking winners and cutting losers he should scrap his trading system and trade manually!

An alternative approach would be to have the trading system handle the problem,  For example, one could program the system to convert limit orders to market orders if a trade occurs at the limit price (MIT), or after x seconds after the limit price is touched.  Again, however, there is no way to know in advance whether such action will produce a positive outcome, or an even worse outcome compared to leaving the limit order in place.

In reality, intervention, whether manual or automated, is unlikely to improve the trading performance of the system.  What is certain, however,  is that by forcing the entry and exit of trades that occur around the extreme of a price bar, the trader will incur additional costs by crossing the spread.  Incurring that cost for perhaps as many as 1/3 of all trades, in a system that is producing, on average less than half a tick per trade, is certain to destroy its profitability.

Successfully Implementing HFT Strategies on a Retail Platform

For many years I assumed that the only solution to the fill rate problem was to implement scalping strategies on HFT infrastructure.  One day, I found myself asking the question:  what would happen if we slowed the strategy down?  Specifically, suppose we took the 3-minute E-Mini strategy and ran it on 5-minute bars?

My first realization was that the relative simplicity of alpha-generation algorithms in HFT strategies is an advantage here.  In a low frequency context, the complexity of the alpha extraction process mitigates its ability to generalize to other assets or time-frames.  But HFT algorithms are, by and large, simple and generic: what works on 3-minute bars for the E-Mini futures might work on 5-minute bars in E-Minis, or even in SPY.  For instance, if the essence of the algorithm is something as simple as: “buy when the price falls by more than x% below its y-bar moving average”, that approach might work on 3-minute, 5-minute, 60-minute, or even daily bars.

So what happens if we run the E-mini scalping system on 5-minute bars instead of 3-minute bars?

Obviously the overall profitability of the strategy is reduced, in line with the lower number of trades on this slower time-scale.   But note that average trade has increased and the strategy remains very profitable overall.

fig8 fig9

More importantly, the average extreme hit rate has fallen from 34% to 22%.

fig6

Hence, not only do we get fewer, slightly more profitable trades, but a much lower proportion of them occur at the extreme of the 5-minute bars.  Consequently the fill-rate issue is less critical on this time frame.

Of course, one can continue this process.  What about 10-minute bars, or 30-minute bars?  What one tends to find from such experiments is that there is a time frame that optimizes the trade-off between strategy profitability and fill rate dependency.

However, there is another important factor we need to elucidate.  If you examine the trading record from the system you will see substantial variation in the extreme hit rate from day to day (for example, it is as high as 46% on 10/18, compared to the overall average of 22%).  In fact, there are significant variations in the extreme hit rate during the course of each trading day, with rates rising during slower market intervals such as from 12 to 2pm.  The important realization that eventually occurred to me is that, of course, what matters is not clock time (or “wall time” in HFT parlance) but trade time:  i.e. the rate at which trades occur.

Wall Time vs Trade Time

What we need to do is reconfigure our chart to show bars comprising a specified number of trades, rather than a specific number of minutes.  In this scheme, we do not care whether the elapsed time in a given bar is 3-minutes, 5-minutes or any other time interval: all we require is that the bar comprises the same amount of trading activity as any other bar.  During high volume periods, such as around market open or close, trade time bars will be shorter, comprising perhaps just a few seconds.  During slower periods in the middle of the day, it will take much longer for the same number of trades to execute.  But each bar represents the same level of trading activity, regardless of how long a period it may encompass.

How do you decide how may trades per bar you want in the chart?

As a rule of thumb, a strategy will tolerate an extreme hit rate of between 15% and 25%, depending on the daily trade rate.  Suppose that in its original implementation the strategy has an unacceptably high hit rate of 50%.  And let’s say for illustrative purposes that each time-bar produces an average of 1, 000 contracts.  Since volatility scales approximately with the square root of time, if we want to reduce the extreme hit rate by a factor of 2, i.e. from 50% to 25%, we need to increase the average number of trades per bar by a factor of 2^2, i.e. 4.  So in this illustration we would need volume bars comprising 4,000 contracts per bar.  Of course, this is just a rule of thumb – in practice one would want to implement the strategy of a variety of volume bar sizes in a range from perhaps 3,000 to 6,000 contracts per bar, and evaluate the trade-off between performance and fill rate in each case.

Using this approach, we arrive at a volume bar configuration for the E-Mini scalping strategy of 20,000 contracts per bar.  On this “time”-frame, trading activity is reduced to around 20-25 trades per day, but with higher win rate and average trade size.  More importantly, the extreme hit rate runs at a much lower average of 22%, which means that the trader has to worry about maybe only 4 or 5 trades per day that occur at the extreme of the volume bar.  In this scenario manual intervention is likely to have a much less deleterious effect on trading performance and the strategy is probably viable, even on a retail trading platform.

(Note: the results below summarize the strategy performance only over the last six months, the time period for which volume bars are available).


fig7


fig10 fig11

Concluding Remarks

We have seen that is it feasible in principle to implement a HFT scalping strategy on a retail platform by slowing it down, i.e. by implementing the strategy on bars of lower frequency.  The simplicity of many HFT alpha generation algorithms often makes them robust to generalization across time frames (and sometimes even across assets).  An even better approach is to use volume bars, or trade-time, to implement the strategy.  You can estimate the appropriate bar size using the square root of time rule to adjust the bar volume to produce the requisite fill rate.  An extreme hit rate if up to 25% may be acceptable, depending on the daily trade rate, although a hit rate in the range of 10% to 15% would typically be ideal.

Finally, a word about data.  While necessary compromises can be made with regard to the trading platform and connectivity, the same is not true for market data, which must be of the highest quality, both in terms of timeliness and completeness. The reason is self evident, especially if one is attempting to implement a strategy in trade time, where the integrity and latency of market data is crucial. In this context, using the data feed from, say, Interactive Brokers, for example, simply will not do – data delivered in 500ms packets in entirely unsuited to the task.  The trader must seek to use the highest available market data feed that he can reasonably afford.

That caveat aside, one can conclude that it is certainly feasible to implement high volume scalping strategies, even on a retail trading platform, providing sufficient care is taken with the modeling and implementation of the system.

The Information Content of the Pre- and Post-Market Trading Sessions

I apologize in advance for this rather “wonkish” post, which is aimed chiefly at the high frequency fraternity, or those at least who trade intra-day, in the equity markets.  Such minutiae are the lot of those engaged in high frequency trading.  I promise that my next post will be of more general interest.

Pre- and Post Market Sessions

The pre-market session in US equities runs from 8:00 AM ET, while the post-market session runs until 8:00 PM ET.  The question arises whether these sessions are worth trading, or at the very least, offer a source of data (quotes, trades) that might be relevant to trading the regular session, which of course runs from 9:30 AM to 4:00 PM ET.  Even if liquidity is thin and trades infrequent, and opportunities in the pre- and post-market very limited, it might be that we can improve our trading models by taking into account such information as these sessions do provide, even if we only ever plan to trade during regular trading hours.

It is somewhat challenging to discuss this in great detail, because HFT equity trading is very much in the core competencies of my firm, Systematic Strategies.  However, I hope to offer some ideas, at least, that some readers may find useful.

SSALGOTRADING AD


A Tale of Two Pharmaceutical Stocks

In what follows I am going to make use of two examples from the pharmaceutical industry: Alexion Pharmaceuticals, Inc. (ALXN), which has a market cap of $35Bn and trades around 800,000 shares daily, and Pfizer Inc. (PFE), which has a market cap of over $200Bn and trades close to 50M shares a day.

Let’s start by looking at a system trading ALXN during regular market hours.  The system isn’t high frequency, but trades around 1-2 times a day, on average.  The strategy equity curve from 2015 to April 2016 is not at all impressive.


ALXN Regular

ALXN – Regular Session Only


But look at the equity curve for the same strategy when we allow it to run on the pre- and post-market sessions, in addition to regular trading hours.  Clearly the change in the trading hours utilized by the strategy has made a huge improvement in the total gain and risk-adjusted returns.


ALEXN with pre-market

ALXN – with Pre- and Post-Market Sessions


The PFE system trades much more frequently, around 4 times a day, but the story is somewhat similar in terms of how including the pre- and post-market sessions appears to improve its performance.

PFE Regular

PFE – Regular Session Only

PFE with premarket

PFE – with Pre- and Post-Market Sessions


Improving Trading Performance

In both cases, clearly, the trading performance of the strategies has improved significantly with the inclusion of the out-of-hours sessions.  In the case of ALXN, we see a modest increase of around 10% in the total number of trades, but in the case of PFE the increase in trading activity is much more marked – around 30%, or more.

The first important question to ask is when these additional trades are occurring.  Assuming that most of them take place during the pre- or post-market, our concern might be whether there is likely to be sufficient liquidity to facilitate trades of the frequency and size we wish to execute.  Of various possible hypotheses, some negative, other positive, we might consider the following:

(a) Bad ticks in the market data feed during out-of-hours sessions give rise to apparently highly profitable “phantom” trades

(b) The market data is valid, but the trades are done in such low volume as to be insignificant for practical purposes (i.e. trades were done for a few hundred lots and additional liquidity is unlikely to be available)

(c) Out-of-hours sessions enable the system to improve profitability by entering or exiting positions in a more timely manner than by trading the regular session alone

(d) Out-of-hours market data improves the accuracy of model forecasts, facilitating a larger number of trades, and/or more profitable trades, during regular market hours

An analysis of the trading activity for the two systems provides important insight as to which of the possible explanations might be correct.


ALXN Analysis

(click to enlarge)

Dealing first with ALXN, we that, indeed, an additional 11% of trades are entered or exited out-of-hours.  However, these additional trades account for somewhere between 17% (on exit) and 20% (on entry) of the total profits.  Furthermore, the size of the average entry trade during the post-market session and of the average exit trade in the pre-market session is more than double that of the average trade entered or exited during regular market hours. That gives concerns that some of the apparent increase in profits may be due to bad ticks at prices away from the market, allowing the system enter or exit trades at unrealistically low or high prices.  Even if many of the trades are good, we will have concerns about the scalability of the strategy in out-of-hours trading, given the relatively poor liquidity in the stock. On the other hand, at least some of the uplift in profits arises from new trades occurring during the regular session. This suggests that, even if we are unable to execute many of the trading opportunities seen during pre- or post-market, the trades from those sessions provides useful additional data points for our model, enabling it to increase the number and/or profitability of trades in the regular session.

Next we turn to PFE.  We can see straight away that, while the proportion of trades occurring during out-of-hours sessions is around 23%, those trades now account for over 50% of the total profits.  Furthermore, the average PL for trades executed on entry post-market, and on exit pre-market, is more than 4x the average for trades entered or exited during normal market hours.  Despite the much better liquidity in PFE compared to ALXN, this is a huge concern – we might expect to see significant discrepancies occurring between theoretical and actual performance of the strategy, due to the very high dependency on out-of-hours trading.

PFE Analysis

(click to enlarge)

As we dig further into the analysis, we do indeed find evidence that bad data ticks play a disproportionate role.  For example, this trade in PFE which apparently occurred at around 16:10 on 4/6 was almost certainly a phantom trade resulting from a bad data point. It turns out that, for whatever reason, such bad ticks are a common occurrence in the stock and account for a large proportion of the apparent profitability of out-of-hours trading in PFE.


PFE trade


CONCLUSION

We are, of course, only skimming the surface of the analysis that is typically carried out.  One would want to dig more deeply into ways in which the market data feed could be cleaned up and bad data ticks filtered out so as to generate fewer phantom trades.  One would also want to look at liquidity across the various venues where the stocks trade, including dark pools, in order to appraise the scalability of the strategies.

For now, the main message that I am seeking to communicate is that it is often well worthwhile considering trading in the pre- and post-market sessions, not only with a view to generating additional, profitable trading opportunities, but also to gather additional data points that can enhance trading profitability during regular market hours.

A High Frequency Scalping Strategy on Collective2

Scalping vs. Market Making

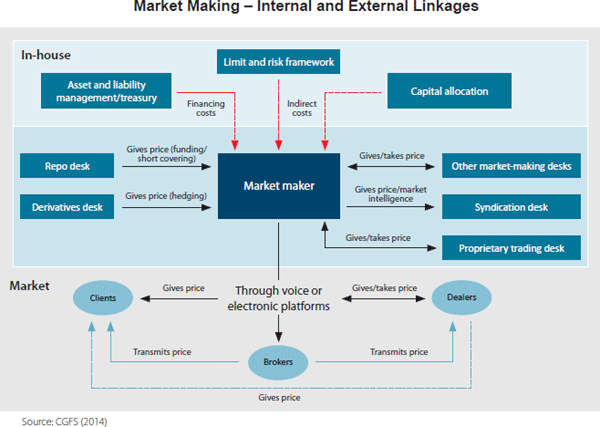
A market-making strategy is one in which the system continually quotes on the bid and offer and looks to make money from the bid-offer spread (and also, in the case of equities, rebates).  During a typical trading day, inventories will build up on the long or short side of the book as the market trades up and down.  There is no intent to take a market view as such, but most sophisticated market making strategies will use microstructure models to help decide whether to “lean” on the bid or offer at any given moment. Market makers may also shade their quotes to reduce the buildup of inventory, or even pull quotes altogether if they suspect that informed traders are trading against them (a situation referred to as “toxic flow”).  They can cover short positions through the repo desk and use derivatives to hedge out the risk of an accumulated inventory position.

marketmaking

A scalping strategy shares some of the characteristics of  a market making strategy:  it will typically be mean reverting, seeking to enter passively on the bid or offer and the average PL per trade is often in the region of a single tick.  But where a scalping strategy differs from market making is that it does take a view as to when to get long or short the market, although that view may change many times over the course of a trading session.  Consequently, a scalping strategy will only ever operate on one side of the market at a time, working the bid or offer; and it will typically never build inventory, since will it usually reverse and later try to sell for a profit the inventory it has previously purchased, hopefully at a lower price.

In terms of performance characteristics, a market making strategy will often have a double-digit Sharpe Ratio, which means that it may go for many days, weeks, or months, without taking a loss.  Scalping is inherently riskier, since it is taking directional bets, albeit over short time horizons.  With a Sharpe Ratio in the region of 3 to 5, a scalping strategy will often experience losing days and even losing months.

So why prefer scalping to market making?  It’s really a question of capability.  Competitive advantage in scalping derives from the successful exploitation of identified sources of alpha, whereas  market making depends primarily on speed and execution capability. Market making requires HFT infrastructure with latency measured in microseconds, the ability to layer orders up and down the book and manage order priority.  Scalping algos are generally much less demanding in terms of trading platform requirements: depending on the specifics of the system, they can be implemented successfully on many third party networks.

Developing HFT Futures Strategies

Some time ago my firm Systematic Strategies began research and development on a number of HFT strategies in futures markets.  Our primary focus has always been HFT equity strategies, so this was something of a departure for us, one that has entailed a significant technological obstacles (more on this in due course). Amongst the strategies we developed were several very profitable scalping algorithms in fixed income futures.  The majority trade at high frequency, with short holding periods measured in seconds or minutes, trading tens or even hundreds of times a day.

xtraderThe next challenge we faced was what to do with our research product.  As a proprietary trading firm our first instinct was to trade the strategies ourselves; but the original intent had been to develop strategies that could provide the basis of a hedge fund or CTA offering.  Many HFT strategies are unsuitable for that purpose, since the technical requirements exceed the capabilities of the great majority of standard trading platforms typically used by managed account investors. Besides, HFT strategies typically offer too limited capacity to be interesting to larger, institutional investors.

In the end we arrived at a compromise solution, keeping the highest frequency strategies in-house, while offering the lower frequency strategies to outside investors. This enabled us to keep the limited capacity of the highest frequency strategies for our own trading, while offering investors significant capacity in strategies that trade at lower frequencies, but still with very high performance characteristics.

HFT Bond Scalping

A typical example is the following scalping strategy in US Bond Futures.  The strategy combines two of the lower frequency algorithms we developed for bond futures that scalp around 10 times per session.  The strategy attempts to take around 8 ticks out of the market on each trade and averages around 1 tick per trade.   With a Sharpe Ratio of over 3, the strategy has produced net profits of approximately $50,000 per contract per year, since 2008.    A pleasing characteristic of this and other scalping strategies is their consistency:  There have been only 10 losing months since January 2008, the last being a loss of $7,100 in Dec 2015 (the prior loss being $472 in July 2013!)

Annual P&L

Fig2

Strategy Performance

fig4Fig3


Offering The Strategy to Investors on Collective2

The next challenge for us to solve was how best to introduce the program to potential investors.  Systematic Strategies is not a CTA and our investors are typically interested in equity strategies.  It takes a great deal of hard work to persuade investors that we are able to transfer our expertise in equity markets to the very different world of futures trading. While those efforts are continuing with my colleagues in Chicago, I decided to conduct an experiment:  what if we were to offer a scalping strategy through an online service like Collective2?  For those who are unfamiliar, Collective2 is an automated trading-system platform that allowed the tracking, verification, and auto-trading of multiple systems.  The platform keeps track of the system profit and loss, margin requirements, and performance statistics.  It then allows investors to follow the system in live trading, entering the system’s trading signals either manually or automatically.

Offering a scalping strategy on a platform like this certainly creates visibility (and a credible track record) with investors; but it also poses new challenges.  For example, the platform assumes trading cost of around $14 per round turn, which is at least 2x more expensive than most retail platforms and perhaps 3x-5x more expensive than the cost a HFT firm might pay.  For most scalping strategies that are designed to take a tick out of the market such high fees would eviscerate the returns.  This motivated our choice of US Bond Futures, since the tick size and average trade are sufficiently large to overcome even this level of trading friction.  After a couple of false starts, during which we played around with the algorithms and boosted strategy profitability with a couple of low frequency trades, the system is now happily humming along and demonstrating the kind of performance it should (see below).

For those who are interested in following the strategy’s performance, the link on collective2 is here.


Collective2Perf

trades

Disclaimer

About the results you see on this Web site

Past results are not necessarily indicative of future results.

These results are based on simulated or hypothetical performance results that have certain inherent limitations. Unlike the results shown in an actual performance record, these results do not represent actual trading. Also, because these trades have not actually been executed, these results may have under-or over-compensated for the impact, if any, of certain market factors, such as lack of liquidity. Simulated or hypothetical trading programs in general are also subject to the fact that they are designed with the benefit of hindsight. No representation is being made that any account will or is likely to achieve profits or losses similar to these being shown.

In addition, hypothetical trading does not involve financial risk, and no hypothetical trading record can completely account for the impact of financial risk in actual trading. For example, the ability to withstand losses or to adhere to a particular trading program in spite of trading losses are material points which can also adversely affect actual trading results. There are numerous other factors related to the markets in general or to the implementation of any specific trading program, which cannot be fully accounted for in the preparation of hypothetical performance results and all of which can adversely affect actual trading results.

Material assumptions and methods used when calculating results

The following are material assumptions used when calculating any hypothetical monthly results that appear on our web site.

  • Profits are reinvested. We assume profits (when there are profits) are reinvested in the trading strategy.
  • Starting investment size. For any trading strategy on our site, hypothetical results are based on the assumption that you invested the starting amount shown on the strategy’s performance chart. In some cases, nominal dollar amounts on the equity chart have been re-scaled downward to make current go-forward trading sizes more manageable. In these cases, it may not have been possible to trade the strategy historically at the equity levels shown on the chart, and a higher minimum capital was required in the past.
  • All fees are included. When calculating cumulative returns, we try to estimate and include all the fees a typical trader incurs when AutoTrading using AutoTrade technology. This includes the subscription cost of the strategy, plus any per-trade AutoTrade fees, plus estimated broker commissions if any.
  • “Max Drawdown” Calculation Method. We calculate the Max Drawdown statistic as follows. Our computer software looks at the equity chart of the system in question and finds the largest percentage amount that the equity chart ever declines from a local “peak” to a subsequent point in time (thus this is formally called “Maximum Peak to Valley Drawdown.”) While this is useful information when evaluating trading systems, you should keep in mind that past performance does not guarantee future results. Therefore, future drawdowns may be larger than the historical maximum drawdowns you see here.

Trading is risky

There is a substantial risk of loss in futures and forex trading. Online trading of stocks and options is extremely risky. Assume you will lose money. Don’t trade with money you cannot afford to lose.

High Frequency Trading: Equities vs. Futures

A talented young system developer I know recently reached out to me with an interesting-looking equity curve for a high frequency strategy he had designed in E-mini futures:

Fig1

Pretty obviously, he had been making creative use of the “money management” techniques so beloved by futures systems designers.  I invited him to consider how it would feel to be trading a 1,000-lot E-mini position when the market took a 20 point dive.  A $100,000 intra-day drawdown might make the strategy look a little less appealing.  On the other hand, if you had already made millions of dollars in the strategy, you might no longer care so much.

SSALGOTRADING AD

A more important criticism of money management techniques is that they are typically highly path-dependent:  if you had started your strategy slightly closer to one of the drawdown periods that are almost unnoticeable on the chart, it could have catastrophic consequences for your trading account.  The only way to properly evaluate this, I advised, was to backtest the strategy over many hundreds of thousands of test-runs using Monte Carlo simulation.  That would reveal all too clearly that the risk of ruin was far larger than might appear from a single backtest.

Next, I asked him whether the strategy was entering and exiting passively, by posting bids and offers, or aggressively, by crossing the spread to sell at the bid and buy at the offer.  I had a pretty good idea what his answer would be, given the volume of trades in the strategy and, sure enough he confirmed the strategy was using passive entries and exits.  Leaving to one side the challenge of executing a trade for 1,000 contracts in this way, I instead ask him to show me the equity curve for a single contract in the underlying strategy, without the money-management enhancement. It was still very impressive.

Fig2


The Critical Fill Assumptions For Passive Strategies

But there is an underlying assumption built into these results, one that I have written about in previous posts: the fill rate.  Typically in a retail trading platform like Tradestation the assumption is made that your orders will be filled if a trade occurs at the limit price at which the system is attempting to execute.  This default assumption of a 100% fill rate is highly unrealistic.  The system’s orders have to compete for priority in the limit order book with the orders of many thousands of other traders, including HFT firms who are likely to beat you to the punch every time.  As a consequence, the actual fill rate is likely to be much lower: 10% to 20%, if you are lucky.  And many of those fills will be “toxic”:  buy orders will be the last to be filled just before the market  moves lower and sell orders will be the last to get filled just as the market moves higher. As a result, the actual performance of the strategy will be a very long way from the pretty picture shown in the chart of the hypothetical equity curve.

One way to get a handle on the problem is to make a much more conservative assumption, that your limit orders will only get filled when the market moves through them.  This can easily be achieved in a product like Tradestation by selecting the appropriate backtest option:

fig3


The strategy performance results often look very different when this much more conservative fill assumption is applied.  The outcome for this system was not at all unusual:

Fig4


Of course, the more conservative assumption applied here is also unrealistic:  many of the trading system’s sell orders would be filled at the limit price, even if the market failed to move higher (or lower in the case of a buy order).  Furthermore, even if they were not filled during the bar-interval in which they were issued, many limit orders posted by the system would be filled in subsequent bars.  But the reality is likely to be much closer to the outcome assuming a conservative fill-assumption than an optimistic one.    Put another way:  if the strategy demonstrates good performance under both pessimistic and optimistic fill assumptions there is a reasonable chance that it will perform well in practice, other considerations aside.

An Example of a HFT Equity Strategy

Let’s contrast the futures strategy with an example of a similar HFT strategy in equities.  Under the optimistic fill assumption the equity curve looks as follows:

Fig5

Under the more conservative fill assumption, the equity curve is obviously worse, but the strategy continues to produce excellent returns.  In other words, even if the market moves against the system on every single order, trading higher after a sell order is filled, or lower after a buy order is filled, the strategy continues to make money.

Fig6

Market Microstructure

There is a fundamental reason for the discrepancy in the behavior of the two strategies under different fill scenarios, which relates to the very different microstructure of futures vs. equity markets.   In the case of the E-mini strategy the average trade might be, say, $50, which is equivalent to only 4 ticks (each tick is worth $12.50).  So the average trade: tick size ratio is around 4:1, at best.  In an equity strategy with similar average trade the tick size might be as little as 1 cent.  For a futures strategy, crossing the spread to enter or exit a trade more than a handful of times (or missing several limit order entries or exits) will quickly eviscerate the profitability of the system.  A HFT system in equities, by contrast, will typically prove more robust, because of the smaller tick size.
Of course, there are many other challenges to high frequency equity trading that futures do not suffer from, such as the multiplicity of trading destinations.  This means that, for instance, in a consolidated market data feed your system is likely to see trading opportunities that simply won’t arise in practice due to latency effects in the feed.  So the profitability of HFT equity strategies is often overstated, when measured using a consolidated feed.  Futures, which are traded on a single exchange, don’t suffer from such difficulties.  And there are a host of other differences in the microstructure of futures vs equity markets that the analyst must take account of.  But, all that understood, in general I would counsel that equities make an easier starting point for HFT system development, compared to futures.

A High Frequency Market Making Algorithm


This algorithm builds on the research by Stoikova and Avelleneda in their 2009 paper “High Frequency Trading in a Limit Order Book“, 2009 and extends the basic algorithm in several ways:

  1. The algorithm makes two sided markets in a specified list of equities, with model parameters set at levels appropriate for each product.
  2. The algorithm introduces an automatic mechanism for managing inventory, reducing the risk of adverse selection by changing the rate of inventory accumulation dynamically.
  3. The algorithm dynamically adjusts the range of the bid-ask spread as the trading session progresses, with the aim of minimizing inventory levels on market close.
  4. The extended algorithm makes use of estimates of recent market trends and adjusts the bid-offer spread to lean in the direction of the trend.
  5. A manual adjustment factor allows the market-maker to nudge the algorithm in the direction of reducing inventory.

The algorithm is implemented in Mathematica, and can be compiled to create dlls callable from with a C++ or Python application.

The application makes use of the MATH-TWS library to connect to the Interactive Brokers TWS or Gateway platform via the C++ api. MATH-TWS is used to create orders, manage positions and track account balances & P&L.


Reflections on Careers in Quantitative Finance

CMU’s MSCF Program

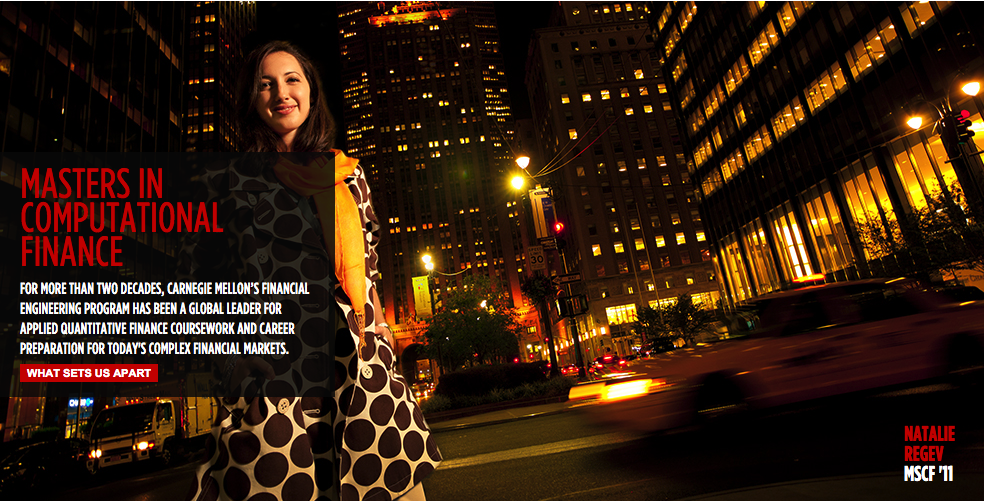
Carnegie Mellon’s Steve Shreve is out with an interesting post on careers in quantitative finance, with his commentary on the changing landscape in quantitative research and the implications for financial education.

I taught at Carnegie Mellon in the late 1990’s, including its excellent Master’s program in quantitative finance that Steve co-founded, with Sanjay Srivastava.  The program was revolutionary in many ways and was immediately successful and rapidly copied by rival graduate schools (I help to spread the word a little, at Cambridge).

Fig1The core of the program remains largely unchanged over the last 20 years, featuring Steve’s excellent foundation course in stochastic calculus;  but I am happy to see that the school has added many, new and highly relevant topics to the second year syllabus, including market microstructure, machine learning, algorithmic trading and statistical arbitrage.  This has moved the program in terms of its primary focus, which was originally financial engineering, to include coverage of subjects that are highly relevant to quantitative investment research and trading.

It was this combination of sound theoretical grounding with practitioner-oriented training that made the program so successful.  As I recall, every single graduate was successful in finding a job on Wall Street, often at salaries in excess of $200,000, a considerable sum in those days.  One of the key features of the program was that it combined theoretical concepts with practical training, using a simulated trading floor gifted by Thomson Reuters (a model later adopted btrading-floor-1y the ICMA centre at the University of Reading in the UK).  This enabled us to test students’ understanding of what they had been taught, using market simulation models that relied upon key theoretical ideas covered in the program.  The constant reinforcement of the theoretical with the practical made for a much deeper learning experience for most students and greatly facilitated their transition to Wall Street.

Masters in High Frequency Finance

While CMU’s program has certainly evolved and remains highly relevant to the recruitment needs of Wall Street firms, I still believe there is an opportunity for a program focused exclusively on high frequency finance, as previously described in this post.  The MHFF program would be more computer science oriented, with less emphasis placed on financial engineering topics.  So, for instance, students would learn about trading hardware and infrastructure, the principles of efficient algorithm design, as well as HFT trading techniques such as order layering and priority management.  The program would also cover HFT strategies such as latency arbitrage, market making, and statistical arbitrage.  Students would learn both lower level (C++, Java) and higher level (Matlab, R) programming languages and there is  a good case for a mandatory machine code programming course also.  Other core courses might include stochastic calculus and market microstructure.

Who would run such a program?  The ideal school would have a reputation for excellent in both finance and computer science. CMU is an obvious candidate, as is MIT, but there are many other excellent possibilities.

Careers

I’ve been involved in quantitative finance since the beginning:  I recall programming one of the first 68000 Assembler microcomputers in the 1980s, which was ultimately used for an F/X system at a major UK bank. The ensuing rapid proliferation of quantitative techniques in finance has been fueled by the ubiquity of cheap computing power, facilitating the deployment of quantitate techniques that would previously been impractical to implement due to their complexity.  A good example is the machine learning techniques that now pervade large swathes of the finance arena, from credit scoring to HFT trading.  When I first began working in that field in the early 2000’s it was necessary to assemble a fairly sizable cluster of cpus to handle the computation load. These days you can access comparable levels of computational power on a single server and, if you need more, you can easily scale up via Azure or EC2.

fig3It is this explosive growth in computing power  that has driven the development of quantitative finance in both the financial engineering and quantitative investment disciplines. As the same time, the huge reduction in the cost of computing power has leveled the playing field and lowered barriers to entry.  What was once the exclusive preserve of the sell-side has now become readily available to many buy-side firms.  As a consequence, much of the growth in employment opportunities in quantitative finance over the last 20 years has been on the buy-side, with the arrival of quantitative hedge funds and proprietary trading firms, including my own, Systematic Strategies.  This trend has a long way to play out so that, when also taking into consideration the increasing restrictions that sell-side firms face in terms of their proprietary trading activity, I am inclined to believe that the buy-side will offer the best employment opportunities for quantitative financiers over the next decade.

It was often said that hedge fund managers are typically in their 30’s or 40’s when they make the move to the buy-side. That has changed in the last 15 years, again driven by the developments in technology.  These days you are more likely to find the critically important technical skills in younger candidates, in their late 20’s or early 30’s.  My advice to those looking for a career in quantitative finance, who are unable to find the right job opportunity, would be: do what every other young person in Silicon Valley is doing:  join a startup, or start one yourself.


Daytrading Volatility ETFs

ETFAs we have discussed before, there is no standard definition of high frequency trading.  For some, trading more than once or twice a day constitutes high frequency, while others regard anything less than several hundred times a session as low, or medium frequency trading.  Hence in this post I have referred to “daytrading” since we can at least agree on that description for a strategy that exits all positions by the close of the session.

HFT Trading in ETFs – Challenges and Opportunities

High frequency trading in equities and ETFs offer their own opportunities and challenges compared to futures. Amongst the opportunities we might list:

  • Arbitrage between destinations (exchanges, dark pools) where the stock is traded
  • Earning rebates from the exchanges willing to pay for order flow
  • Arbitraging news flows amongst pairs or baskets of equities

When it comes to ETFs, unfortunately, the set of possibilities is more restricted than for single names and one is often obliged to dig deeply into the basket/replication/cointegration type of approach, which can be very challenging in a high frequency context.  The risk of one leg of a multi-asset trade being left unfilled is such that one has to be willing to cross the spread to get the trade on.  Depending on the trading platform and the quality of the execution algorithms, this can make trading the strategy prohibitively expensive.

In that case you have a number of possibilities to consider.  You can simplify the trade, limit the number of stocks in the basket and hope that there is enough alpha left in the reduced strategy. You can focus on managing the trade execution sufficiently well that aggressive trading becomes necessary on relatively few occasions and you look to minimize the costs of paying the spread when they arise.  You can design strategies with higher profit factors that are able to withstand the performance drag entailed in trading aggressively.  Or you can design slower versions of the strategy where latency, fill rates and execution costs are not such critical factors.

SSALGOTRADING AD

Developing high frequency strategies in the volatility ETFs presents special challenges.  Being fairly new, the products have limited histories, which makes modeling more of a challenge.  One way to address this is to create synthetic series priced from the VIX futures, using the published methodology for constructing the ETFs.  Be warned, though, that these synthetic series are likely to inflate your backtest results since they aren’t traded instruments.

Another practical problem that crops up regularly in products like UVXY and VXX is that the broker has difficulty locating stock for short selling.  So you are limited to taking the strategy offline when that occurs, designing strategies that trade long only, or as we do, switching to other products when the ETF is unavailable to short.

Then there is the capacity issue. Despite their fast-growing popularity, volatility ETF funds are in many cases quite small, totaling perhaps a few hundred millions of dollars in AUM. You are never going to be able to construct a strategy capable of absorbing billions of dollars of investment in the ETF products alone.

Volatility and Alpha

volatilitychartFor these reasons, volatility ETFs are not a natural choice for many investment strategists.  But they do have one great advantage compared to other products:  volatility.  Volatility implies uncertainty about the true value of a security, which means that market participants can have very different views about what it is worth at any moment in time.  So the prospects for achieving competitive advantage through superior analytical methods is much greater than for a stock that hardly moves at all and on whose value everyone concurs.  Furthermore, volatility creates regular opportunities for hitting stops, and creating mini crashes or short squeezes, in which the security is temporarily under- or over-valued.  If ever there was a security offering the potential for generating alpha, it is the volatility ETF.

The volatility of the VIX ETFs is enormous, by the standards of regular stocks.  A typical stock might have an annual volatility of 30% to 60%.  The lowest level ever seen in the VVIX index series so far is 70%. To give you an idea of how extreme it can become, during the latest market swoon in August the VVIX, the volatility-of-volatility for the S&P500 index, reached over 200% a year.

A Daytrading Strategy in the VXX

So, despite the challenges and difficulties, there are very good reasons to make the attempt to develop strategies for the volatility ETF products.  My firm, Systematic Strategies, has developed several such algorithms that are combined to create a strategy that trades the volatility ETFs very successfully.  Until recently, however,  all of the sub-strategies we employ were longer term in nature, and entailed holding positions overnight.  We wanted to develop higher frequency algorithms that could react more quickly to changes in the volatility landscape.  We had to dig pretty deep into the arsenal of trading ideas to get there, but eventually we succeeded.  After six months of live trading we were ready to release the new VXX daytrading algorithm into production for our volatility ETF strategy investors.  Here’s how it looks (results are for a $100,000 account).

Fig 1 Fig 2 Fig 3

As you can see, the strategy trades up to around 10 times a day with a reasonable profit factor (1.53) and win rate of just under 60%. By itself, the strategy has a Sharpe Ratio of around 6, so it is well worth trading on its own.  But its real value (for us) emerges when it is combined in appropriate proportion with the other, lower frequency algorithms in the volatility strategy.  The additional alpha from the VXX strategy reduces the size of the loss in August and produces a substantial gain in September, taking the YTD return to just under 50%.  Returns for Oct MTD are already at 16%.

Vol Strategy perf Sept 2015


Making Money with High Frequency Trading

There is no standard definition of high frequency trading, nor a single type of strategy associated with it. Some strategies generate returns, not by taking any kind of view on market direction, but simply by earning Exchange rebates. In other cases the strategy might try to trade ahead of the news as it flows through the market, from stock to stock (or market to market).  Perhaps the most common and successful approach to HFT is market making, where one tries to earn (some fraction of) the spread by constantly quoting both sides of the market.  In the latter approach, which involves processing vast numbers of order messages and other market data in order to decide whether to quote (or pull a quote), latency is of utmost importance.  I would tend to argue that HFT market making owes its success as much, or more, to computer science than it does to trading or microstructure theory.

By contrast, Systematic Strategies’s approach to HFT has always been model-driven.  We are unable to outgun firms like Citadel or Getco in terms of their speed of execution; so, instead, we focus on developing theoretical models of market behavior, on the assumption that we are more likely to identify a source of true competitive advantage that way.  This leads to slower, less latency-sensitive strategies (the models have to be re-estimated or recomputed in real time), but which may nonetheless trade hundreds of times a day.

A good example is provided by our high frequency scalping strategy in Corn futures, which trades around 100-200 times a day, with a win rate of over 80%.

Corn Monthly PNL EC


One of the most important considerations in engineering a HFT strategy of this kind is to identify a suitable bar frequency.  We find that our approach works best using data at frequencies of 1-5 minutes, trading at latencies of around 1 millisec, whereas other firms are reacting to data tick-by-tick, with latencies measured in microseconds.

Often strategies are built using only data derived from with a single market, based on indicators involving price action, pattern trading rules, volume or volatility signals.  In other cases, however, signals are derived from other, related markets: the VXX-ES-TY complex would be a typical example of this kind of inter-market approach.

SSALGOTRADING AD

When we build strategies we often start by using a simple retail platform like TradeStation or MultiCharts.  We know that if the strategy can make money on a platform with retail levels of order and market data latency (and commission rates), then it should perform well when we transfer it to a production environment, with much lower latencies and costs.  We might be able to trade only 1-2 contracts in TradeStation, but in production we might aim to scale that up to 10-15 contract per trade, or more, depending on liquidity.  For that reason we prefer to trade only intraday, when market liquidity is deepest; but we often find sufficient levels of liquidity to make trading worthwhile 1-2 hours before the open of the day session.

Generally, while we look for outside money for our lower frequency hedge fund strategies, we tend not to do so for our HFT strategies.  After all, what’s the point?  Each strategy has limited capacity and typically requires no more than a $100,000 account, at most.  And besides, with Sharpe Ratios that are typically in double-digits, it’s usually in our economic interest to use all of the capacity ourselves.  Nor do we tend to license strategies to other trading firms.  Again, why would we?  If the strategies work, we can earn far more from trading rather than licensing them.

We have, occasionally, developed strategies for other firms for markets in which we have no interest (the KOSPI springs to mind).  But these cases tend to be the exception, rather than the rule.

High Frequency Trading Strategies

Most investors have probably never seen the P&L of a high frequency trading strategy.  There is a reason for that, of course:  given the typical performance characteristics of a HFT strategy, a trading firm has little need for outside capital.  Besides, HFT strategies can be capacity constrained, a major consideration for institutional investors.  So it is amusing to see the reaction of an investor on encountering the track record of a HFT strategy for the first time.  Accustomed as they are to seeing Sharpe ratios in the range of 0.5-1.5, or perhaps as high as 1.8, if they are lucky, the staggering risk-adjusted returns of a HFT strategy, which often have double-digit Sharpe ratios, are truly mind-boggling.

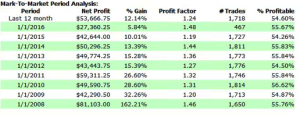
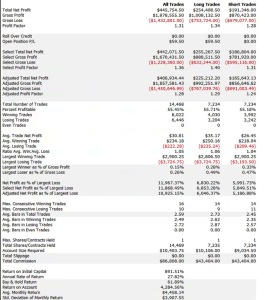
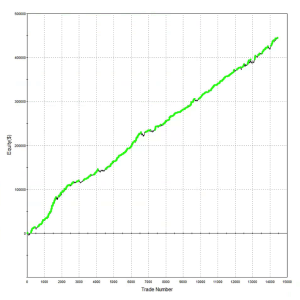
By way of illustration I have attached below the performance record of one such HFT strategy, which trades around 100 times a day in the eMini S&P 500 contract (including the overnight session).  Note that the edge is not that great – averaging 55% profitable trades and profit per contract of around half a tick – these are some of the defining characteristics of HFT trading strategies.  But due to the large number of trades it results in very substantial profits.  At this frequency, trading commissions are very low, typically under $0.1 per contract, compared to $1 – $2 per contract for a retail trader (in fact an HFT firm would typically own or lease exchange seats to minimize such costs).

Fig 2 Fig 3 Fig 4


Hidden from view in the above analysis are the overhead costs associated with implementing such a strategy: the market data feed, execution platform and connectivity capable of handling huge volumes of messages, as well as algo logic to monitor microstructure signals and manage order-book priority.  Without these, the strategy would be impossible to implement profitably.

SSALGOTRADING AD

Scaling things back a little, lets take a look at a day-trading strategy that trades only around 10 times a day, on 15-minute bars.  Although not ultra-high frequency, the strategy nonetheless is sufficiently high frequency to be very latency sensitive. In other words, you would not want to try to implement such a strategy without a high quality market data feed and low-latency trading platform capable of executing at the 1-millisecond level.  It might just be possible to implement a strategy of this kind using TT’s ADL platform, for example.

While the win rate and profit factor are similar to the first strategy, the lower trade frequency allows for a higher trade PL of just over 1 tick, while the equity curve is a lot less smooth reflecting a Sharpe ratio that is “only” around 2.7.

Fig 5 Fig 6 Fig 7


The critical assumption in any HFT strategy is the fill rate.  HFT strategies execute using limit or IOC orders and only a certain percentage of these will ever be filled.  Assuming there is alpha in the signal, the P&L grows in direct proportion to the number of trades, which in turn depends on the fill rate.  A fill rate of 10% to 20% is usually enough to guarantee profitability (depending on the quality of the signal). A low fill rate, such as would typically be seen if one attempted to trade on a retail trading platform, would  destroy the profitability of any HFT strategy.

To illustrate this point, we can take a look at the outcome if the above strategy was implemented on a trading platform which resulted in orders being filled only when the market trades through the limit price.  It isn’t a pretty sight.


Fig 8

The moral of the story is:  developing a HFT trading algorithm that contains a viable alpha signal is only half the picture.  The trading infrastructure used to implement such a strategy is no less critical.  Which is why HFT firms spend tens, or hundreds of millions of dollars developing the best infrastructure they can afford.