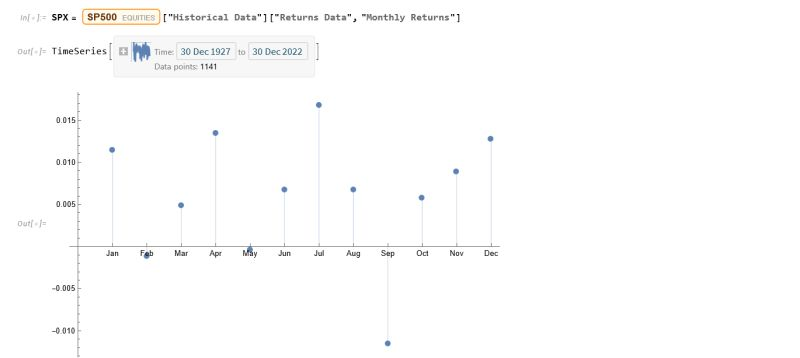
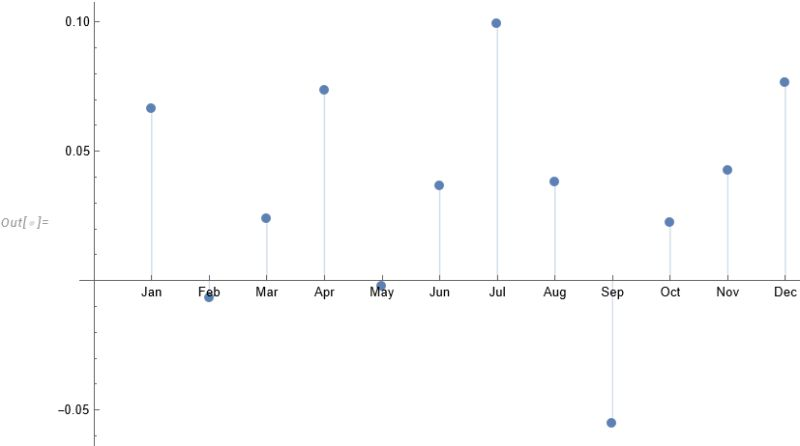
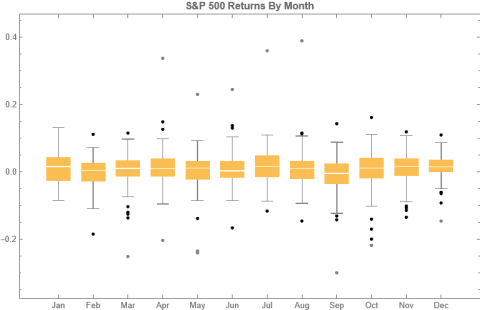
To amplify Valérie Noël‘s post a little, we can use the Equities Entity Store (https://lnkd.in/epg-5wwM) to extract returns for the S&P500 index for (almost) the last century and compute the average return by month, as follows.
July is shown to be (by far) the most positive month for the index, with an average return of +1.67%, in stark contrast to the month of Sept. in which the index has experienced an average negative return of -1.15%.
Continuing the analysis a little further, we can again use the the Equities Entity Store (https://lnkd.in/epg-5wwM) to extract estimated average volatility for the S&P500 by calendar month since 1927:
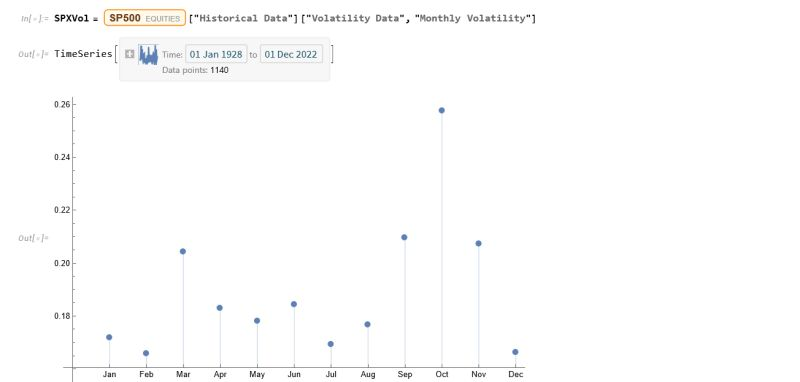
As you can see, July is not only the month with highest average monthly return, but also has amongst the lowest levels of volatility, on average.
Consequently, risk-adjusted average rates of return in July far exceed other months of the year.
Conclusion: bears certainly have a case that the market is over-stretched here, but I would urge caution: hold off until end Q3 before shorting this market in significant size.
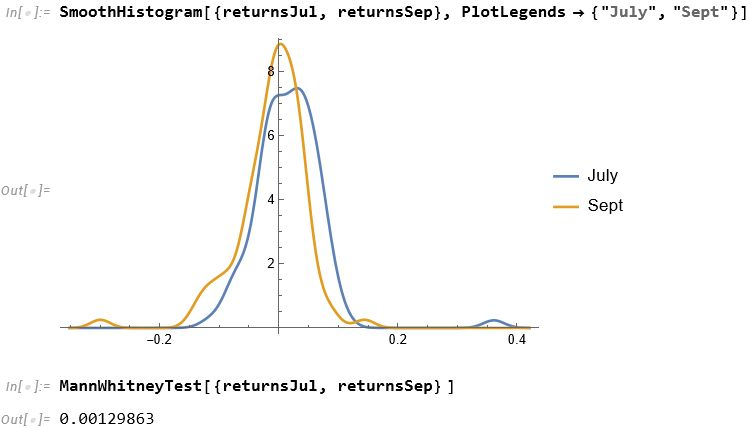
For those market analysts who prefer a little more analytical meat, we can compare the median returns for the #S&P500 Index for the months of July and September using the nonparametric MannWhitney test.
This indicates that there is only a 0.13% probability that the series of returns for the two months are generated from distributions with the same median.
Conclusion: Index performance in July really is much better than in September.
For more analysis along these lines, see my recent book, Equity Analytics: